Explore
 Validate
 Learn
Learn Western blot
 ELISA
ELISA Immunocytochemistry
Antibody data
- Antibody Data
- Antigen structure
- References [4]
- Comments [0]
- Validations
- Immunocytochemistry [2]
- Flow cytometry [1]
- Chromatin Immunoprecipitation [2]
- Other assay [3]
Submit
Validation data
Reference
Comment
Report error
- Product number
- 700505 - Provider product page

- Provider
- Invitrogen Antibodies
- Product name
- HIF1A Recombinant Rabbit Monoclonal Antibody (16H4L13)
- Antibody type
- Monoclonal
- Antigen
- Other
- Description
- This antibody is predicted to react with mouse based on sequence homology. Intact IgG appears on a non-reducing gel as ~150 kDa band and upon reduction generating a ~25 kDa light chain band and a ~50 kDa heavy chain. Recombinant rabbit monoclonal antibodies are produced using in vitro expression systems. The expression systems are developed by cloning in the specific antibody DNA sequences from immunoreactive rabbits. Then, individual clones are screened to select the best candidates for production. The advantages of using recombinant rabbit monoclonal antibodies include: better specificity and sensitivity, lot-to-lot consistency, animal origin-free formulations, and broader immunoreactivity to diverse targets due to larger rabbit immune repertoire.
- Reactivity
- Human
- Host
- Rabbit
- Isotype
- IgG
- Antibody clone number
- 16H4L13
- Vial size
- 100 μg
- Concentration
- 0.5 mg/mL
- Storage
- Store at 4°C short term. For long term storage, store at -20°C, avoiding freeze/thaw cycles.
Submitted references Human induced pluripotent stem cell-based platform for modeling cardiac ischemia.
CoCl(2) simulated hypoxia induce cell proliferation and alter the expression pattern of hypoxia associated genes involved in angiogenesis and apoptosis.
Reference Genes for Addressing Gene Expression of Bladder Cancer Cell Models under Hypoxia: A Step Towards Transcriptomic Studies.
Thyroid Transcription Factor 1 Reprograms Angiogenic Activities of Secretome.
Häkli M, Kreutzer J, Mäki AJ, Välimäki H, Lappi H, Huhtala H, Kallio P, Aalto-Setälä K, Pekkanen-Mattila M
Scientific reports 2021 Feb 18;11(1):4153
Scientific reports 2021 Feb 18;11(1):4153
CoCl(2) simulated hypoxia induce cell proliferation and alter the expression pattern of hypoxia associated genes involved in angiogenesis and apoptosis.
Rana NK, Singh P, Koch B
Biological research 2019 Mar 15;52(1):12
Biological research 2019 Mar 15;52(1):12
Reference Genes for Addressing Gene Expression of Bladder Cancer Cell Models under Hypoxia: A Step Towards Transcriptomic Studies.
Lima L, Gaiteiro C, Peixoto A, Soares J, Neves M, Santos LL, Ferreira JA
PloS one 2016;11(11):e0166120
PloS one 2016;11(11):e0166120
Thyroid Transcription Factor 1 Reprograms Angiogenic Activities of Secretome.
Wood LW, Cox NI, Phelps CA, Lai SC, Poddar A, Talbot C Jr, Mu D
Scientific reports 2016 Feb 25;6:19857
Scientific reports 2016 Feb 25;6:19857
No comments: Submit comment
Supportive validation
- Submitted by
- Invitrogen Antibodies (provider)
- Main image
- Experimental details
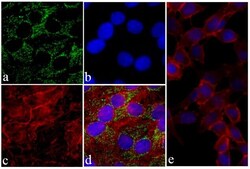
- Immunofluorescent analysis of HIF1-alpha was performed on 70% confluent log phase HeLa cells. The cells were fixed with 4% paraformaldehyde for 15 minutes, permeabilized with 0. 25% Triton X-100 for 10 minutes, and blocked with 5% BSA for 1 hour at room temperature. The cells were labeled with HIF1-alpha Recombinant Rabbit Monoclonal Antibody (Product # 700505) at a dilution of 1:400 in 1% BSA and incubated for 3 hours at room temperature and then labeled with Alexa Fluor® 488 Goat anti-Rabbit IgG secondary antibody (Product # A-11008) at a dilution of 1:400 for 30 minutes at room temperature (Panel a: green). Nuclei (Panel b: blue) were stained with SlowFade® Gold Antifade Mountant with DAPI (Product # S36938) F-actin (Panel c: red) was stained with Alexa Fluor® 594 phalloidin (Product # A12381) and panel d is a merged image showing cytoplasmic localization. Panel e is a control without primary antibody. The images were captured using a Nikon microscope at 20X magnification.

- Submitted by
- Invitrogen Antibodies (provider)
- Main image

- Experimental details
- Immunofluorescent analysis of HIF1-alpha was performed on 70% confluent log phase HeLa cells. The cells were fixed with 4% paraformaldehyde for 15 minutes, permeabilized with 0. 25% Triton X-100 for 10 minutes, and blocked with 5% BSA for 1 hour at room temperature. The cells were labeled with HIF1-alpha Recombinant Rabbit Monoclonal Antibody (Product # 700505) at a dilution of 1:400 in 1% BSA and incubated for 3 hours at room temperature and then labeled with Alexa Fluor® 488 Goat anti-Rabbit IgG secondary antibody (Product # A-11008) at a dilution of 1:400 for 30 minutes at room temperature (Panel a: green). Nuclei (Panel b: blue) were stained with SlowFade® Gold Antifade Mountant with DAPI (Product # S36938) F-actin (Panel c: red) was stained with Alexa Fluor® 594 phalloidin (Product # A12381) and panel d is a merged image showing cytoplasmic localization. Panel e is a control without primary antibody. The images were captured using a Nikon microscope at 20X magnification.

Supportive validation
- Submitted by
- Invitrogen Antibodies (provider)
- Main image
- Experimental details
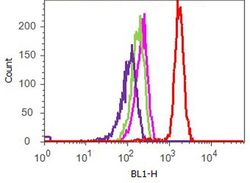
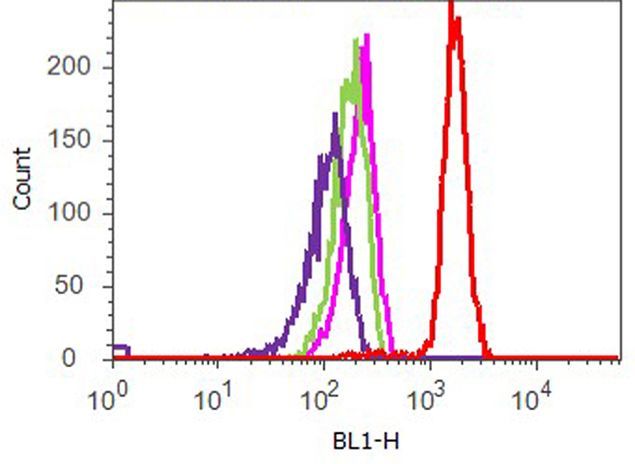
- Flow cytometry analysis of HIF1-alpha was performed on HeLa cells. Cells were fixed with 70% ethanol for 10 minutes, permeabilized with 0. 25% Tritonª X-100 for 20 minutes, and blocked with 5% BSA for 1 hour at room temperature. Cells were labeled with ABfinityª HIF1-alpha recombinant rabbit monoclonal antibody (Product # 700505, red histogram) or with rabbit isotype control (pink histogram) at a dilution of 1:400 in 2.5% BSA. After incubation at room temperature for 3 hours, the cells were labeled with Alexa Fluor¨ 488 goat anti-Rabbit Secondary antibody (Product # A11008) at a dilution of 1:400 for 30 minutes at room temperature. The representative 10,000 cells were acquired and analyzed for each sample using an Attune¨ Acoustic Focusing Cytometer. The purple histogram represents unstained control cells and the green histogram represents no-primary-antibody control.
Supportive validation
- Submitted by
- Invitrogen Antibodies (provider)
- Main image
- Experimental details
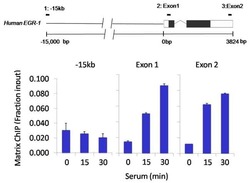
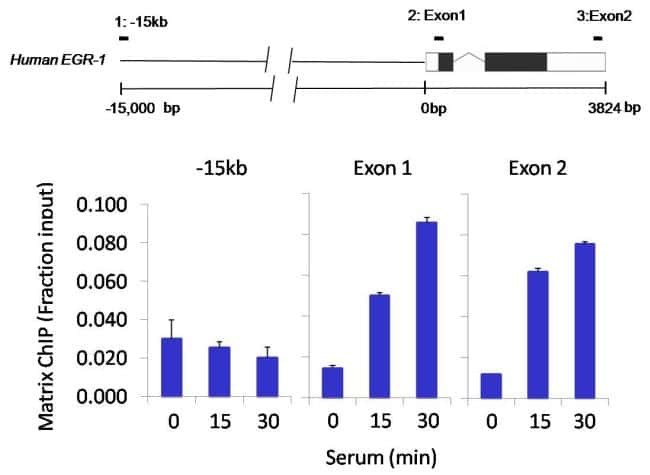
- Chromatin immunoprecipitation analysis of HIF-1 alpha was performed using cross-linked chromatin from 1 x 10^6 HCT116 human colon carcinoma cells treated with serum for 0, 15, and 30 minutes. Immunoprecipitation was performed using a multiplex microplate Matrix ChIP assay (see reference for Matrix ChIP protocol: http://www.ncbi.nlm.nih.gov/pubmed/22098709) with 1.0 µL/100 µL well volume of a HIF-1 alpha rabbit monoclonal antibody (Product # 700505). Chromatin aliquots from ~1 x 10^5 cells were used per ChIP pull-down. Quantitative PCR data were done in quadruplicate using 1 µL of eluted DNA in 2 µL SYBR real-time PCR reactions containing primers to amplify -15kb upstream of the human Egr-1 locus, or exon-1 or exon-2 of Egr-1. PCR calibration curves were generated for each primer pair from a dilution series of sheared total genomic DNA. Quantitation of immunoprecipitated chromatin is presented as signal relative to the total amount of input chromatin. Results represent the mean +/- SEM for three experiments. A schematic representation of the Egr-1 locus is shown above the data where boxes represent exons (black boxes = translated regions, white boxes = untranslated regions), the zigzag line represents an intron, and the straight line represents upstream sequence. Regions amplified by Egr-1 primers are represented by black bars. Data courtesy of the Innovators Program.
- Submitted by
- Invitrogen Antibodies (provider)
- Main image

- Experimental details
- Chromatin immunoprecipitation analysis of HIF-1 alpha was performed using cross-linked chromatin from 1 x 10^6 HCT116 human colon carcinoma cells treated with serum for 0, 15, and 30 minutes. Immunoprecipitation was performed using a multiplex microplate Matrix ChIP assay (see reference for Matrix ChIP protocol: http://www.ncbi.nlm.nih.gov/pubmed/22098709) with 1.0 µL/100 µL well volume of a HIF-1 alpha rabbit monoclonal antibody (Product # 700505). Chromatin aliquots from ~1 x 10^5 cells were used per ChIP pull-down. Quantitative PCR data were done in quadruplicate using 1 µL of eluted DNA in 2 µL SYBR real-time PCR reactions containing primers to amplify -15kb upstream of the human Egr-1 locus, or exon-1 or exon-2 of Egr-1. PCR calibration curves were generated for each primer pair from a dilution series of sheared total genomic DNA. Quantitation of immunoprecipitated chromatin is presented as signal relative to the total amount of input chromatin. Results represent the mean +/- SEM for three experiments. A schematic representation of the Egr-1 locus is shown above the data where boxes represent exons (black boxes = translated regions, white boxes = untranslated regions), the zigzag line represents an intron, and the straight line represents upstream sequence. Regions amplified by Egr-1 primers are represented by black bars. Data courtesy of the Innovators Program.

Supportive validation
- Submitted by
- Invitrogen Antibodies (provider)
- Main image

- Experimental details
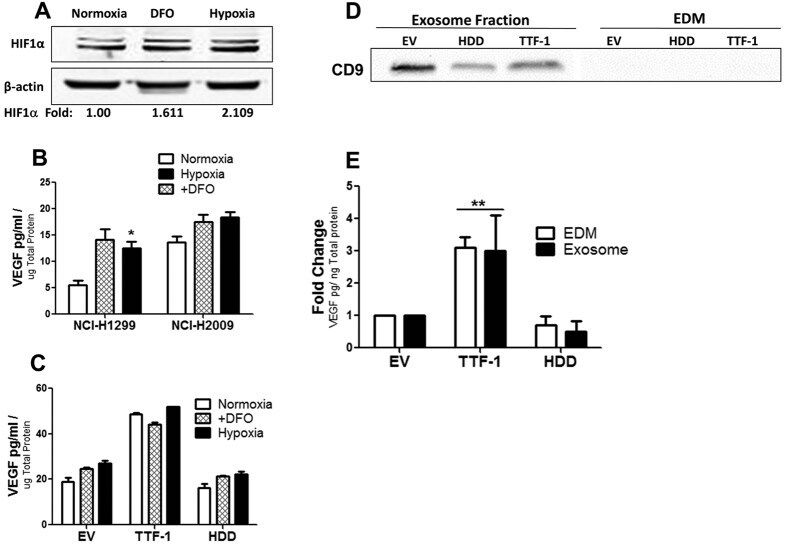
- Figure 6 The VEGF upregulated by TTF-1 is present in exosomes in a hypoxia-independent manner. Western blots of NCI-H1299 cells subject to hypoxia or DFO show an increase of HIF1alpha ( A ). VEGF was quantified in the CM of NCI-H1299 (TTF-1 - ) and NCI-H2009 (TTF-1 + ) under normoxia, hypoxia, or DFO treatment ( B ). The CM of the A549 cells retrovirally transfected with EV , HDD , or TTF-1 was analyzed by VEGF ELISA assays after three types of treatments, normoxia, hypoxia, or DFO ( C ). The exosomes and EDMs of A549-based transfectant cells were analyzed for CD9 protein expression by immunoblotting ( D ) and VEGF ELISA assays ( E ).
- Submitted by
- Invitrogen Antibodies (provider)
- Main image

- Experimental details
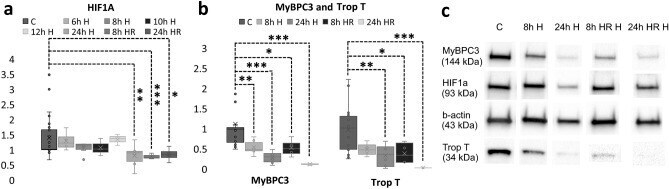
- Figure 4 ( a ) HIF1alpha expression in control (n = 26) samples and in 6 h (n = 4), 8 h (n = 6), 10 h (n = 3), 12 h (n = 3) and 24 h (n = 6) hypoxia or 8 h (n = 4) and 24 h (n = 4) hypoxia-reoxygenation time points from western blot analysis presented as mean + standard deviation. During the first 12 h of hypoxia, there seems to be no significant changes in the expression of the protein, although in 6 h and 12 h samples there is a slight increase. On the other hand, after 24 h of hypoxia, as well as after 8 h hypoxia-reoxygenation there is a statistically significant decrease in the HIF1alpha expression. ( b ) Expression of MyBPC3 and Troponin T decreases during 8 h (n = 6) and 24 h (n = 6) hypoxia, and 8 h (n = 4) and 24 h (n = 4) hypoxia-reoxygenation compared to control (n = 20) samples. The expression is especially low in 24 h hypoxia-reoxygenation samples but has decreased also in other hypoxia samples. ( c ) Examples of the western blot bands. *p < 0.05; **p < 0.01; ***p < 0.001.
- Submitted by
- Invitrogen Antibodies (provider)
- Main image
- Experimental details
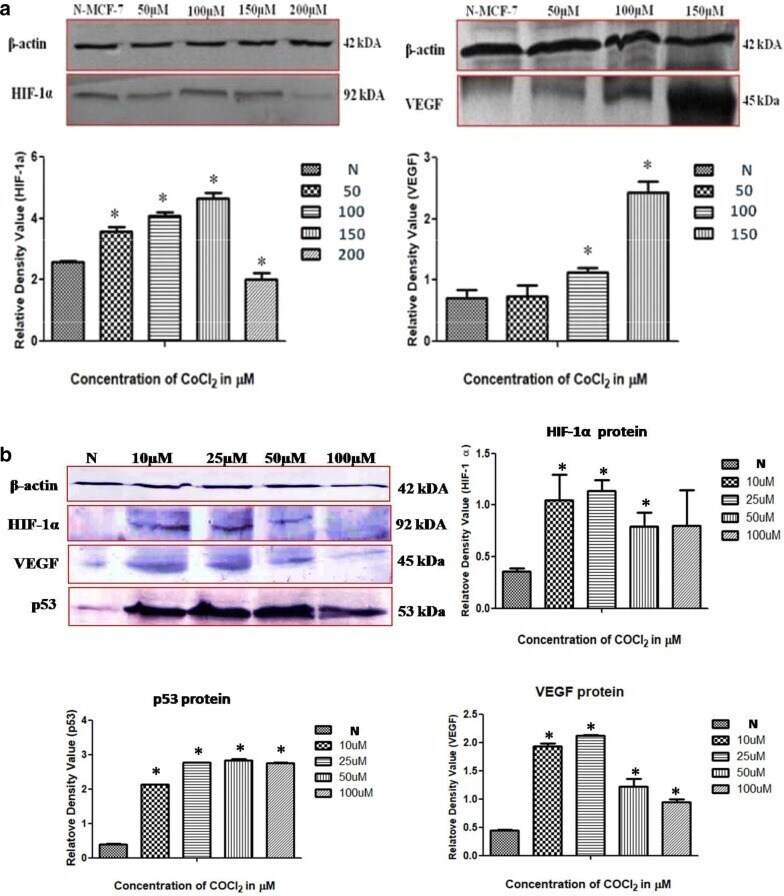
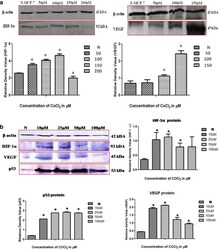
- Fig. 5 Western blot analysis of beta -actin, HIF-1alpha, VEGF, p53 and BAX protein in breast cancer cells grown under hypoxia (treated with CoCl 2 ) as well as in normoxia (without treatment). a Differential expression pattern of HIF-1alpha and VEGF protein isolated from MCF-7 cells. b Shows the dose dependent enhancement in expression of hypoxia associated proteins HIF-1alpha, VEGF, p53 and BAX in MDA-MB-231 cells grown under hypoxic condition, P < 0.05