Explore
 Validate
 Learn
Learn Western blot
 Immunocytochemistry
Antibody data
- Antibody Data
- Antigen structure
- References [6]
- Comments [0]
- Validations
- Immunocytochemistry [2]
- Immunohistochemistry [3]
- Flow cytometry [1]
- Chromatin Immunoprecipitation [2]
- Other assay [9]
Submit
Validation data
Reference
Comment
Report error
- Product number
- 44-1105G - Provider product page

- Provider
- Invitrogen Antibodies
- Product name
- Phospho-ETS2 (Thr72) Polyclonal Antibody
- Antibody type
- Polyclonal
- Antigen
- Synthetic peptide
- Reactivity
- Human, Mouse
- Host
- Rabbit
- Isotype
- IgG
- Vial size
- 100 μL
- Storage
- -20°C
Submitted references Cooperative Binding of ETS2 and NFAT Links Erk1/2 and Calcineurin Signaling in the Pathogenesis of Cardiac Hypertrophy.
EGF suppresses the expression of miR-124a in pancreatic β cell lines via ETS2 activation through the MEK and PI3K signaling pathways.
Stem Cell Lineage Infidelity Drives Wound Repair and Cancer.
ETS family transcriptional regulators drive chromatin dynamics and malignancy in squamous cell carcinomas.
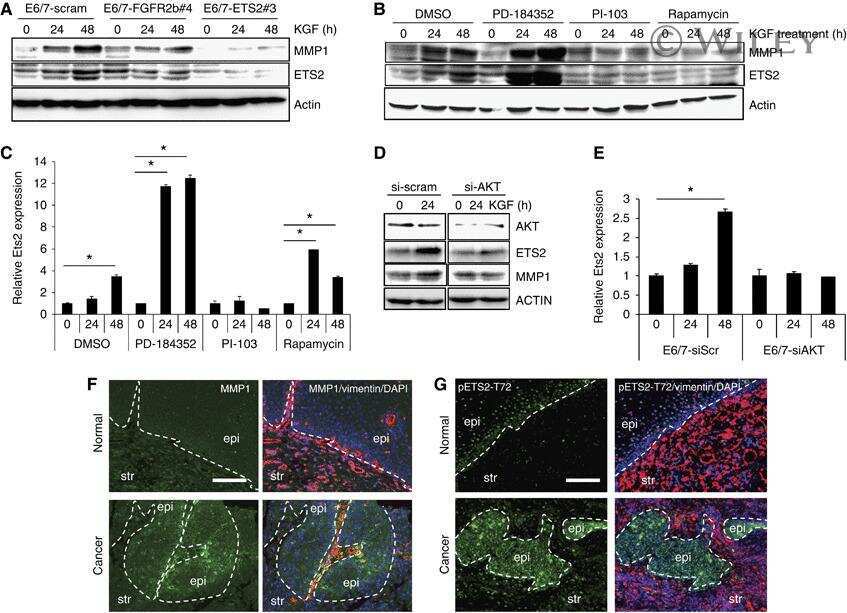
Inactivation of Rb in stromal fibroblasts promotes epithelial cell invasion.
RuvBl2 cooperates with Ets2 to transcriptionally regulate hTERT in colon cancer.
Luo Y, Jiang N, May HI, Luo X, Ferdous A, Schiattarella GG, Chen G, Li Q, Li C, Rothermel BA, Jiang D, Lavandero S, Gillette TG, Hill JA
Circulation 2021 Jul 6;144(1):34-51
Circulation 2021 Jul 6;144(1):34-51
EGF suppresses the expression of miR-124a in pancreatic β cell lines via ETS2 activation through the MEK and PI3K signaling pathways.
Yang L, Zhu Y, Kong D, Gong J, Yu W, Liang Y, Nie Y, Teng CB
International journal of biological sciences 2019;15(12):2561-2575
International journal of biological sciences 2019;15(12):2561-2575
Stem Cell Lineage Infidelity Drives Wound Repair and Cancer.
Ge Y, Gomez NC, Adam RC, Nikolova M, Yang H, Verma A, Lu CP, Polak L, Yuan S, Elemento O, Fuchs E
Cell 2017 May 4;169(4):636-650.e14
Cell 2017 May 4;169(4):636-650.e14
ETS family transcriptional regulators drive chromatin dynamics and malignancy in squamous cell carcinomas.
Yang H, Schramek D, Adam RC, Keyes BE, Wang P, Zheng D, Fuchs E
eLife 2015 Nov 21;4:e10870
eLife 2015 Nov 21;4:e10870
Inactivation of Rb in stromal fibroblasts promotes epithelial cell invasion.
Pickard A, Cichon AC, Barry A, Kieran D, Patel D, Hamilton P, Salto-Tellez M, James J, McCance DJ
The EMBO journal 2012 May 29;31(14):3092-103
The EMBO journal 2012 May 29;31(14):3092-103
RuvBl2 cooperates with Ets2 to transcriptionally regulate hTERT in colon cancer.
Flavin P, Redmond A, McBryan J, Cocchiglia S, Tibbitts P, Fahy-Browne P, Kay E, Treumann A, Perrem K, McIlroy M, Hill AD, Young LS
FEBS letters 2011 Aug 4;585(15):2537-44
FEBS letters 2011 Aug 4;585(15):2537-44
No comments: Submit comment
Supportive validation
- Submitted by
- Invitrogen Antibodies (provider)
- Main image
- Experimental details
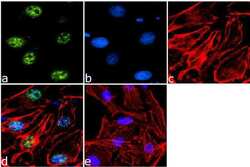
- Immunofluorescence analysis of Phospho-ETS2 pThr72 was done on 70% confluent log phase HeLa cells. The cells were fixed with 4% paraformaldehyde for 15 minutes, permeabilized with 0.25% Triton™ X-100 for 10 minutes, and blocked with 5% BSA for 1 hour at room temperature. The cells were labeled with Phospho-ETS2 pThr72 Rabbit Polyclonal Antibody (Product # 44-1105G)at 1:250 dilution in 1% BSA and incubated for 3 hours at room temperature and then labeled with Goat anti-Rabbit IgG (H+L) Superclonal™ Secondary Antibody, Alexa Fluor® 488 conjugate (Product # A27034) at a dilution of 1:2000 for 45 minutes at room temperature (Panel a: green). Nuclei (Panel b: blue) were stained with SlowFade® Gold Antifade Mountant with DAPI (Product # S36938). F-actin (Panel c: red) was stained with Rhodamine Phalloidin (Product # R415, 1:300). Panel d is a merged image showing Nuclear localization. Panel e is a no primary antibody control. The images were captured at 60X magnification.
- Submitted by
- Invitrogen Antibodies (provider)
- Main image

- Experimental details
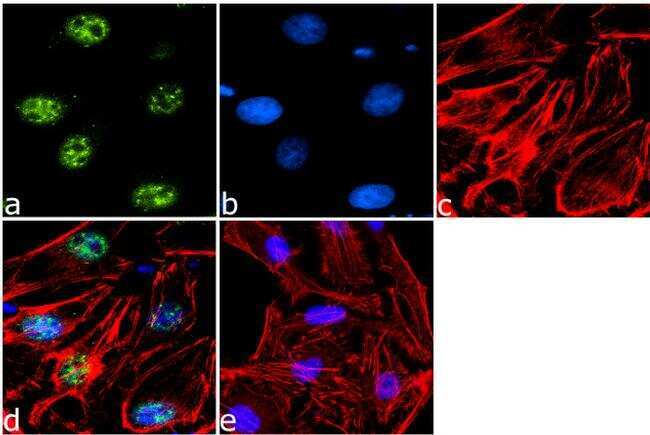
- Immunofluorescence analysis of Phospho-ETS2 pThr72 was done on 70% confluent log phase HeLa cells. The cells were fixed with 4% paraformaldehyde for 15 minutes, permeabilized with 0.25% Triton™ X-100 for 10 minutes, and blocked with 5% BSA for 1 hour at room temperature. The cells were labeled with Phospho-ETS2 pThr72 Rabbit Polyclonal Antibody (Product # 44-1105G)at 1:250 dilution in 1% BSA and incubated for 3 hours at room temperature and then labeled with Goat anti-Rabbit IgG (Heavy Chain) Superclonal™ Secondary Antibody, Alexa Fluor® 488 conjugate (Product # A27034) at a dilution of 1:2000 for 45 minutes at room temperature (Panel a: green). Nuclei (Panel b: blue) were stained with SlowFade® Gold Antifade Mountant with DAPI (Product # S36938). F-actin (Panel c: red) was stained with Rhodamine Phalloidin (Product # R415, 1:300). Panel d is a merged image showing Nuclear localization. Panel e is a no primary antibody control. The images were captured at 60X magnification.

Supportive validation
- Submitted by
- Invitrogen Antibodies (provider)
- Main image
- Experimental details
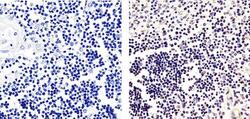
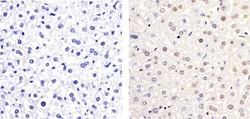
- Immunohistochemistry analysis of Phospho ETS (pT72) showing staining in the nucleus of paraffin-embedded human-thymus-tissue (right) compared to a negative control without primary antibody (left). To expose target proteins, antigen retrieval was performed using 10mM sodium citrate (pH 6.0), microwaved for 8-15 min. Following antigen retrieval, tissues were blocked in 3% H2O2-methanol for 15 min at room temperature, washed with ddH2O and PBS, and then probed with Phospho ETS (pT72) Rabbit Polyclonal Antibody (Product # 44-1105G) diluted in 3% BSA-PBS at a dilution of 1:20 overnight at 4ºC in a humidified chamber. Tissues were washed extensively in PBST and detection was performed using an HRP-conjugated secondary antibody followed by colorimetric detection using a DAB kit. Tissues were counterstained with hematoxylin and dehydrated with ethanol and xylene to prep for mounting.
- Submitted by
- Invitrogen Antibodies (provider)
- Main image
- Experimental details
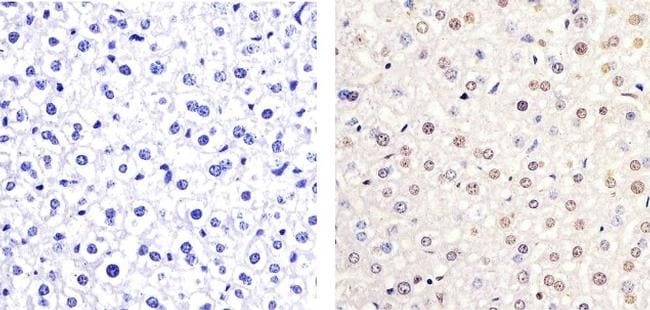
- Immunohistochemistry analysis of ETS (PT72) showing staining in the nucleus of paraffin-embedded mouse liver tissue (right) compared to a negative control without primary antibody (left). To expose target proteins, antigen retrieval was performed using 10mM sodium citrate (pH 6.0), microwaved for 8-15 min. Following antigen retrieval, tissues were blocked in 3% H2O2-methanol for 15 min at room temperature, washed with ddH2O and PBS, and then probed with a ETS (PT72) Rabbit Polyclonal Antibody (Product # 44-1105G) diluted in 3% BSA-PBS at a dilution of 1:20 overnight at 4°C in a humidified chamber. Tissues were washed extensively in PBST and detection was performed using an HRP-conjugated secondary antibody followed by colorimetric detection using a DAB kit. Tissues were counterstained with hematoxylin and dehydrated with ethanol and xylene to prep for mounting.
- Submitted by
- Invitrogen Antibodies (provider)
- Main image
- Experimental details
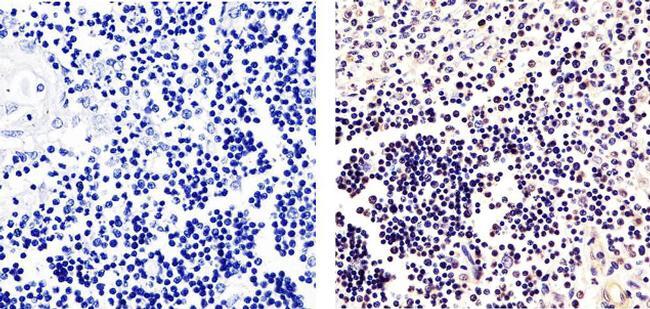
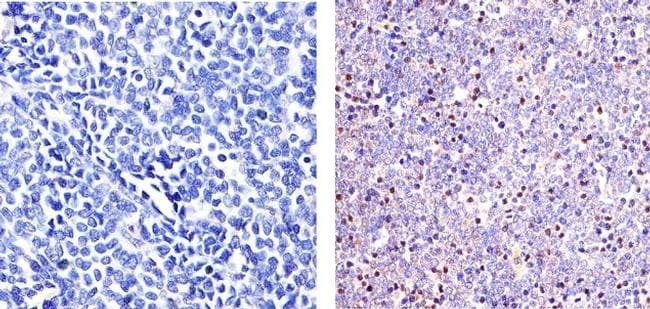
- Immunohistochemistry analysis of Phospho ETS (pT72) showing staining in the nucleus of paraffin-embedded human T-cell lymphoma tissue (right) compared to a negative control without primary antibody (left). To expose target proteins, antigen retrieval was performed using 10mM sodium citrate (pH 6.0), microwaved for 8-15 min. Following antigen retrieval, tissues were blocked in 3% H2O2-methanol for 15 min at room temperature, washed with ddH2O and PBS, and then probed with Phospho ETS (pT72) Rabbit Polyclonal Antibody (Product # 44-1105G) diluted in 3% BSA-PBS at a dilution of 1:20 overnight at 4ºC in a humidified chamber. Tissues were washed extensively in PBST and detection was performed using an HRP-conjugated secondary antibody followed by colorimetric detection using a DAB kit. Tissues were counterstained with hematoxylin and dehydrated with ethanol and xylene to prep for mounting.
Supportive validation
- Submitted by
- Invitrogen Antibodies (provider)
- Main image
- Experimental details
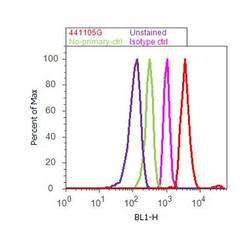
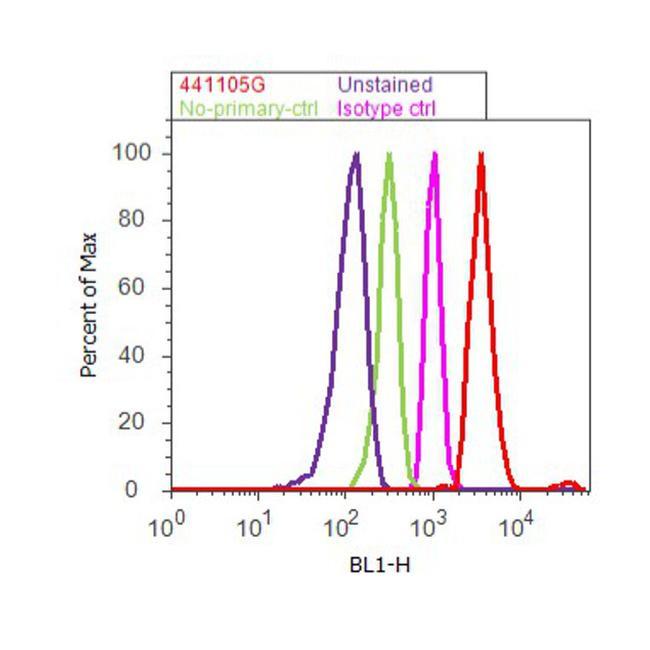
- Flow cytometry analysis of ETS2 [pT72] was done on A-431 cells. Cells were fixed with 70% ethanol for 10 minutes, permeabilized with 0.25% Triton™ X-100 for 20 minutes, and blocked with 5% BSA for 30 minutes at room temperature. Cells were labeled with ETS2 [pT72] Rabbit Polyclonal Antibody (441105G, red histogram) or with rabbit isotype control (pink histogram) at 3-5 ug/million cells in 2.5% BSA. After incubation at room temperature for 2 hours, the cells were labeled with Alexa Fluor® 488 Goat Anti-Rabbit Secondary Antibody (A11008) at a dilution of 1:400 for 30 minutes at room temperature. The representative 10,000 cells were acquired and analyzed for each sample using an Attune® Acoustic Focusing Cytometer. The purple histogram represents unstained control cells and the green histogram represents no-primary-antibody control.
Supportive validation
- Submitted by
- Invitrogen Antibodies (provider)
- Main image

- Experimental details
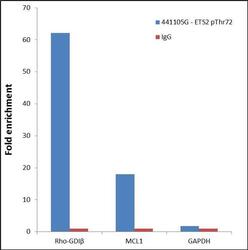
- Enrichment of endogenous ETS2 pThr72 protein at specific gene loci using Anti-Phospho-ETS2 pThr72 rabbit polyclonal antibody: Chromatin Immunoprecipitation (ChIP) was performed using Anti-Phospho-ETS2 pThr72 rabbit polyclonal antibody (Product # 44-1105G, 5 µg) on sheared chromatin from 2 million Jurkat cells using the "MAGnify ChIP system" kit (Product # 49-2024). Normal Rabbit IgG (1 µg) was used as a negative IP control. The purified DNA was analyzed by 7500 Fast qPCR system (Product # 4351106) with optimized PCR primer pairs for the promoters of the active Rho-GDI-beta, MCL1 region used as positive control target gene, and the promoter region of GAPDH region, used as negative control target gene. Data is presented as fold enrichment of the antibody signal versus the negative control IgG using the comparative CT method.

- Submitted by
- Invitrogen Antibodies (provider)
- Main image
- Experimental details
- Enrichment of endogenous ETS2 pThr72 protein at specific gene loci using Anti-Phospho-ETS2 pThr72 rabbit polyclonal antibody: Chromatin Immunoprecipitation (ChIP) was performed using Anti-Phospho-ETS2 pThr72 rabbit polyclonal antibody (Product # 44-1105G, 5 µg) on sheared chromatin from 2 million Jurkat cells using the "MAGnify ChIP system" kit (Product # 49-2024). Normal Rabbit IgG (1 µg) was used as a negative IP control. The purified DNA was analyzed by 7500 Fast qPCR system (Product # 4351106) with optimized PCR primer pairs for the promoters of the active Rho-GDI-beta, MCL1 region used as positive control target gene, and the promoter region of GAPDH region, used as negative control target gene. Data is presented as fold enrichment of the antibody signal versus the negative control IgG using the comparative CT method.

Supportive validation
- Submitted by
- Invitrogen Antibodies (provider)
- Main image

- Experimental details
- NULL

- Submitted by
- Invitrogen Antibodies (provider)
- Main image
- Experimental details
- NULL
- Submitted by
- Invitrogen Antibodies (provider)
- Main image
- Experimental details
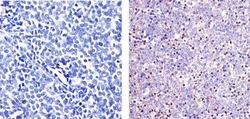
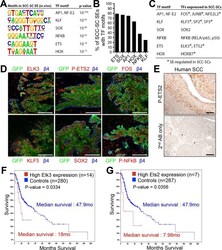
- Figure 2. Identification of a cohort of SCC-SC specific transcriptional regulators. ( A ) Motif analysis of SCC-SC super-enhancers for putative TF binding sites. ( B ) Frequency of putative TF binding sites in SCC-SC super-enhancers. ( C ) SCC-SC TFs with potential to bind to the TF-motifs within SCC-SC super-enhancers. Genes encoding the TFs that are marked with an asterisk are SE-associated. ( D ) Immunofluorescence images showing nuclear localization of SCC-SC TFs (red) in allograft SCC-SC-derived tumors (GFP). Scale bars, 100 mum. ( E ) Immunohistochemistry with P-ETS2 antibodies in human SCC samples. ( F and G ) High expression of mouse SCC-SC-expressed ETS family members correlate with poor survival in human SCCs. Kaplan-Meier analysis compares overall survival of TCGA head and neck SCC patients stratified according to high and low ELK3 and ETS2 expression. SC, stem cell; SCC, squamous cell carcinoma; TF, transcription factor; DOI: http://dx.doi.org/

- Submitted by
- Invitrogen Antibodies (provider)
- Main image
- Experimental details
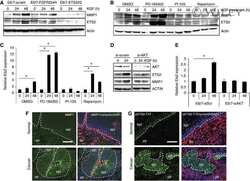
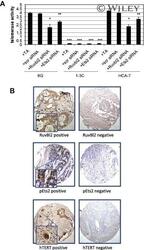
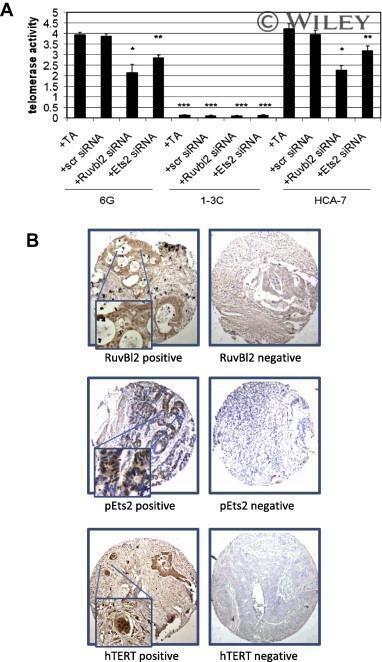
- RuvBl2 impacts hTERT activity and associates with pEts2 and hTERT expression in human colon cancer patients. (A) Knock down of RuvBl2 or Ets2 induces a reduction in telomerase activity in 6G and HCA-7 colon cancer cells. TRAP assay was used to assess telomerase activity. siRNA-mediated depletion of RuvBl2 or Ets2 significantly reduced telomerase activity in 6G and HCA-7 cell lines compared to respective controls ( F -statistic = 2,146, P < 0.001). 1-3 cells where used as hTERT negative control cells. Results are expressed as mean +- SD ( n = 3). (B) RuvBl2, pEts2 and hTERT (x200 inset x600) were localised in tumour tissue from colon cancer patients ( n = 170). Staining was scored using the Allred scoring system as previously described [37] . Significant associations were observed between nuclear expression of RuvBl2 and pEts2 ( P = 0.05, Fisher's exact test) and between nuclear expression of RuvBl2 and hTERT ( P = 0.004, Fisher's exact test).
- Submitted by
- Invitrogen Antibodies (provider)
- Main image

- Experimental details
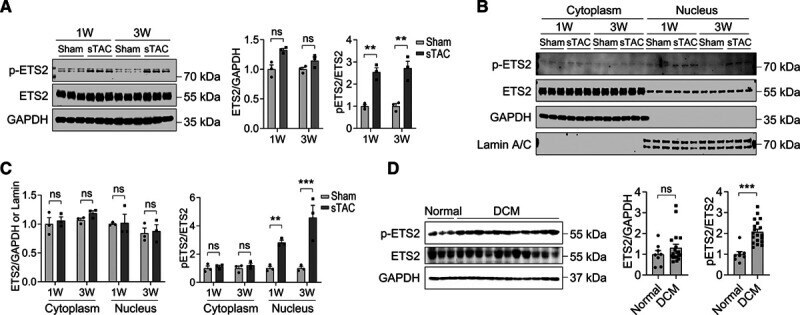
- Figure 1. ETS2 is activated in hypertrophic hearts. A , Western blot analyses and quantification showing ETS2 phosphorylation and protein levels in mouse hearts at 1 or 3 weeks after sham operation or severe thoracic aortic constriction (sTAC; n=3). B and C , Western blot analyses ( B ) and quantification ( C ) of ETS2 phosphorylation and protein levels in cytoplasmic and nuclear fractions extracted from sham-operated control hearts and sTAC-induced hypertrophied hearts (n=3). D , ETS2 phosphorylation is increased in hearts from patients with dilated cardiomyopathy (DCM; n=8 for normal controls, n=19 for DCM). ** P
- Submitted by
- Invitrogen Antibodies (provider)
- Main image
- Experimental details
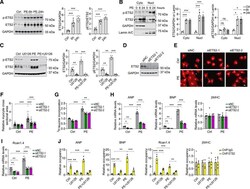
- Figure 4. ETS2 (a member of the E26 transformation-specific sequence [ETS] domain family) knockdown attenuates phenylephrine-induced hypertrophy in vitro. A , Representative Western blots and quantification showing ETS2 phosphorylation and protein levels in isolated neonatal rat ventricular myocytes (NRVMs) treated with 50 mumol/L phenylephrine (PE) for 6 or 24 hours (n=6). B , Western blot analyses and quantification of ETS2 phosphorylation and expression in cytoplasmic and nuclear fractions extracted from PE-treated NRVMs (n=4). C , ETS2 phosphorylation and protein levels in NRVMs treated with PE or MEK inhibitor U0126, or both, for 24 hours (n=6). D , ETS2 was silenced in NRVMs by small interfering RNA (siRNA) transfection. E , Representative immunofluorescence images of alpha-actinin staining in NRVMs transfected with siRNA control (siNC) or siRNA targeting ETS2 (siETS2) and then treated with PE for 48 hours. Scale bar, 20 mum. F , Quantification of relative cardiomyocyte surface area (n=50). G , ETS2 knockdown inhibits PE-induced protein synthesis in NRVMs (n=6). H , mRNA levels of ANP (atrial natriuretic peptide), BNP (brain natriuretic peptide), and betaMHC (beta-myosin heavy chain) in NRVMs transfected with siNC or siETS2 and then treated with PE for 24 hours (n=6). I , Rcan1.4 mRNA levels in NRVMs treated as in H (n=6). J , Chromatin immunoprecipitation (ChIP) analysis to detect ETS2 binding to the promoters of the indicated genes. ChIP was performed with an ETS2-spe

- Submitted by
- Invitrogen Antibodies (provider)
- Main image
- Experimental details
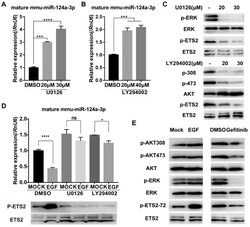
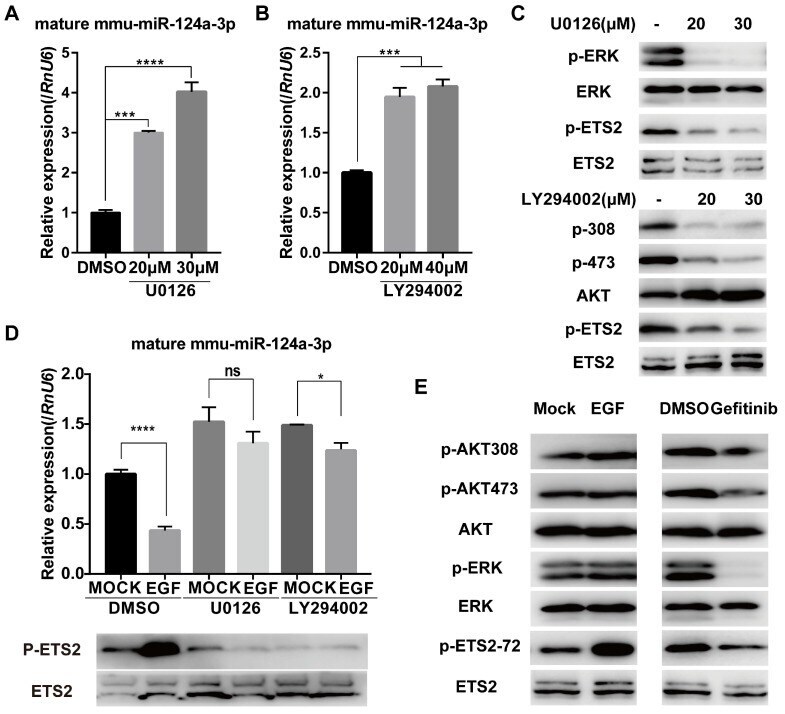
- Figure 2 Ras/ERK and PI3K/AKT signaling pathways control miR-124a expression. (A) Expression of miR-124a was determined by qRT-PCR in MIN6 cells treated with the inhibitor to MEK (U0126) at the indicated concentration or DMSO for 12 h. (B) The same as in (A), but in cells treated with the inhibitor to PI3K (LY294002) or DMSO. (C) Top: Western blotting was used to monitor the expression of phosphorylated ERK, total ERK, phosphorylated ETS2 (Thr72) and total ETS2 in the presence or absence of U0126; bottom: Western blotting for the levels of phosphorylated AKT (Ser308 and Thr473), total AKT, phosphorylated ETS2 (Thr72) and total ETS2 in the presence or absence of LY294002. (D) qRT-PCR (top) for the expression of miR-124a in MIN6 cells, which were serum-starved overnight and then treated with U0126, LY294002 or DMSO for 30 min prior to the addition of EGF; Western blot for protein levels of phosphorylated ETS2 (Thr72) and total ETS2 in cells under the same conditions as above. (E) Western blotting was used to monitor the expression of phosphorylated AKT, total AKT, phosphorylated ERK, total ERK, phosphorylated ETS2 (Thr72) and total ETS2 in MIN6 cells treated with EGF (left), gefitinib (right) or control medium. RnU6 , U6 small nuclear RNA, internal control for microRNA detection. ACTB , actin gene, internal control for cDNA detection. ACTB, actin, internal control for protein detection. Data represent the mean +- SE of three independent experiments (each n = 3). * P < 0.05, **
- Submitted by
- Invitrogen Antibodies (provider)
- Main image
- Experimental details
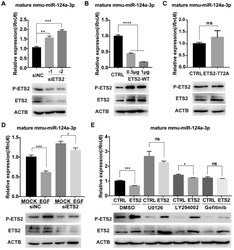
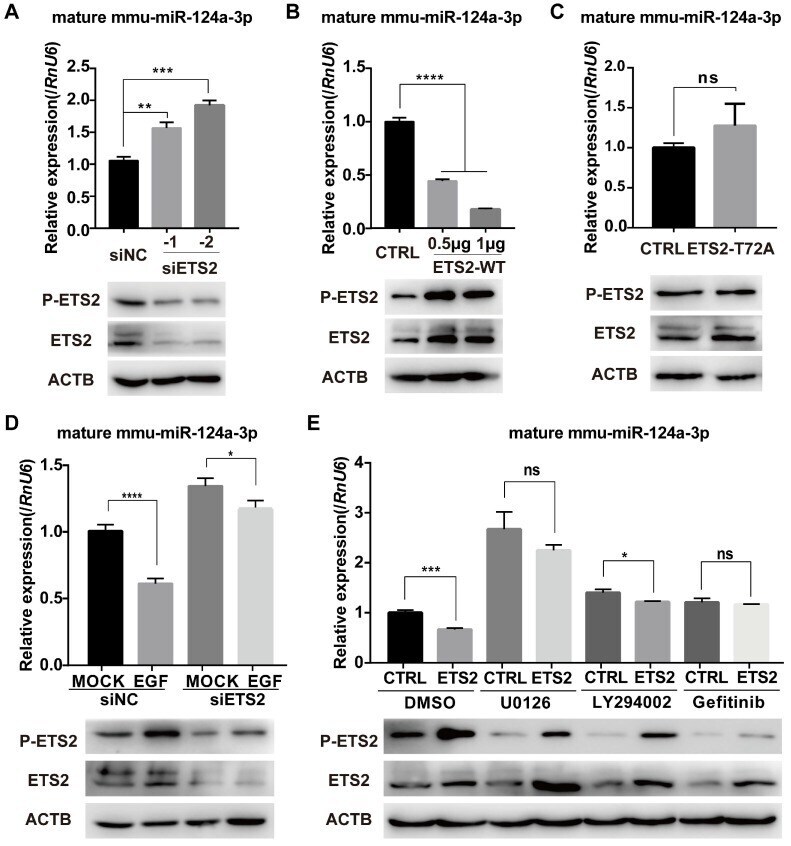
- Figure 3 Phosphorylated ETS2 affects miR-124a expression. (A) Expression of ETS2 (phosphorylated and total) and mature miR-124a was determined in MIN6 cells by Western blotting and qRT-PCR, respectively, after transfection with siRNAs targeting ETS2 (siETS2, 50nM) or negative control (siNC) for 48 h. (B) The same as in (A), but in cells transfected with the indicated amount of wild-type ETS2 overexpression vector (ETS2-WT) or empty vector for 48 h. (C) The same as in (B), but in cells transfected with the overexpression vector of mutant ETS2, whose phosphorylation site at threonine 72 was replaced to alanine (ETS2-T72A), or empty vector. (D) Expression of mature miR-124a was determined by qRT-PCR (top) in MIN6 cells transfected first with siETS2 or siNC for 36 h and subsequently serum-starved for 12 h before EGF treatment. Expression of phosphorylated and total ETS2 was monitored by Western blotting (bottom) under the same conditions. (E) Expression of mature miR-124a and ETS2 (phosphorylated and total) was determined by qRT-PCR (top) and immunoblotting (bottom), respectively, in MIN6 cells transfected first with vector containing the wide-type ETS2 coding sequence or control vector for 48 h and subsequently treated with DMSO, U0126, LY294002, or gefitinib. Data represent the mean +- SE of three independent experiments (each n = 3). * P < 0.05, ** P < 0.01, *** P < 0.001, **** P < 0.0001. ns, not significant.
- Submitted by
- Invitrogen Antibodies (provider)
- Main image
- Experimental details
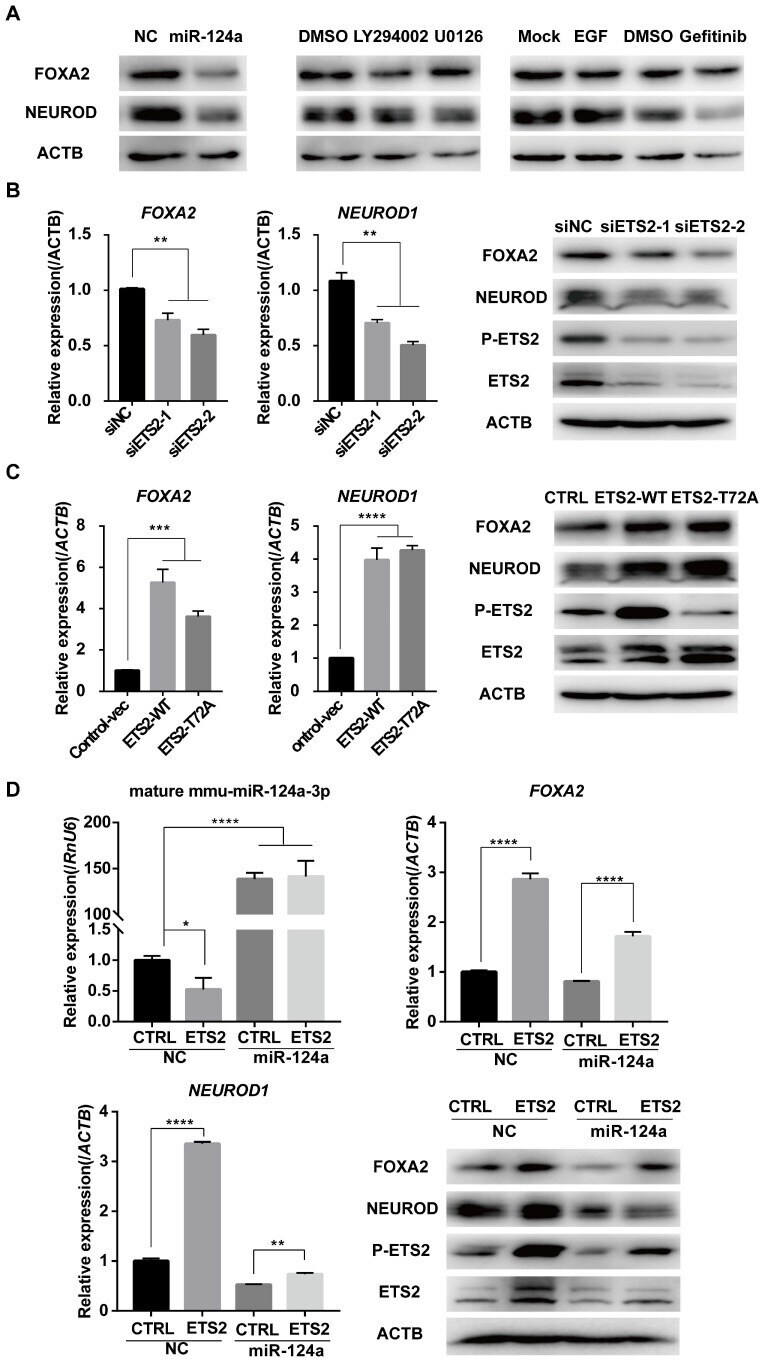
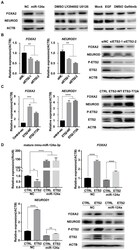
- Figure 5 ETS2 regulates Foxa2 and NeuroD1 expression partly by inhibiting miR-124a expression. (A) Expression of FOXA2 and NEUROD1 was determined by immunoblotting in MIN6 cells transfected with negative control (NC) or miR-124a mimics, or incubated with EGF or not, or incubated with DMSO, LY294002, U0126 or gefitinib. (B) Expression of FOXA2 and NEUROD1 were determined by qRT-PCR in MIN6 cells following siETS2 or siNC transfection for 72 h. Subsequently, Western blotting was used to monitor the protein expression of FOXA2, NEUROD, phosphorylated ETS2 (Thr72) and total ETS2. ACTB (beta-actin) was used as a loading control. (C) The same as in (B), but in MIN6 cells transfected with plasmids overexpressing wide-type (ETS2-WT) or mutant ETS2 (ETS2-T72A) or empty vector for control. (D) Expression of miR-124a, FOXA2 and NEUROD1 were determined by qRT-PCR and western blot in ETS2-overexpression or control MIN6 cells following miR-124a mimics or NC transfection. To restore miR-124a expression, MIN6 cells were co-transfected with the indicated combinations of mimics and vectors for 72 h. ACTB , the actin gene, internal control for cDNA detection. ACTB, actin, internal control for protein detection. Data represent the mean +- SE of three independent experiments (each n = 3). * P < 0.05, ** P < 0.01, *** P < 0.001, **** P < 0.0001.