Explore
 Validate
 Learn
Learn Western blot
 Immunocytochemistry
Antibody data
- Antibody Data
- Antigen structure
- References [83]
- Comments [0]
- Validations
- Immunocytochemistry [2]
- Flow cytometry [1]
- Other assay [48]
Submit
Validation data
Reference
Comment
Report error
- Product number
- A-21351 - Provider product page

- Provider
- Invitrogen Antibodies
- Product name
- ATP Synthase beta Monoclonal Antibody (3D5AB1)
- Antibody type
- Monoclonal
- Antigen
- Other
- Description
- The antibody was produced in vitro using hybridomas grown in serum-free medium, and then purified by biochemical fractionation. Near homogeneity was judged by SDS-PAGE. The epitope recognized by the anti-ATP synthase beta 3D5AB1 is in the region containing the active site of the beta-subunit and is centered approximately at amino acid residue 83. The complete amino acid sequence of the epitope is not known. See Chi SL, Wahl ML, Kenan DJ et al. (2007) Angiostatin-like activity of a monoclonal antibody to the catalytic subunit of F1F0 ATP synthase. Cancer Res 67:4716-4724.
- Reactivity
- Human, Mouse, Rat, Bovine
- Host
- Mouse
- Isotype
- IgG
- Antibody clone number
- 3D5AB1
- Vial size
- 100 μg
- Concentration
- 1 mg/mL
- Storage
- 4°C
Submitted references The Combination of Δ(9)-Tetrahydrocannabinol and Cannabidiol Suppresses Mitochondrial Respiration of Human Glioblastoma Cells via Downregulation of Specific Respiratory Chain Proteins.
Dynamic full-field optical coherence tomography allows live imaging of retinal pigment epithelium stress model.
Characterization of mitochondrial health from human peripheral blood mononuclear cells to cerebral organoids derived from induced pluripotent stem cells.
Chalcone suppresses tumor growth through NOX4-IRE1α sulfonation-RIDD-miR-23b axis.
Inner mitochondrial membrane protein MPV17 mutant mice display increased myocardial injury after ischemia/reperfusion.
Inactivation of the mitochondrial protease Afg3l2 results in severely diminished respiratory chain activity and widespread defects in mitochondrial gene expression.
An antibody toolbox to track complex I assembly defines AIF's mitochondrial function.
The short variant of optic atrophy 1 (OPA1) improves cell survival under oxidative stress.
Mitophagy in the Retinal Pigment Epithelium of Dry Age-Related Macular Degeneration Investigated in the NFE2L2/PGC-1α(-/-) Mouse Model.
Argonaute binding within 3'-untranslated regions poorly predicts gene repression.
Phototoxic damage to cone photoreceptors can be independent of the visual pigment: the porphyrin hypothesis.
PINK1 phosphorylates ubiquitin predominantly in astrocytes.
Inhibition of the ubiquitous calpains protects complex I activity and enables improved mitophagy in the heart following ischemia-reperfusion.
Peroxisomes control mitochondrial dynamics and the mitochondrion-dependent apoptosis pathway.
Formation of mammalian preribosomes proceeds from intermediate to composed state during ribosome maturation.
Mitochondrial ATP synthase β-subunit production rate and ATP synthase specific activity are reduced in skeletal muscle of humans with obesity.
A Mammalian Mitophagy Receptor, Bcl2-L-13, Recruits the ULK1 Complex to Induce Mitophagy.
Renal cold storage followed by transplantation impairs proteasome function and mitochondrial protein homeostasis.
CSB promoter downregulation via histone H3 hypoacetylation is an early determinant of replicative senescence.
Age-related sex differences in the expression of important disease-linked mitochondrial proteins in mice.
Human bone marrow adipocytes display distinct immune regulatory properties.
Lon protease inactivation in Drosophila causes unfolded protein stress and inhibition of mitochondrial translation.
Parkin is a disease modifier in the mutant SOD1 mouse model of ALS.
APP promotes osteoblast survival and bone formation by regulating mitochondrial function and preventing oxidative stress.
GLUT10 maintains the integrity of major arteries through regulation of redox homeostasis and mitochondrial function.
Loss of the Drosophila m-AAA mitochondrial protease paraplegin results in mitochondrial dysfunction, shortened lifespan, and neuronal and muscular degeneration.
Light action spectrum on oxidative stress and mitochondrial damage in A2E-loaded retinal pigment epithelium cells.
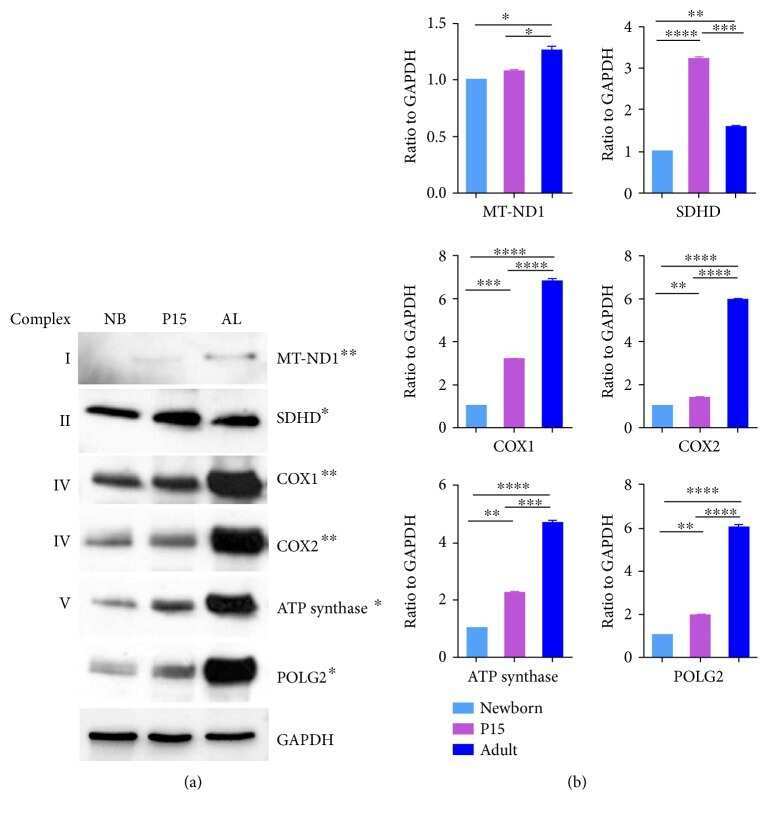
Differential Alterations of the Mitochondrial Morphology and Respiratory Chain Complexes during Postnatal Development of the Mouse Lung.
Impaired Mitophagy Plays a Role in Denervation of Neuromuscular Junctions in ALS Mice.
The Transcription Factor 7-Like 2-Peroxisome Proliferator-Activated Receptor Gamma Coactivator-1 Alpha Axis Connects Mitochondrial Biogenesis and Metabolic Shift with Stem Cell Commitment to Hepatic Differentiation.
Role for the ATPase inhibitory factor 1 in the environmental carcinogen-induced Warburg phenotype.
OPA1 haploinsufficiency induces a BNIP3-dependent decrease in mitophagy in neurons: relevance to Dominant Optic Atrophy.
Receptor-mediated Drp1 oligomerization on endoplasmic reticulum.
The short variant of the mitochondrial dynamin OPA1 maintains mitochondrial energetics and cristae structure.
Amyloid β-peptides interfere with mitochondrial preprotein import competence by a coaggregation process.
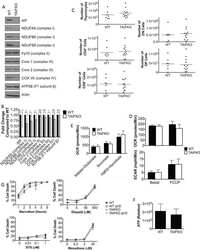
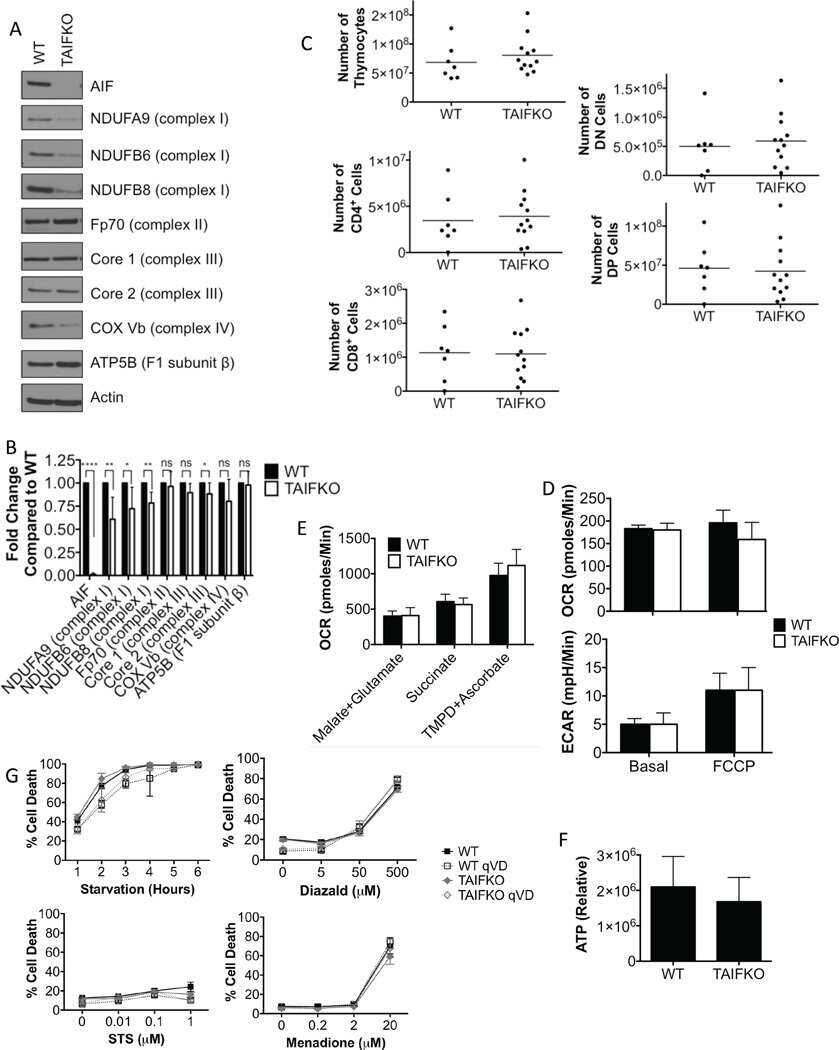
Apoptosis-Inducing-Factor-Dependent Mitochondrial Function Is Required for T Cell but Not B Cell Function.
Quantitative analysis of PPT1 interactome in human neuroblastoma cells.
Assembly of human mitochondrial ATP synthase through two separate intermediates, F1-c-ring and b-e-g complex.
Apolipoprotein A-I enhances proliferation of human endothelial progenitor cells and promotes angiogenesis through the cell surface ATP synthase.
Proteomic analysis of the palmitoyl protein thioesterase 1 interactome in SH-SY5Y human neuroblastoma cells.
In vivo time-lapse imaging of mitochondria in healthy and diseased peripheral myelin sheath.
Estrogen-related receptor α (ERRα) and ERRγ are essential coordinators of cardiac metabolism and function.
PINK1-Parkin pathway activity is regulated by degradation of PINK1 in the mitochondrial matrix.
Analysis of nuclear RNA interference in human cells by subcellular fractionation and Argonaute loading.
A Drosophila model of mitochondrial disease caused by a complex I mutation that uncouples proton pumping from electron transfer.
High-fat diet-induced impairment of skeletal muscle insulin sensitivity is not prevented by SIRT1 overexpression.
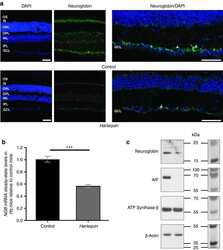
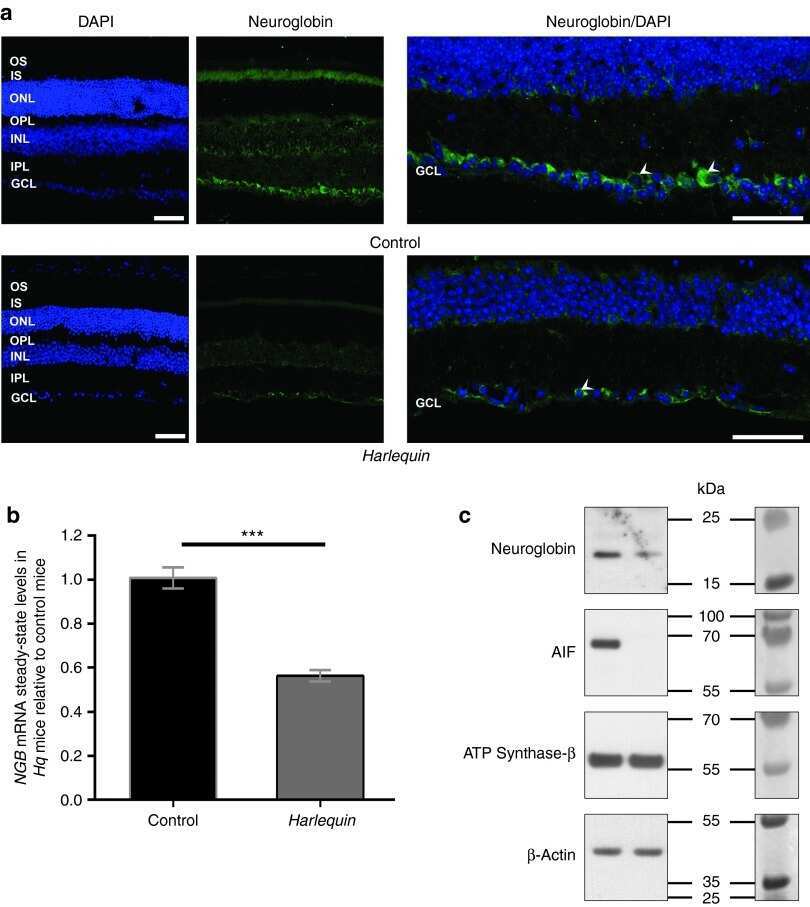
Neuroglobin gene therapy prevents optic atrophy and preserves durably visual function in Harlequin mice.
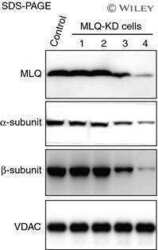
Population of ATP synthase molecules in mitochondria is limited by available 6.8-kDa proteolipid protein (MLQ).
Involvement of ATP synthase β subunit in chikungunya virus entry into insect cells.
IF1, a natural inhibitor of mitochondrial ATP synthase, is not essential for the normal growth and breeding of mice.
The N-terminal helix of Bcl-xL targets mitochondria.
Reduced mitochondrial ROS, enhanced antioxidant defense, and distinct age-related changes in oxidative damage in muscles of long-lived Peromyscus leucopus.
Advanced oxidation protein products induce cardiomyocyte death via Nox2/Rac1/superoxide-dependent TRAF3IP2/JNK signaling.
Examining the interactome of huperzine A by magnetic biopanning.
Assessing actual contribution of IF1, inhibitor of mitochondrial FoF1, to ATP homeostasis, cell growth, mitochondrial morphology, and cell viability.
Mild mitochondrial uncoupling does not affect mitochondrial biogenesis but downregulates pyruvate carboxylase in adipocytes: role for triglyceride content reduction.
Inhibition of tumor cell surface ATP synthesis by pigment epithelium-derived factor: implications for antitumor activity.
Modes of metabolic compensation during mitochondrial disease using the Drosophila model of ATP6 dysfunction.
The PGC-1α-related coactivator promotes mitochondrial and myogenic adaptations in C2C12 myotubes.
A mutation in a mitochondrial dehydrogenase/reductase gene causes an increased sensitivity to oxidative stress and mitochondrial defects in the nematode Caenorhabditis elegans.
Identification of human fumarylacetoacetate hydrolase domain-containing protein 1 (FAHD1) as a novel mitochondrial acylpyruvase.
Bcl-xL regulates mitochondrial energetics by stabilizing the inner membrane potential.
The microbiome and butyrate regulate energy metabolism and autophagy in the mammalian colon.
Knockdown of DAPIT (diabetes-associated protein in insulin-sensitive tissue) results in loss of ATP synthase in mitochondria.
The GTPase RAB20 is a HIF target with mitochondrial localization mediating apoptosis in hypoxia.
Heterogeneous levels of oxidative phosphorylation enzymes in rat adrenal glands.
Theiler's virus L* protein is targeted to the mitochondrial outer membrane.
A sensitive, simple assay of mitochondrial ATP synthesis of cultured mammalian cells suitable for high-throughput analysis.
The proteome of human brain after ischemic stroke.
WNT1-inducible signaling pathway protein-1 activates diverse cell survival pathways and blocks doxorubicin-induced cardiomyocyte death.
Pyruvate suppresses PGC1alpha expression and substrate utilization despite increased respiratory chain content in C2C12 myotubes.
The mitochondrial fusion-promoting factor mitofusin is a substrate of the PINK1/parkin pathway.
Histochemical methods for the diagnosis of mitochondrial diseases.
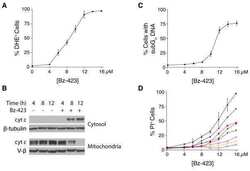
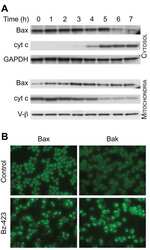
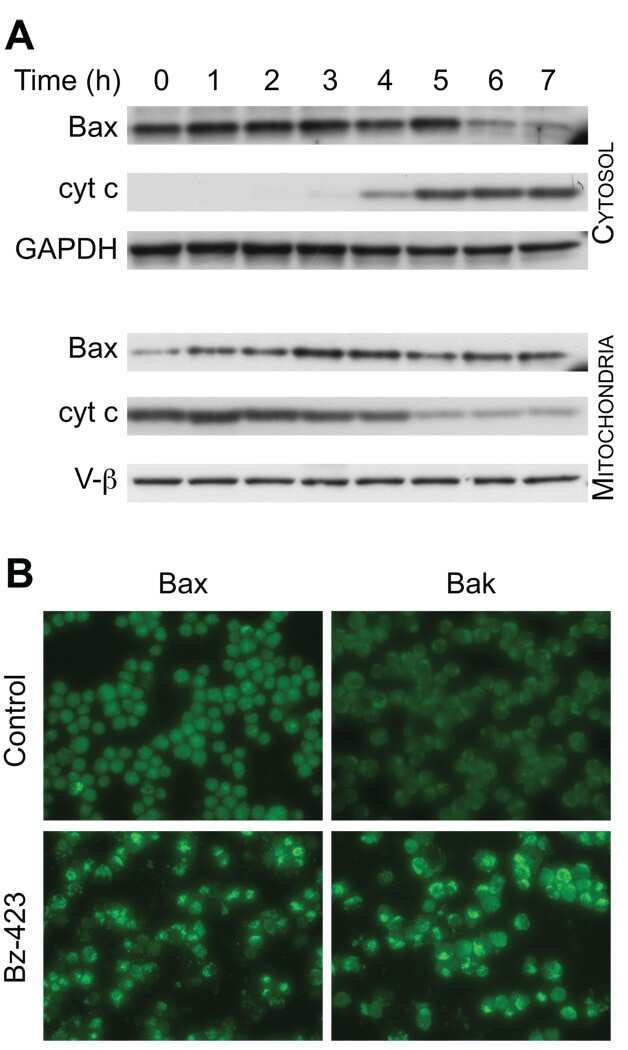
Bz-423 superoxide signals B cell apoptosis via Mcl-1, Bak, and Bax.
Cisd2 deficiency drives premature aging and causes mitochondria-mediated defects in mice.
Bz-423 superoxide signals apoptosis via selective activation of JNK, Bak, and Bax.
Mitochondrial proteomics of the retinal pigment epithelium at progressive stages of age-related macular degeneration.
Subdiffraction-resolution fluorescence imaging of proteins in the mitochondrial inner membrane with photoswitchable fluorophores.
Dual functions of a monoclonal antibody against cell surface F1F0 ATP synthase on both HUVEC and tumor cells.
2,2'-thiodiethanol: a new water soluble mounting medium for high resolution optical microscopy.
Motor neuron degeneration in amyotrophic lateral sclerosis mutant superoxide dismutase-1 transgenic mice: mechanisms of mitochondriopathy and cell death.
Coordination of nuclear- and mitochondrial-DNA encoded proteins in cancer and normal colon tissues.
Differential expression proteomics of human colon cancer.
Rupprecht A, Theisen U, Wendt F, Frank M, Hinz B
Cancers 2022 Jun 27;14(13)
Cancers 2022 Jun 27;14(13)
Dynamic full-field optical coherence tomography allows live imaging of retinal pigment epithelium stress model.
Groux K, Verschueren A, Nanteau C, Clémençon M, Fink M, Sahel JA, Boccara C, Paques M, Reichman S, Grieve K
Communications biology 2022 Jun 10;5(1):575
Communications biology 2022 Jun 10;5(1):575
Characterization of mitochondrial health from human peripheral blood mononuclear cells to cerebral organoids derived from induced pluripotent stem cells.
Duong A, Evstratova A, Sivitilli A, Hernandez JJ, Gosio J, Wahedi A, Sondheimer N, Wrana JL, Beaulieu JM, Attisano L, Andreazza AC
Scientific reports 2021 Feb 25;11(1):4523
Scientific reports 2021 Feb 25;11(1):4523
Chalcone suppresses tumor growth through NOX4-IRE1α sulfonation-RIDD-miR-23b axis.
Kim HK, Lee HY, Riaz TA, Bhattarai KR, Chaudhary M, Ahn JH, Jeong J, Kim HR, Chae HJ
Redox biology 2021 Apr;40:101853
Redox biology 2021 Apr;40:101853
Inner mitochondrial membrane protein MPV17 mutant mice display increased myocardial injury after ischemia/reperfusion.
Madungwe NB, Feng Y, Imam Aliagan A, Tombo N, Kaya F, Bopassa JC
American journal of translational research 2020;12(7):3412-3428
American journal of translational research 2020;12(7):3412-3428
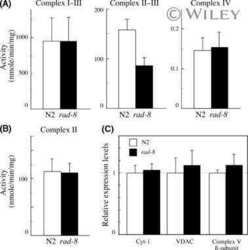
Inactivation of the mitochondrial protease Afg3l2 results in severely diminished respiratory chain activity and widespread defects in mitochondrial gene expression.
Pareek G, Pallanck LJ
PLoS genetics 2020 Oct;16(10):e1009118
PLoS genetics 2020 Oct;16(10):e1009118
An antibody toolbox to track complex I assembly defines AIF's mitochondrial function.
Murari A, Rhooms SK, Goparaju NS, Villanueva M, Owusu-Ansah E
The Journal of cell biology 2020 Oct 5;219(10)
The Journal of cell biology 2020 Oct 5;219(10)
The short variant of optic atrophy 1 (OPA1) improves cell survival under oxidative stress.
Lee H, Smith SB, Sheu SS, Yoon Y
The Journal of biological chemistry 2020 May 8;295(19):6543-6560
The Journal of biological chemistry 2020 May 8;295(19):6543-6560
Mitophagy in the Retinal Pigment Epithelium of Dry Age-Related Macular Degeneration Investigated in the NFE2L2/PGC-1α(-/-) Mouse Model.
Sridevi Gurubaran I, Viiri J, Koskela A, Hyttinen JMT, Paterno JJ, Kis G, Antal M, Urtti A, Kauppinen A, Felszeghy S, Kaarniranta K
International journal of molecular sciences 2020 Mar 13;21(6)
International journal of molecular sciences 2020 Mar 13;21(6)
Argonaute binding within 3'-untranslated regions poorly predicts gene repression.
Chu Y, Kilikevicius A, Liu J, Johnson KC, Yokota S, Corey DR
Nucleic acids research 2020 Jul 27;48(13):7439-7453
Nucleic acids research 2020 Jul 27;48(13):7439-7453
Phototoxic damage to cone photoreceptors can be independent of the visual pigment: the porphyrin hypothesis.
Marie M, Forster V, Fouquet S, Berto P, Barrau C, Ehrismann C, Sahel JA, Tessier G, Picaud S
Cell death & disease 2020 Aug 29;11(8):711
Cell death & disease 2020 Aug 29;11(8):711
PINK1 phosphorylates ubiquitin predominantly in astrocytes.
Barodia SK, McMeekin LJ, Creed RB, Quinones EK, Cowell RM, Goldberg MS
NPJ Parkinson's disease 2019;5:29
NPJ Parkinson's disease 2019;5:29
Inhibition of the ubiquitous calpains protects complex I activity and enables improved mitophagy in the heart following ischemia-reperfusion.
Chen Q, Thompson J, Hu Y, Dean J, Lesnefsky EJ
American journal of physiology. Cell physiology 2019 Nov 1;317(5):C910-C921
American journal of physiology. Cell physiology 2019 Nov 1;317(5):C910-C921
Peroxisomes control mitochondrial dynamics and the mitochondrion-dependent apoptosis pathway.
Tanaka H, Okazaki T, Aoyama S, Yokota M, Koike M, Okada Y, Fujiki Y, Gotoh Y
Journal of cell science 2019 May 31;132(11)
Journal of cell science 2019 May 31;132(11)
Formation of mammalian preribosomes proceeds from intermediate to composed state during ribosome maturation.
Abetov DA, Kiyan VS, Zhylkibayev AA, Sarbassova DA, Alybayev SD, Spooner E, Song MS, Bersimbaev RI, Sarbassov DD
The Journal of biological chemistry 2019 Jul 12;294(28):10746-10757
The Journal of biological chemistry 2019 Jul 12;294(28):10746-10757
Mitochondrial ATP synthase β-subunit production rate and ATP synthase specific activity are reduced in skeletal muscle of humans with obesity.
Tran L, Langlais PR, Hoffman N, Roust L, Katsanos CS
Experimental physiology 2019 Jan;104(1):126-135
Experimental physiology 2019 Jan;104(1):126-135
A Mammalian Mitophagy Receptor, Bcl2-L-13, Recruits the ULK1 Complex to Induce Mitophagy.
Murakawa T, Okamoto K, Omiya S, Taneike M, Yamaguchi O, Otsu K
Cell reports 2019 Jan 8;26(2):338-345.e6
Cell reports 2019 Jan 8;26(2):338-345.e6
Renal cold storage followed by transplantation impairs proteasome function and mitochondrial protein homeostasis.
Lo S, MacMillan-Crow LA, Parajuli N
American journal of physiology. Renal physiology 2019 Jan 1;316(1):F42-F53
American journal of physiology. Renal physiology 2019 Jan 1;316(1):F42-F53
CSB promoter downregulation via histone H3 hypoacetylation is an early determinant of replicative senescence.
Crochemore C, Fernández-Molina C, Montagne B, Salles A, Ricchetti M
Nature communications 2019 Dec 6;10(1):5576
Nature communications 2019 Dec 6;10(1):5576
Age-related sex differences in the expression of important disease-linked mitochondrial proteins in mice.
Moschinger M, Hilse KE, Rupprecht A, Zeitz U, Erben RG, Rülicke T, Pohl EE
Biology of sex differences 2019 Dec 5;10(1):56
Biology of sex differences 2019 Dec 5;10(1):56
Human bone marrow adipocytes display distinct immune regulatory properties.
Miggitsch C, Meryk A, Naismith E, Pangrazzi L, Ejaz A, Jenewein B, Wagner S, Nägele F, Fenkart G, Trieb K, Zwerschke W, Grubeck-Loebenstein B
EBioMedicine 2019 Aug;46:387-398
EBioMedicine 2019 Aug;46:387-398
Lon protease inactivation in Drosophila causes unfolded protein stress and inhibition of mitochondrial translation.
Pareek G, Thomas RE, Vincow ES, Morris DR, Pallanck LJ
Cell death discovery 2018;4:51
Cell death discovery 2018;4:51
Parkin is a disease modifier in the mutant SOD1 mouse model of ALS.
Palomo GM, Granatiero V, Kawamata H, Konrad C, Kim M, Arreguin AJ, Zhao D, Milner TA, Manfredi G
EMBO molecular medicine 2018 Oct;10(10)
EMBO molecular medicine 2018 Oct;10(10)
APP promotes osteoblast survival and bone formation by regulating mitochondrial function and preventing oxidative stress.
Pan JX, Tang F, Xiong F, Xiong L, Zeng P, Wang B, Zhao K, Guo H, Shun C, Xia WF, Mei L, Xiong WC
Cell death & disease 2018 Oct 22;9(11):1077
Cell death & disease 2018 Oct 22;9(11):1077
GLUT10 maintains the integrity of major arteries through regulation of redox homeostasis and mitochondrial function.
Syu YW, Lai HW, Jiang CL, Tsai HY, Lin CC, Lee YC
Human molecular genetics 2018 Jan 15;27(2):307-321
Human molecular genetics 2018 Jan 15;27(2):307-321
Loss of the Drosophila m-AAA mitochondrial protease paraplegin results in mitochondrial dysfunction, shortened lifespan, and neuronal and muscular degeneration.
Pareek G, Thomas RE, Pallanck LJ
Cell death & disease 2018 Feb 21;9(3):304
Cell death & disease 2018 Feb 21;9(3):304
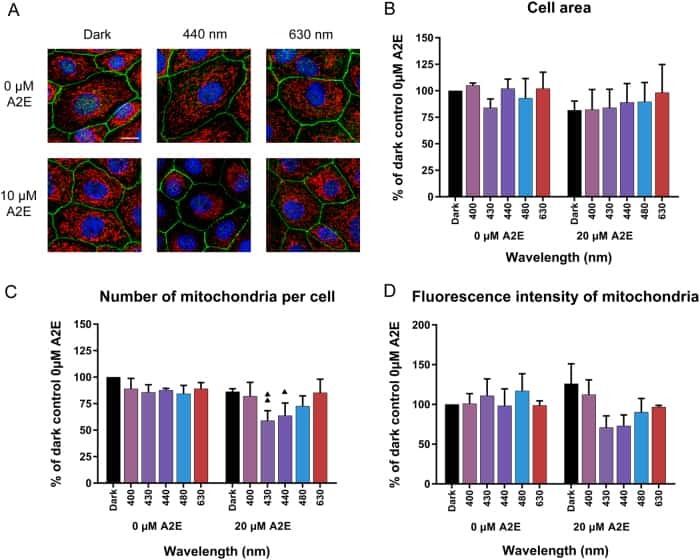
Light action spectrum on oxidative stress and mitochondrial damage in A2E-loaded retinal pigment epithelium cells.
Marie M, Bigot K, Angebault C, Barrau C, Gondouin P, Pagan D, Fouquet S, Villette T, Sahel JA, Lenaers G, Picaud S
Cell death & disease 2018 Feb 19;9(3):287
Cell death & disease 2018 Feb 19;9(3):287
Differential Alterations of the Mitochondrial Morphology and Respiratory Chain Complexes during Postnatal Development of the Mouse Lung.
El-Merhie N, Baumgart-Vogt E, Pilatz A, Pfreimer S, Pfeiffer B, Pak O, Kosanovic D, Seimetz M, Schermuly RT, Weissmann N, Karnati S
Oxidative medicine and cellular longevity 2017;2017:9169146
Oxidative medicine and cellular longevity 2017;2017:9169146
Impaired Mitophagy Plays a Role in Denervation of Neuromuscular Junctions in ALS Mice.
Rogers RS, Tungtur S, Tanaka T, Nadeau LL, Badawi Y, Wang H, Ni HM, Ding WX, Nishimune H
Frontiers in neuroscience 2017;11:473
Frontiers in neuroscience 2017;11:473
The Transcription Factor 7-Like 2-Peroxisome Proliferator-Activated Receptor Gamma Coactivator-1 Alpha Axis Connects Mitochondrial Biogenesis and Metabolic Shift with Stem Cell Commitment to Hepatic Differentiation.
Wanet A, Caruso M, Domelevo Entfellner JB, Najar M, Fattaccioli A, Demazy C, Evraerts J, El-Kehdy H, Pourcher G, Sokal E, Arnould T, Tiffin N, Najimi M, Renard P
Stem cells (Dayton, Ohio) 2017 Oct;35(10):2184-2197
Stem cells (Dayton, Ohio) 2017 Oct;35(10):2184-2197
Role for the ATPase inhibitory factor 1 in the environmental carcinogen-induced Warburg phenotype.
Hardonnière K, Fernier M, Gallais I, Mograbi B, Podechard N, Le Ferrec E, Grova N, Appenzeller B, Burel A, Chevanne M, Sergent O, Huc L, Bortoli S, Lagadic-Gossmann D
Scientific reports 2017 Mar 15;7(1):195
Scientific reports 2017 Mar 15;7(1):195
OPA1 haploinsufficiency induces a BNIP3-dependent decrease in mitophagy in neurons: relevance to Dominant Optic Atrophy.
Moulis MF, Millet AM, Daloyau M, Miquel MC, Ronsin B, Wissinger B, Arnauné-Pelloquin L, Belenguer P
Journal of neurochemistry 2017 Feb;140(3):485-494
Journal of neurochemistry 2017 Feb;140(3):485-494
Receptor-mediated Drp1 oligomerization on endoplasmic reticulum.
Ji WK, Chakrabarti R, Fan X, Schoenfeld L, Strack S, Higgs HN
The Journal of cell biology 2017 Dec 4;216(12):4123-4139
The Journal of cell biology 2017 Dec 4;216(12):4123-4139
The short variant of the mitochondrial dynamin OPA1 maintains mitochondrial energetics and cristae structure.
Lee H, Smith SB, Yoon Y
The Journal of biological chemistry 2017 Apr 28;292(17):7115-7130
The Journal of biological chemistry 2017 Apr 28;292(17):7115-7130
Amyloid β-peptides interfere with mitochondrial preprotein import competence by a coaggregation process.
Cenini G, Rüb C, Bruderek M, Voos W
Molecular biology of the cell 2016 Nov 1;27(21):3257-3272
Molecular biology of the cell 2016 Nov 1;27(21):3257-3272
Apoptosis-Inducing-Factor-Dependent Mitochondrial Function Is Required for T Cell but Not B Cell Function.
Milasta S, Dillon CP, Sturm OE, Verbist KC, Brewer TL, Quarato G, Brown SA, Frase S, Janke LJ, Perry SS, Thomas PG, Green DR
Immunity 2016 Jan 19;44(1):88-102
Immunity 2016 Jan 19;44(1):88-102
Quantitative analysis of PPT1 interactome in human neuroblastoma cells.
Scifo E, Szwajda A, Soliymani R, Pezzini F, Bianchi M, Dapkunas A, Dębski J, Uusi-Rauva K, Dadlez M, Gingras AC, Tyynelä J, Simonati A, Jalanko A, Baumann MH, Lalowski M
Data in brief 2015 Sep;4:207-16
Data in brief 2015 Sep;4:207-16
Assembly of human mitochondrial ATP synthase through two separate intermediates, F1-c-ring and b-e-g complex.
Fujikawa M, Sugawara K, Tanabe T, Yoshida M
FEBS letters 2015 Sep 14;589(19 Pt B):2707-12
FEBS letters 2015 Sep 14;589(19 Pt B):2707-12
Apolipoprotein A-I enhances proliferation of human endothelial progenitor cells and promotes angiogenesis through the cell surface ATP synthase.
González-Pecchi V, Valdés S, Pons V, Honorato P, Martinez LO, Lamperti L, Aguayo C, Radojkovic C
Microvascular research 2015 Mar;98:9-15
Microvascular research 2015 Mar;98:9-15
Proteomic analysis of the palmitoyl protein thioesterase 1 interactome in SH-SY5Y human neuroblastoma cells.
Scifo E, Szwajda A, Soliymani R, Pezzini F, Bianchi M, Dapkunas A, Dębski J, Uusi-Rauva K, Dadlez M, Gingras AC, Tyynelä J, Simonati A, Jalanko A, Baumann MH, Lalowski M
Journal of proteomics 2015 Jun 18;123:42-53
Journal of proteomics 2015 Jun 18;123:42-53
In vivo time-lapse imaging of mitochondria in healthy and diseased peripheral myelin sheath.
Gonzalez S, Fernando R, Berthelot J, Perrin-Tricaud C, Sarzi E, Chrast R, Lenaers G, Tricaud N
Mitochondrion 2015 Jul;23:32-41
Mitochondrion 2015 Jul;23:32-41
Estrogen-related receptor α (ERRα) and ERRγ are essential coordinators of cardiac metabolism and function.
Wang T, McDonald C, Petrenko NB, Leblanc M, Wang T, Giguere V, Evans RM, Patel VV, Pei L
Molecular and cellular biology 2015 Apr;35(7):1281-98
Molecular and cellular biology 2015 Apr;35(7):1281-98
PINK1-Parkin pathway activity is regulated by degradation of PINK1 in the mitochondrial matrix.
Thomas RE, Andrews LA, Burman JL, Lin WY, Pallanck LJ
PLoS genetics 2014;10(5):e1004279
PLoS genetics 2014;10(5):e1004279
Analysis of nuclear RNA interference in human cells by subcellular fractionation and Argonaute loading.
Gagnon KT, Li L, Janowski BA, Corey DR
Nature protocols 2014 Sep;9(9):2045-60
Nature protocols 2014 Sep;9(9):2045-60
A Drosophila model of mitochondrial disease caused by a complex I mutation that uncouples proton pumping from electron transfer.
Burman JL, Itsara LS, Kayser EB, Suthammarak W, Wang AM, Kaeberlein M, Sedensky MM, Morgan PG, Pallanck LJ
Disease models & mechanisms 2014 Oct;7(10):1165-74
Disease models & mechanisms 2014 Oct;7(10):1165-74
High-fat diet-induced impairment of skeletal muscle insulin sensitivity is not prevented by SIRT1 overexpression.
White AT, Philp A, Fridolfsson HN, Schilling JM, Murphy AN, Hamilton DL, McCurdy CE, Patel HH, Schenk S
American journal of physiology. Endocrinology and metabolism 2014 Nov 1;307(9):E764-72
American journal of physiology. Endocrinology and metabolism 2014 Nov 1;307(9):E764-72
Neuroglobin gene therapy prevents optic atrophy and preserves durably visual function in Harlequin mice.
Lechauve C, Augustin S, Cwerman-Thibault H, Reboussin É, Roussel D, Lai-Kuen R, Saubamea B, Sahel JA, Debeir T, Corral-Debrinski M
Molecular therapy : the journal of the American Society of Gene Therapy 2014 Jun;22(6):1096-1109
Molecular therapy : the journal of the American Society of Gene Therapy 2014 Jun;22(6):1096-1109
Population of ATP synthase molecules in mitochondria is limited by available 6.8-kDa proteolipid protein (MLQ).
Fujikawa M, Ohsakaya S, Sugawara K, Yoshida M
Genes to cells : devoted to molecular & cellular mechanisms 2014 Feb;19(2):153-60
Genes to cells : devoted to molecular & cellular mechanisms 2014 Feb;19(2):153-60
Involvement of ATP synthase β subunit in chikungunya virus entry into insect cells.
Fongsaran C, Jirakanwisal K, Kuadkitkan A, Wikan N, Wintachai P, Thepparit C, Ubol S, Phaonakrop N, Roytrakul S, Smith DR
Archives of virology 2014 Dec;159(12):3353-64
Archives of virology 2014 Dec;159(12):3353-64
IF1, a natural inhibitor of mitochondrial ATP synthase, is not essential for the normal growth and breeding of mice.
Nakamura J, Fujikawa M, Yoshida M
Bioscience reports 2013 Sep 17;33(5)
Bioscience reports 2013 Sep 17;33(5)
The N-terminal helix of Bcl-xL targets mitochondria.
McNally MA, Soane L, Roelofs BA, Hartman AL, Hardwick JM
Mitochondrion 2013 Mar;13(2):119-24
Mitochondrion 2013 Mar;13(2):119-24
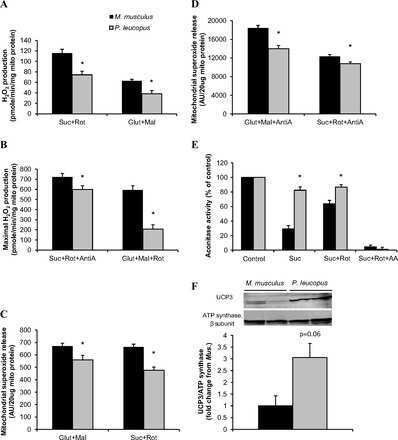
Reduced mitochondrial ROS, enhanced antioxidant defense, and distinct age-related changes in oxidative damage in muscles of long-lived Peromyscus leucopus.
Shi Y, Pulliam DA, Liu Y, Hamilton RT, Jernigan AL, Bhattacharya A, Sloane LB, Qi W, Chaudhuri A, Buffenstein R, Ungvari Z, Austad SN, Van Remmen H
American journal of physiology. Regulatory, integrative and comparative physiology 2013 Mar 1;304(5):R343-55
American journal of physiology. Regulatory, integrative and comparative physiology 2013 Mar 1;304(5):R343-55
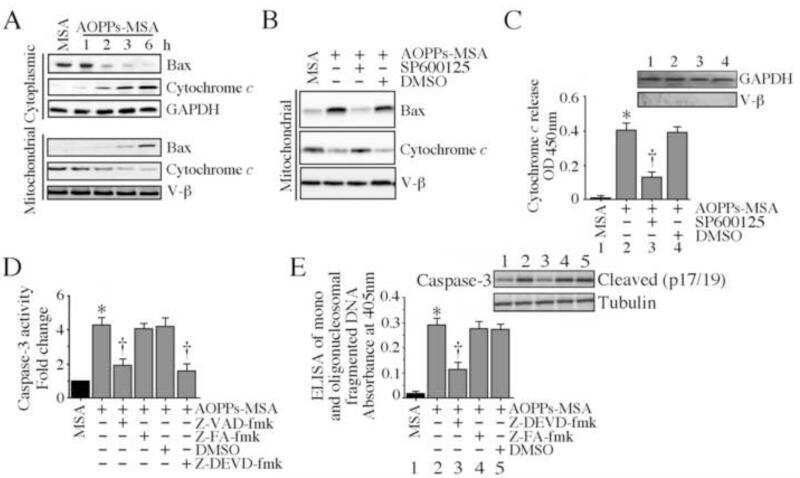
Advanced oxidation protein products induce cardiomyocyte death via Nox2/Rac1/superoxide-dependent TRAF3IP2/JNK signaling.
Valente AJ, Yoshida T, Clark RA, Delafontaine P, Siebenlist U, Chandrasekar B
Free radical biology & medicine 2013 Jul;60:125-35
Free radical biology & medicine 2013 Jul;60:125-35
Examining the interactome of huperzine A by magnetic biopanning.
Guo W, Liu S, Peng J, Wei X, Sun Y, Qiu Y, Gao G, Wang P, Xu Y
PloS one 2012;7(5):e37098
PloS one 2012;7(5):e37098
Assessing actual contribution of IF1, inhibitor of mitochondrial FoF1, to ATP homeostasis, cell growth, mitochondrial morphology, and cell viability.
Fujikawa M, Imamura H, Nakamura J, Yoshida M
The Journal of biological chemistry 2012 May 25;287(22):18781-7
The Journal of biological chemistry 2012 May 25;287(22):18781-7
Mild mitochondrial uncoupling does not affect mitochondrial biogenesis but downregulates pyruvate carboxylase in adipocytes: role for triglyceride content reduction.
De Pauw A, Demine S, Tejerina S, Dieu M, Delaive E, Kel A, Renard P, Raes M, Arnould T
American journal of physiology. Endocrinology and metabolism 2012 May 15;302(9):E1123-41
American journal of physiology. Endocrinology and metabolism 2012 May 15;302(9):E1123-41
Inhibition of tumor cell surface ATP synthesis by pigment epithelium-derived factor: implications for antitumor activity.
Deshpande M, Notari L, Subramanian P, Notario V, Becerra SP
International journal of oncology 2012 Jul;41(1):219-27
International journal of oncology 2012 Jul;41(1):219-27
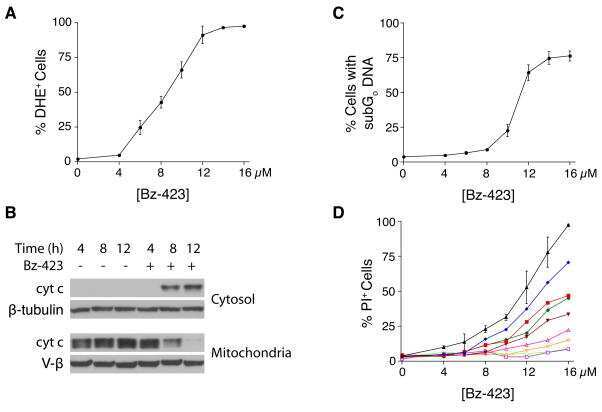
Modes of metabolic compensation during mitochondrial disease using the Drosophila model of ATP6 dysfunction.
Celotto AM, Chiu WK, Van Voorhies W, Palladino MJ
PloS one 2011;6(10):e25823
PloS one 2011;6(10):e25823
The PGC-1α-related coactivator promotes mitochondrial and myogenic adaptations in C2C12 myotubes.
Philp A, Belew MY, Evans A, Pham D, Sivia I, Chen A, Schenk S, Baar K
American journal of physiology. Regulatory, integrative and comparative physiology 2011 Oct;301(4):R864-72
American journal of physiology. Regulatory, integrative and comparative physiology 2011 Oct;301(4):R864-72
A mutation in a mitochondrial dehydrogenase/reductase gene causes an increased sensitivity to oxidative stress and mitochondrial defects in the nematode Caenorhabditis elegans.
Fujii M, Yasuda K, Hartman PS, Ayusawa D, Ishii N
Genes to cells : devoted to molecular & cellular mechanisms 2011 Oct;16(10):1022-34
Genes to cells : devoted to molecular & cellular mechanisms 2011 Oct;16(10):1022-34
Identification of human fumarylacetoacetate hydrolase domain-containing protein 1 (FAHD1) as a novel mitochondrial acylpyruvase.
Pircher H, Straganz GD, Ehehalt D, Morrow G, Tanguay RM, Jansen-Dürr P
The Journal of biological chemistry 2011 Oct 21;286(42):36500-8
The Journal of biological chemistry 2011 Oct 21;286(42):36500-8
Bcl-xL regulates mitochondrial energetics by stabilizing the inner membrane potential.
Chen YB, Aon MA, Hsu YT, Soane L, Teng X, McCaffery JM, Cheng WC, Qi B, Li H, Alavian KN, Dayhoff-Brannigan M, Zou S, Pineda FJ, O'Rourke B, Ko YH, Pedersen PL, Kaczmarek LK, Jonas EA, Hardwick JM
The Journal of cell biology 2011 Oct 17;195(2):263-76
The Journal of cell biology 2011 Oct 17;195(2):263-76
The microbiome and butyrate regulate energy metabolism and autophagy in the mammalian colon.
Donohoe DR, Garge N, Zhang X, Sun W, O'Connell TM, Bunger MK, Bultman SJ
Cell metabolism 2011 May 4;13(5):517-26
Cell metabolism 2011 May 4;13(5):517-26
Knockdown of DAPIT (diabetes-associated protein in insulin-sensitive tissue) results in loss of ATP synthase in mitochondria.
Ohsakaya S, Fujikawa M, Hisabori T, Yoshida M
The Journal of biological chemistry 2011 Jun 10;286(23):20292-6
The Journal of biological chemistry 2011 Jun 10;286(23):20292-6
The GTPase RAB20 is a HIF target with mitochondrial localization mediating apoptosis in hypoxia.
Hackenbeck T, Huber R, Schietke R, Knaup KX, Monti J, Wu X, Klanke B, Frey B, Gaipl U, Wullich B, Ferbus D, Goubin G, Warnecke C, Eckardt KU, Wiesener MS
Biochimica et biophysica acta 2011 Jan;1813(1):1-13
Biochimica et biophysica acta 2011 Jan;1813(1):1-13
Heterogeneous levels of oxidative phosphorylation enzymes in rat adrenal glands.
Ogawa K, Harada K, Endo Y, Sagawa S, Inoue M
Acta histochemica 2011 Jan;113(1):24-31
Acta histochemica 2011 Jan;113(1):24-31
Theiler's virus L* protein is targeted to the mitochondrial outer membrane.
Sorgeloos F, Vertommen D, Rider MH, Michiels T
Journal of virology 2011 Apr;85(7):3690-4
Journal of virology 2011 Apr;85(7):3690-4
A sensitive, simple assay of mitochondrial ATP synthesis of cultured mammalian cells suitable for high-throughput analysis.
Fujikawa M, Yoshida M
Biochemical and biophysical research communications 2010 Oct 29;401(4):538-43
Biochemical and biophysical research communications 2010 Oct 29;401(4):538-43
The proteome of human brain after ischemic stroke.
Cuadrado E, Rosell A, Colomé N, Hernández-Guillamon M, García-Berrocoso T, Ribo M, Alcazar A, Ortega-Aznar A, Salinas M, Canals F, Montaner J
Journal of neuropathology and experimental neurology 2010 Nov;69(11):1105-15
Journal of neuropathology and experimental neurology 2010 Nov;69(11):1105-15
WNT1-inducible signaling pathway protein-1 activates diverse cell survival pathways and blocks doxorubicin-induced cardiomyocyte death.
Venkatesan B, Prabhu SD, Venkatachalam K, Mummidi S, Valente AJ, Clark RA, Delafontaine P, Chandrasekar B
Cellular signalling 2010 May;22(5):809-20
Cellular signalling 2010 May;22(5):809-20
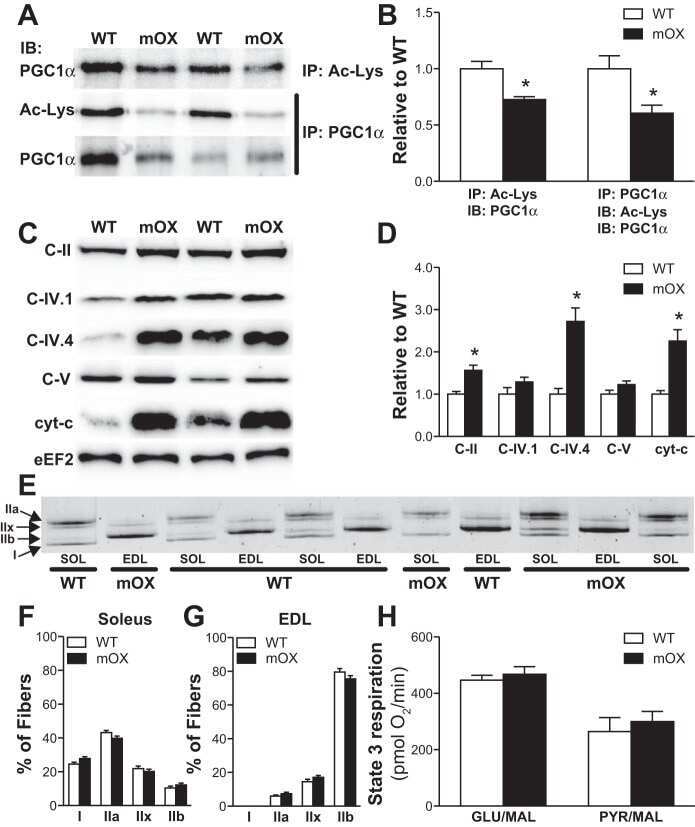
Pyruvate suppresses PGC1alpha expression and substrate utilization despite increased respiratory chain content in C2C12 myotubes.
Philp A, Perez-Schindler J, Green C, Hamilton DL, Baar K
American journal of physiology. Cell physiology 2010 Aug;299(2):C240-50
American journal of physiology. Cell physiology 2010 Aug;299(2):C240-50
The mitochondrial fusion-promoting factor mitofusin is a substrate of the PINK1/parkin pathway.
Poole AC, Thomas RE, Yu S, Vincow ES, Pallanck L
PloS one 2010 Apr 7;5(4):e10054
PloS one 2010 Apr 7;5(4):e10054
Histochemical methods for the diagnosis of mitochondrial diseases.
De Paepe B, De Bleecker JL, Van Coster R
Current protocols in human genetics 2009 Oct;Chapter 19:Unit19.2
Current protocols in human genetics 2009 Oct;Chapter 19:Unit19.2
Bz-423 superoxide signals B cell apoptosis via Mcl-1, Bak, and Bax.
Blatt NB, Boitano AE, Lyssiotis CA, Opipari AW Jr, Glick GD
Biochemical pharmacology 2009 Oct 15;78(8):966-73
Biochemical pharmacology 2009 Oct 15;78(8):966-73
Cisd2 deficiency drives premature aging and causes mitochondria-mediated defects in mice.
Chen YF, Kao CH, Chen YT, Wang CH, Wu CY, Tsai CY, Liu FC, Yang CW, Wei YH, Hsu MT, Tsai SF, Tsai TF
Genes & development 2009 May 15;23(10):1183-94
Genes & development 2009 May 15;23(10):1183-94
Bz-423 superoxide signals apoptosis via selective activation of JNK, Bak, and Bax.
Blatt NB, Boitano AE, Lyssiotis CA, Opipari AW Jr, Glick GD
Free radical biology & medicine 2008 Nov 1;45(9):1232-42
Free radical biology & medicine 2008 Nov 1;45(9):1232-42
Mitochondrial proteomics of the retinal pigment epithelium at progressive stages of age-related macular degeneration.
Nordgaard CL, Karunadharma PP, Feng X, Olsen TW, Ferrington DA
Investigative ophthalmology & visual science 2008 Jul;49(7):2848-55
Investigative ophthalmology & visual science 2008 Jul;49(7):2848-55
Subdiffraction-resolution fluorescence imaging of proteins in the mitochondrial inner membrane with photoswitchable fluorophores.
van de Linde S, Sauer M, Heilemann M
Journal of structural biology 2008 Dec;164(3):250-4
Journal of structural biology 2008 Dec;164(3):250-4
Dual functions of a monoclonal antibody against cell surface F1F0 ATP synthase on both HUVEC and tumor cells.
Zhang X, Gao F, Yu LL, Peng Y, Liu HH, Liu JY, Yin M, Ni J
Acta pharmacologica Sinica 2008 Aug;29(8):942-50
Acta pharmacologica Sinica 2008 Aug;29(8):942-50
2,2'-thiodiethanol: a new water soluble mounting medium for high resolution optical microscopy.
Staudt T, Lang MC, Medda R, Engelhardt J, Hell SW
Microscopy research and technique 2007 Jan;70(1):1-9
Microscopy research and technique 2007 Jan;70(1):1-9
Motor neuron degeneration in amyotrophic lateral sclerosis mutant superoxide dismutase-1 transgenic mice: mechanisms of mitochondriopathy and cell death.
Martin LJ, Liu Z, Chen K, Price AC, Pan Y, Swaby JA, Golden WC
The Journal of comparative neurology 2007 Jan 1;500(1):20-46
The Journal of comparative neurology 2007 Jan 1;500(1):20-46
Coordination of nuclear- and mitochondrial-DNA encoded proteins in cancer and normal colon tissues.
Mazzanti R, Giulivi C
Biochimica et biophysica acta 2006 May-Jun;1757(5-6):618-23
Biochimica et biophysica acta 2006 May-Jun;1757(5-6):618-23
Differential expression proteomics of human colon cancer.
Mazzanti R, Solazzo M, Fantappié O, Elfering S, Pantaleo P, Bechi P, Cianchi F, Ettl A, Giulivi C
American journal of physiology. Gastrointestinal and liver physiology 2006 Jun;290(6):G1329-38
American journal of physiology. Gastrointestinal and liver physiology 2006 Jun;290(6):G1329-38
No comments: Submit comment
Supportive validation
- Submitted by
- Invitrogen Antibodies (provider)
- Main image

- Experimental details
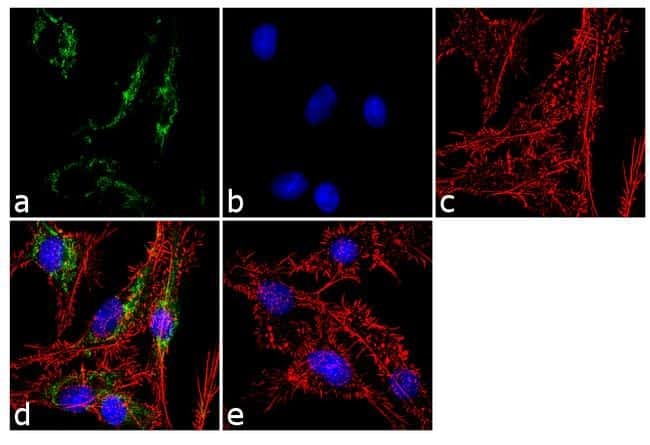
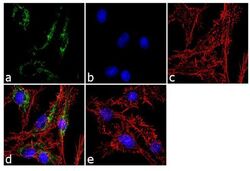
- Immunofluorescent analysis of ATP Synthase Subunit beta was performed using 70% confluent log phase Hep G2 cells. The cells were fixed with 4% paraformaldehyde for 10 minutes, permeabilized with 0.1% Triton™ X-100 for 10 minutes, and blocked with 1% BSA for 1 hour at room temperature. The cells were labeled with ATP Synthase Subunit beta (3D5AB1) Mouse Monoclonal Antibody (Product # A-21351) at 2 µg/mL in 0.1% BSA and incubated for 3 hours at room temperature and then labeled with Goat anti-Mouse IgG (H+L) Superclonal™ Secondary Antibody, Alexa Fluor® 488 conjugate (Product # A28175) a dilution of 1:2000 for 45 minutes at room temperature (Panel a: green). Nuclei (Panel b: blue) were stained with SlowFade® Gold Antifade Mountant with DAPI (Product # S36938). F-actin (Panel c: red) was stained with Alexa Fluor® 555 Rhodamine Phalloidin (Product # R415, 1:300). Panel d represents the merged image showing cytoplasmic localization. Panel e shows the no primary antibody control. The images were captured at 60X magnification.
- Submitted by
- Invitrogen Antibodies (provider)
- Main image
- Experimental details
- Immunofluorescent analysis of ATP Synthase Subunit beta was performed using 70% confluent log phase Hep G2 cells. The cells were fixed with 4% paraformaldehyde for 10 minutes, permeabilized with 0.1% Triton™ X-100 for 10 minutes, and blocked with 1% BSA for 1 hour at room temperature. The cells were labeled with ATP Synthase Subunit beta (3D5AB1) Mouse Monoclonal Antibody (Product # A-21351) at 2 µg/mL in 0.1% BSA and incubated for 3 hours at room temperature and then labeled with Goat anti-Mouse IgG (H+L) Superclonal™ Secondary Antibody, Alexa Fluor® 488 conjugate (Product # A28175) a dilution of 1:2000 for 45 minutes at room temperature (Panel a: green). Nuclei (Panel b: blue) were stained with SlowFade® Gold Antifade Mountant with DAPI (Product # S36938). F-actin (Panel c: red) was stained with Alexa Fluor® 555 Rhodamine Phalloidin (Product # R415, 1:300). Panel d represents the merged image showing cytoplasmic localization. Panel e shows the no primary antibody control. The images were captured at 60X magnification.

Supportive validation
- Submitted by
- Invitrogen Antibodies (provider)
- Main image
- Experimental details
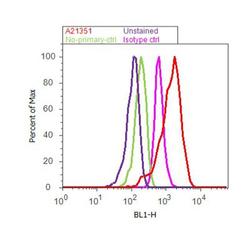
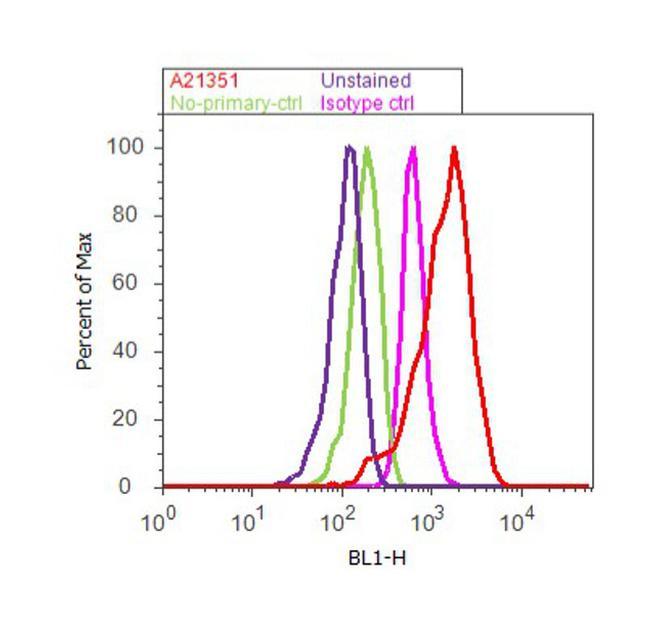
- Flow cytometry analysis of ATP Synthase Subunit beta was done on Hep G2 cells. Cells were fixed with 70% ethanol for 10 minutes, permeabilized with 0.25% Triton™ X-100 for 20 minutes, and blocked with 5% BSA for 30 minutes at room temperature. Cells were labeled with ATP Synthase Subunit beta Mouse Monoclonal Antibody (A-21351, red histogram) or with mouse isotype control (pink histogram) at 3-5 ug/million cells in 2.5% BSA. After incubation at room temperature for 2 hours, the cells were labeled with Alexa Fluor® 488 Rabbit Anti-Mouse Secondary Antibody (A11059) at a dilution of 1:400 for 30 minutes at room temperature. The representative 10, 000 cells were acquired and analyzed for each sample using an Attune® Acoustic Focusing Cytometer. The purple histogram represents unstained control cells and the green histogram represents no-primary-antibody control.
Supportive validation
- Submitted by
- Invitrogen Antibodies (provider)
- Main image
- Experimental details
- NULL
- Submitted by
- Invitrogen Antibodies (provider)
- Main image
- Experimental details
- NULL
- Submitted by
- Invitrogen Antibodies (provider)
- Main image
- Experimental details
- NULL
- Submitted by
- Invitrogen Antibodies (provider)
- Main image
- Experimental details
- NULL

- Submitted by
- Invitrogen Antibodies (provider)
- Main image
- Experimental details
- NULL
- Submitted by
- Invitrogen Antibodies (provider)
- Main image
- Experimental details
- NULL

- Submitted by
- Invitrogen Antibodies (provider)
- Main image

- Experimental details
- NULL
- Submitted by
- Invitrogen Antibodies (provider)
- Main image
- Experimental details
- NULL

- Submitted by
- Invitrogen Antibodies (provider)
- Main image
- Experimental details
- NULL
- Submitted by
- Invitrogen Antibodies (provider)
- Main image

- Experimental details
- NULL
- Submitted by
- Invitrogen Antibodies (provider)
- Main image
- Experimental details
- NULL
- Submitted by
- Invitrogen Antibodies (provider)
- Main image
- Experimental details
- NULL
- Submitted by
- Invitrogen Antibodies (provider)
- Main image

- Experimental details
- NULL
- Submitted by
- Invitrogen Antibodies (provider)
- Main image
- Experimental details
- NULL
- Submitted by
- Invitrogen Antibodies (provider)
- Main image
- Experimental details
- NULL
- Submitted by
- Invitrogen Antibodies (provider)
- Main image
- Experimental details
- NULL
- Submitted by
- Invitrogen Antibodies (provider)
- Main image
- Experimental details
- NULL
- Submitted by
- Invitrogen Antibodies (provider)
- Main image
- Experimental details
- NULL
- Submitted by
- Invitrogen Antibodies (provider)
- Main image
- Experimental details
- NULL

- Submitted by
- Invitrogen Antibodies (provider)
- Main image
- Experimental details
- NULL

- Submitted by
- Invitrogen Antibodies (provider)
- Main image

- Experimental details
- NULL
- Submitted by
- Invitrogen Antibodies (provider)
- Main image
- Experimental details
- NULL

- Submitted by
- Invitrogen Antibodies (provider)
- Main image

- Experimental details
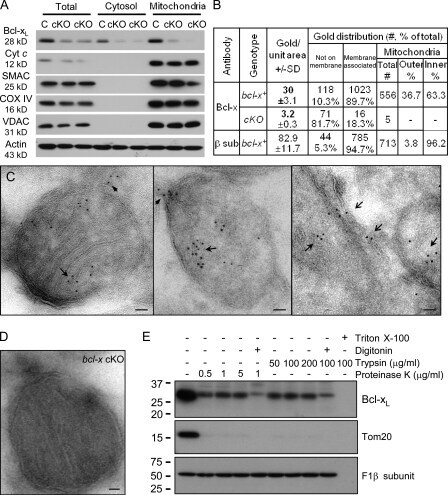
- Figure 2. Submitochondrial localization of endogenousBcl-x L . (A) Immunoblots of total cell lysates(clarified), cytosolic fractions, and heavy membranes prepared fromdissected cortexes pooled from three 3-d-old mice per sample. Blots wereprobed with antibodies to Bcl-x L (1:1,000; provided by L.Boise), cytochrome c (Cyt c ; 7H8.2C12[1:1,000]), cytochrome oxidase subunit IV (COX IV; 1:1,000; Invitrogen),SMAC (1:1,000; Invitrogen), voltage-dependent anion channel (VDAC;1:1,000; EMD), actin (1:1,000; MP Biomedicals), and UCP-2 (6525 [1:100;Santa Cruz Biotechnology, Inc.]). A representative of three independentexperiments is shown. (B) Summary of immunogold EM staining forBcl-x L and ATP synthase beta proteins in control andcKO mouse brain representing three independent experiments. (C) EM ofmicrodissected CA1 hippocampus (where CA1 synapses onto CA3) from mousebrains stained with gold-labeled Bcl-x L antibody detectsBcl-x L on mitochondrial inner membranes/cristae (blackarrows), outer membrane polar clusters (arrowheads), and adjacentmembranes (line arrows). Bars, 0.1 um. (D) Immunogold staining of bcl-x cKO CA1 mouse brain prepared in parallel asin C. Bar, 0.1 um. (E) Immunoblot analysis of Percoll-purifiednonsynaptic adult rat brain mitochondria. Mitochondria were incubatedwith the indicated proteases (for 30 min) with or without 0.01%digitonin to permeabilize the outer membrane and were blotted forBcl-x L (1:1,000; Abcam), Tom20 (11415 [1:2,000; SantaCruz Biotechnology, Inc.
- Submitted by
- Invitrogen Antibodies (provider)
- Main image
- Experimental details
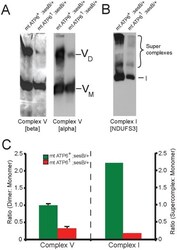
- Figure 7 Impaired complex V dimerization and complex I supercomplex formation. A) BN-western analysis with beta and alpha subunit antibodies reveals a marked reduction in complex V dimer (VD) relative to monomer (VM) in ATP6 1 mitochondrial isolates compared to wild type controls. B) BN-western analysis using an antibody to complex I (NDUFS3) reveals a loss in normal supercomplexes in ATP6 1 mitochondria. C) Quantitation of the westerns shown in panels A and B comparing WT (green) to ATP6 1 (red): dimer to monomer ratio of complex V and supercomplex to monomer ratio of complex I.

- Submitted by
- Invitrogen Antibodies (provider)
- Main image

- Experimental details
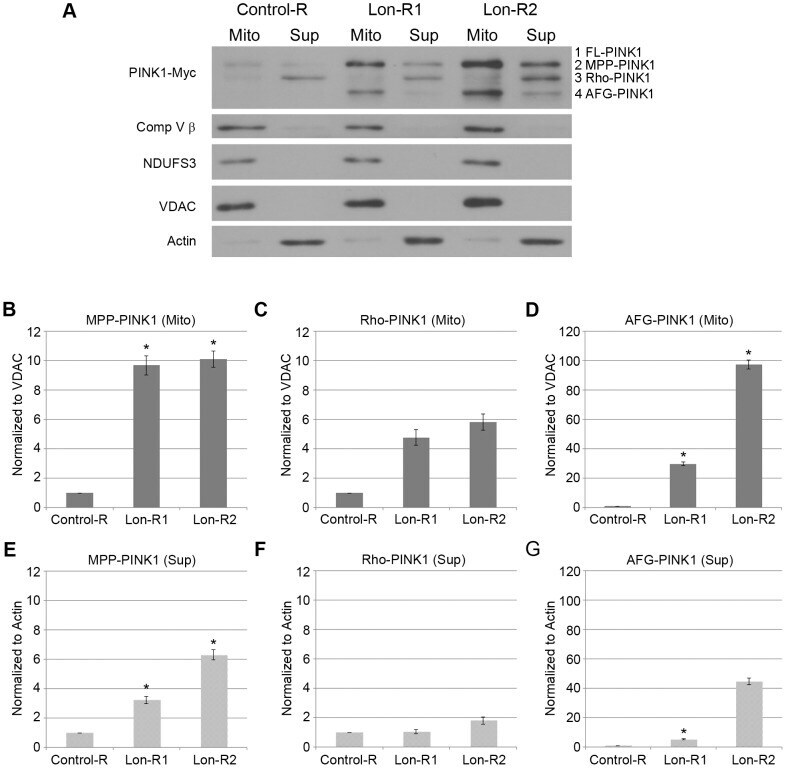
- Figure 2 PINK1 accumulates in the mitochondrial and postmitochondrial supernatant fractions upon knockdown of Lon. (A) Mitochondrial (Mito) and postmitochondrial supernatant (Sup) protein fractions isolated from the heads of flies of the indicated genotypes were analyzed by western blot with antibodies to Myc, Complex V beta (Comp V beta), NADH dehydrogenase (ubiquinone) Fe-S protein 3 (NDUFS3), voltage-dependent anion channel (VDAC) and Actin. elav-GAL4 was used to drive expression of the RNAi constructs used in these experiments. (B) Densitometry of the MPP-PINK1 bands in the mitochondrial fractions from the indicated genotypes was performed using Fiji software. PINK1 band intensities were normalized to VDAC intensity, and this ratio was in turn normalized to the MPP-PINK1/VDAC ratio in Control-R animals. (C) Quantification of the Rho-PINK1 band intensities in mitochondrial fractions from the indicated genotypes was performed as described in B. (D) Quantification of the AFG-PINK1 band intensities in mitochondrial fractions from the indicated genotypes was performed as described in B. (E) Quantification of the MPP-PINK1 band intensities in the supernatant fractions from the indicated genotypes was performed as described in B except that Actin rather than VDAC was used as the loading control. (F) Quantification of the Rho-PINK1 band intensities in supernatant fractions from the indicated genotypes was performed as described in E. (G) Quantification of the AFG-PINK1 band inten
- Submitted by
- Invitrogen Antibodies (provider)
- Main image
- Experimental details
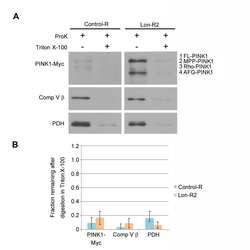
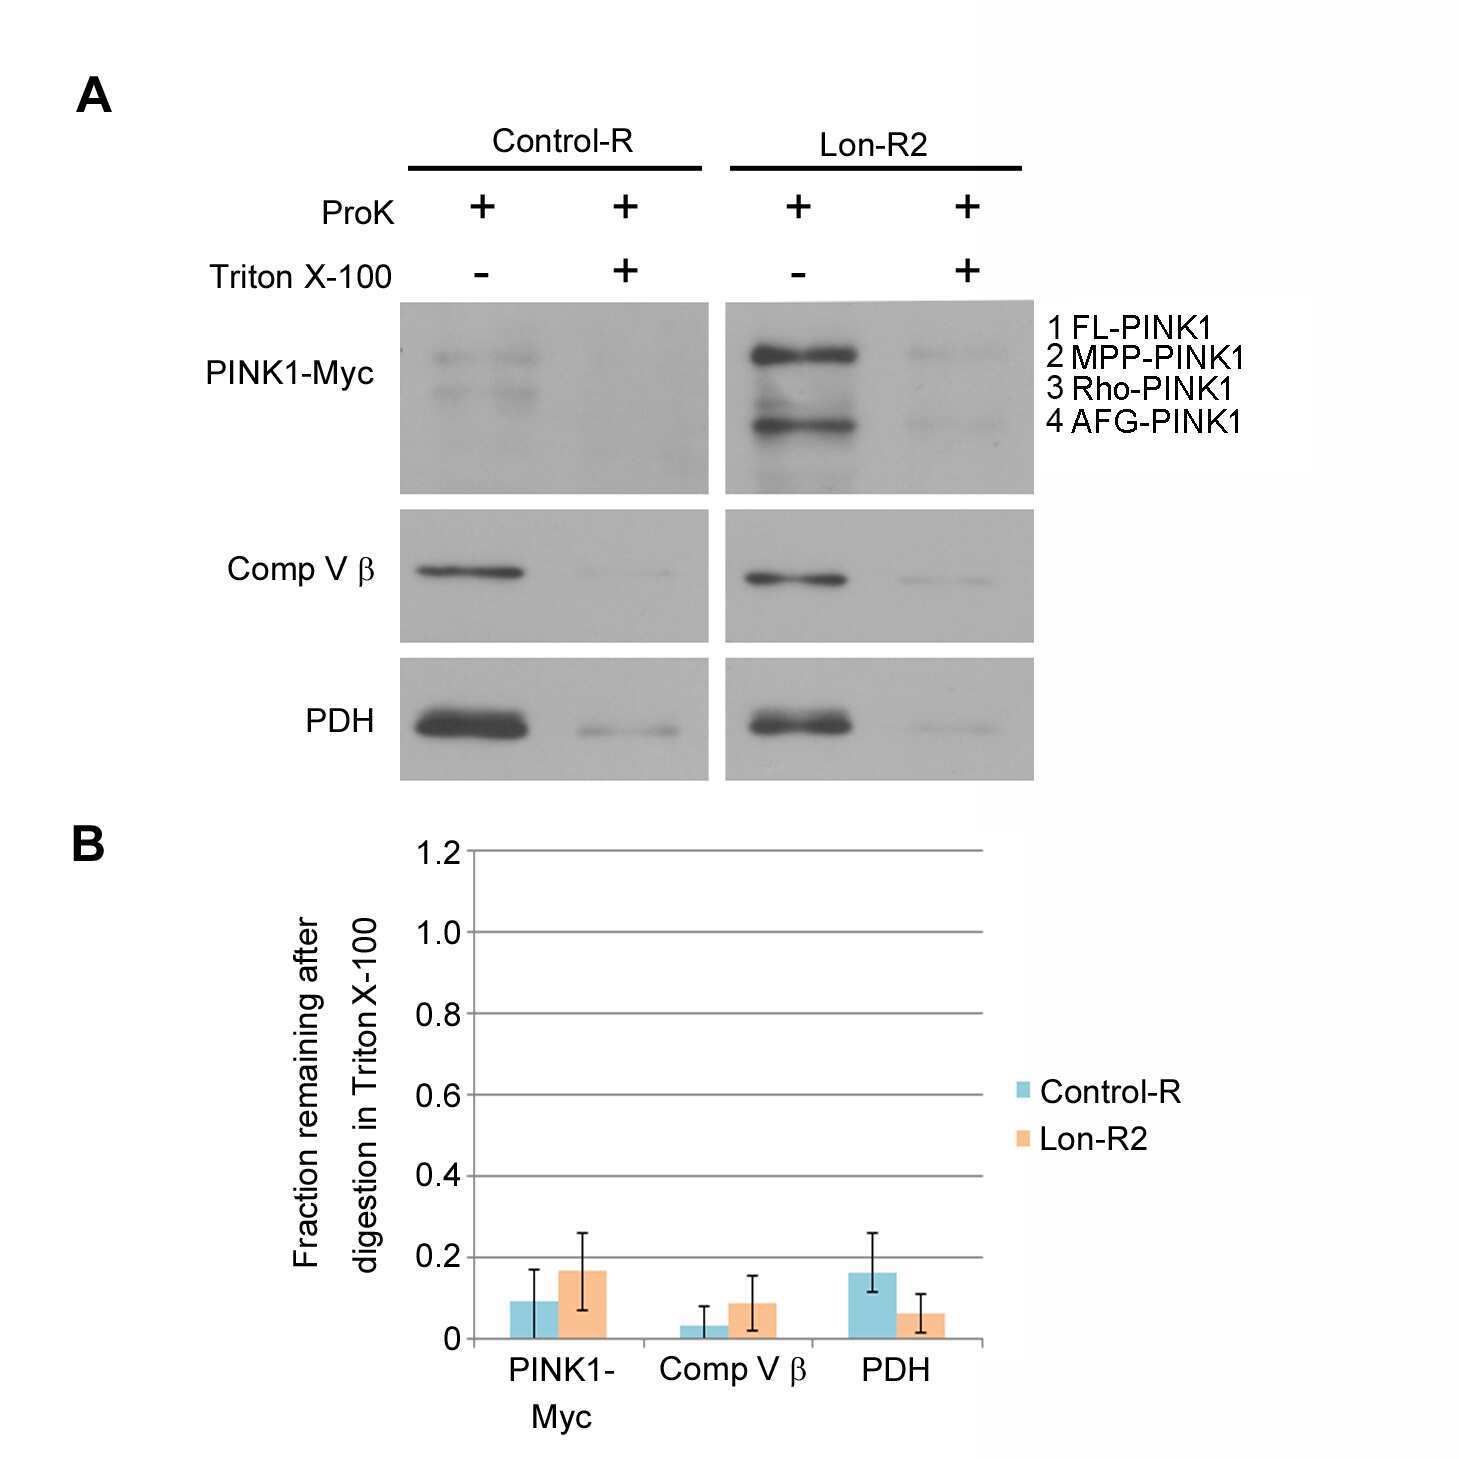
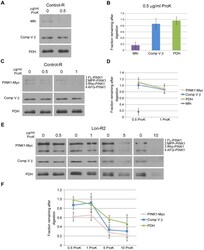
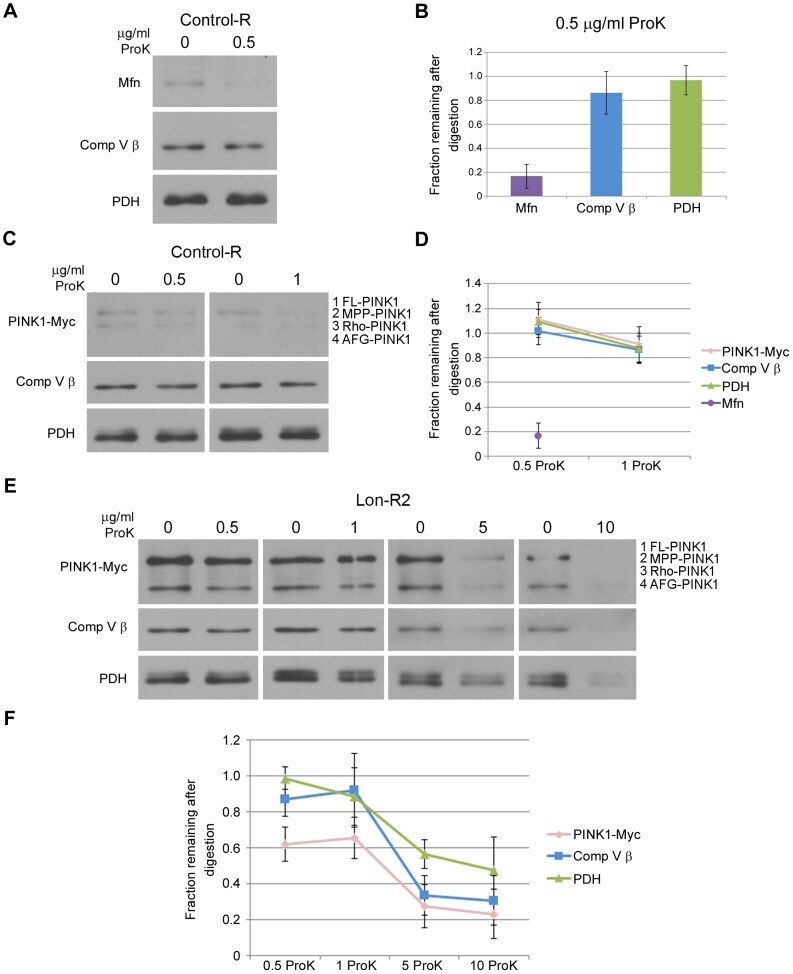
- Figure 3 PINK1 accumulates on the outer membrane and in the matrix upon knockdown of Lon. (A) Mitochondrial fractions isolated from the heads of flies expressing Control-R were divided in half. One of the two samples was treated with 0.5 ug/ml Proteinase K and both samples were incubated at 4degC for 20 minutes. Samples were then subjected to western blot analysis using antibodies to the outer membrane protein Mitofusin (Mfn), the inner membrane-associated matrix protein Complex V beta (Comp V beta), and the matrix luminal protein pyruvate dehydrogenase (PDH). elav-GAL4 was used to drive expression of all the RNAi constructs used in this and the following experiments. (B) Densitometry of Mfn, Comp V beta, and PDH bands from experiments represented by panel A were performed using Fiji software, and the ratios of the band intensities in the sample containing ProK to the sample lacking ProK are shown. (C) Mitochondrial fractions isolated from the heads of flies expressing Control-R and PINK1-Myc were divided in half. Each sample was treated with the indicated concentrations of ProK. Following incubation, samples were subjected to western blot analysis using antibodies to the indicated proteins. (D) Densitometry of the PINK1-Myc, Comp V beta, and PDH bands from experiments represented by panel C were performed as described in B. The Mfn quantification data from panel B is also included for comparison. (E) Mitochondrial fractions isolated from the heads of Lon-R2 and PINK1-Myc exp
- Submitted by
- Invitrogen Antibodies (provider)
- Main image
- Experimental details
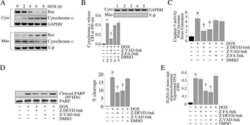
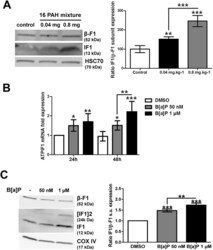
- Figure 2 Effects of PAHs on IF1 expression both in vivo and in vitro . ( A ) The levels of IF1 protein and of the beta-F1 subunit of the F0F1ATPase were analyzed by western blotting in liver tissues from rats exposed to 0.04 or 0.8 mg.kg -1 of a 16 PAH mixture. HSC70 was used as loading control. ( B ) IF1 mRNA expression was monitored in F258 cells treated with B[a]P (50 nM or 1 uM) for 24 or 48 hours. ( C ) The IF1 protein content of mitochondrial fractions of B[a]P-exposed F258 cells was evaluated by western blotting. Histogram gives the results of densitometric analysis of IF1 protein level relative to beta-F1 subunit protein level. COXIV was used as loading control. Number of independent experiments = 3 for all conditions. *p < 0.05, **p < 0.01, ***p < 0.001, DMSO vs B[a]P-treated cells, unless otherwise quoted.

- Submitted by
- Invitrogen Antibodies (provider)
- Main image
- Experimental details
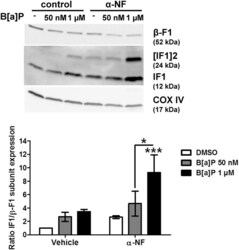
- Figure 3 B[a]P metabolism was not involved in IF1 up-regulation in response to B[a]P. F258 cells were pre-treated for 1 hour with alpha-NF (10 uM) prior to co-exposure to B[a]P for 48 hours. The involvement of B[a]P metabolism in IF1 up-regulation was assessed by analyzing IF1 protein level on mitochondrial fractions by western blotting. Histogram gives the results of densitometric analysis of IF1 protein level relative to beta-F1 subunit protein level. COXIV was used as loading control. Results were representative of 3 independent experiments. *p < 0.05, ***p < 0.001, DMSO vs B[a]P-treated cells, unless otherwise quoted.

- Submitted by
- Invitrogen Antibodies (provider)
- Main image
- Experimental details
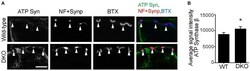
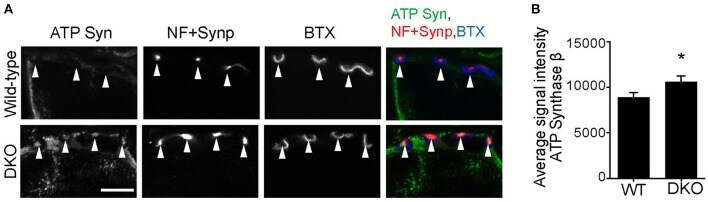
- Figure 8 Higher level of ATP synthase protein in presynaptic terminals of Pink1/Parkin DKO mice. (A) Representative confocal micrographs of immunohistochemistry for mitochondrial protein ATP synthase beta subunit (ATP Syn) in presynaptic terminals (arrowheads) of tibialis anterior NMJs in the Pink1/Parkin DKO mice at ages between P85 and P110 compared to wild-type mice of the same age. Presynaptic terminals of NMJs were defined by anti-neurofilament and anti-synaptophysin staining pattern (NF + Synp). Postsynaptic acetylcholine receptors were labeled with Alexa 594-conjugated alpha-bungarotoxin (BTX). In these cross-section images of NMJs, presynaptic terminals are above the bungarotoxin signal, and postsynaptic myotubes are below the bungarotoxin signal. Scale bar: 10 mum. (B) Average signal intensity of ATP synthase beta subunit is greater in presynaptic terminals of Pink1/Parkin DKO mice than in those of wild-type mice. Quantifications are from n = four animals and 97-101 NMJs for each genotype in confocal images. Graph shows mean +- SEM. Asterisks indicate significant differences as analyzed by un-paired t -test (* p < 0.05).
- Submitted by
- Invitrogen Antibodies (provider)
- Main image

- Experimental details
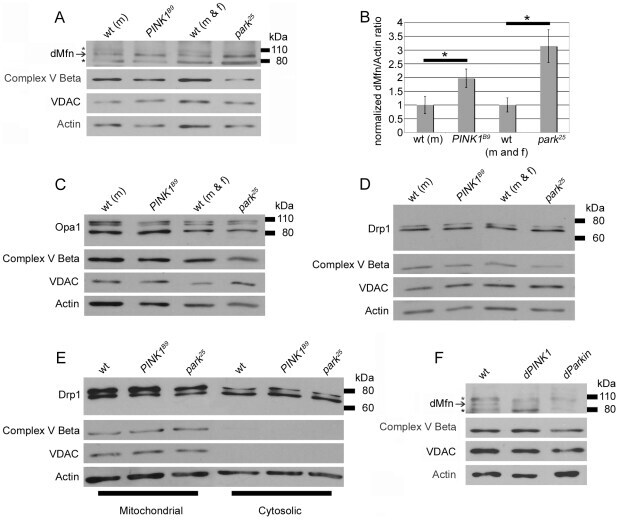
- Figure 2 Perturbations of PINK1 and parkin specifically influence dMfn abundance. Protein extracts from wt males (m), PINK1 B9 hemizygous males, wt males and females (m and f) and park 25 males and females were subjected to western blot analysis with an affinity-purified anti-dMfn antiserum (A), an anti-Opa1 antiserum (C), an affinity-purified anti-Drp1 antiserum (D), an anti-complex V beta antiserum (A, C, D), an anti-VDAC antiserum (A, C, D), and an anti-actin antiserum (A, C, D). Arrow in (A) indicates location of the dMfn band at 94 kDa and the asterisks (*) indicate nonspecific bands. (B) Quantification of dMfn abundance in PINK B9 and park 25 mutants relative to wt controls. Because PINK1 B9 males are sterile and the PINK1 gene resides on the X chromosome, we are only able to generate male PINK1 B9 mutants and thus used wt males as the control population for these mutants. The ratio of dMfn to actin abundance was obtained from three independent blots for each sample analyzed; the ratios for wt controls were set at a value of 1 and mutant ratios were normalized to the wt ratios. *p
- Submitted by
- Invitrogen Antibodies (provider)
- Main image

- Experimental details
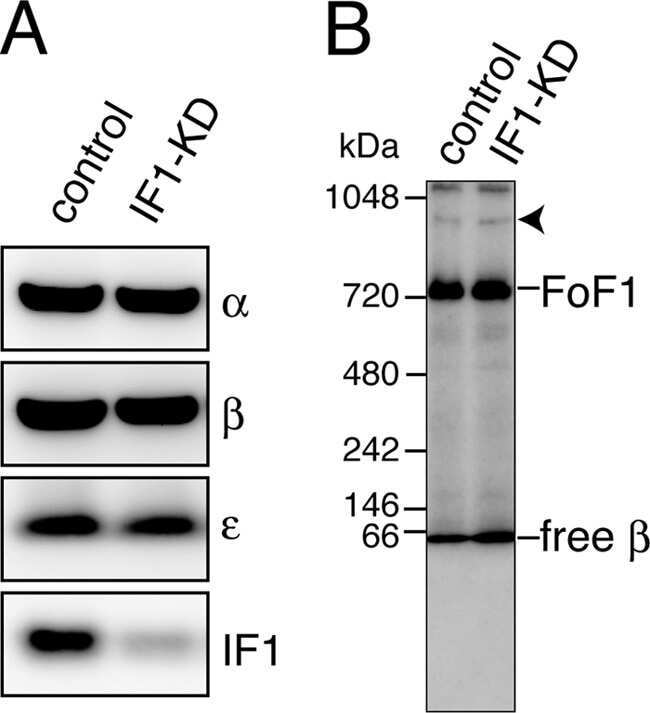
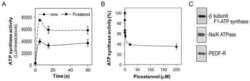
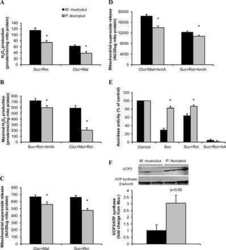
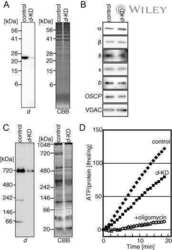
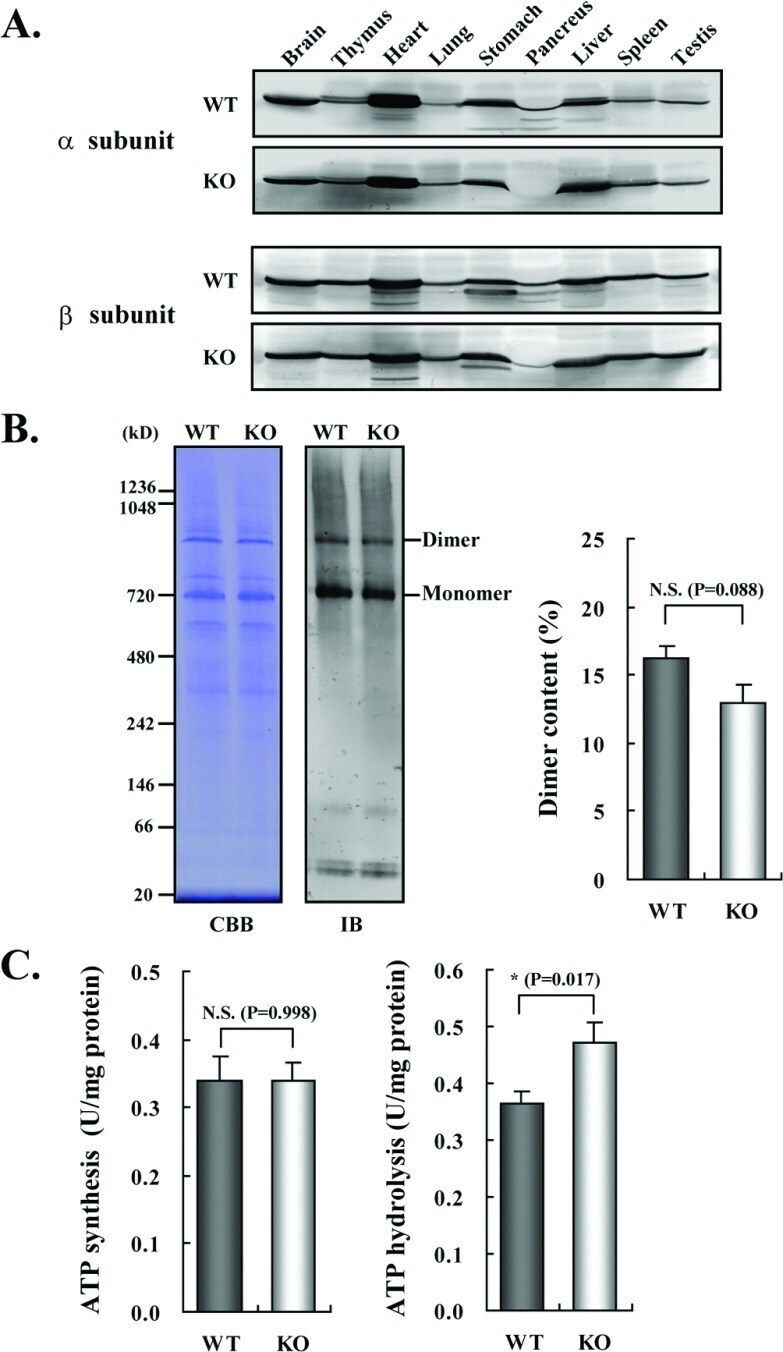
- Figure 3 Expression and activities of ATP synthase in IF1-KO mouse ( A ) Expression of alpha- and beta-subunits of ATP synthase in various tissues. Whole protein extracts of different tissues from 3-month-old WT and IF1-KO mice were analysed by SDS/PAGE followed by immunoblotting. ( B ) Content of the monomer and dimer forms of ATP synthases in mitochondria. Left panel. Clear Native PAGE. The solubilized mitochondrial protein (5 mug) of the hearts from 8-month-old WT and IF1-KO mice were subjected to Clear Native PAGE and immunoblotted with anti-beta subunit of ATP synthase antibody. Another gel was stained with CBB (Coomassie Brilliant Blue) to show that equal amount of proteins were loaded to PAGE. The positions of molecular mass markers are indicated on the left. Right panel. WT ( n =6) and IF1-KO ( n =5) mice were subjected to the analysis and band intensities were quantified. Dimer content (%) is expressed as 100xdimer/(monomer+dimer). ( C ) Mitochondrial ATP synthesis and hydrolysis activities. Mitochondria were prepared from livers of 4-month-old WT ( n =6) and IF1-KO ( n =5) mice.
- Submitted by
- Invitrogen Antibodies (provider)
- Main image
- Experimental details
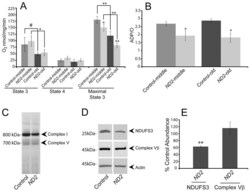
- Fig. 3. ND2 mutants exhibit decreased mitochondrial function. (A) Mitochondrial complex-I-dependent respiration rates were measured in mitochondria isolated from middle-aged (14-day-old) or old (30- to 35-day-old) ND2 mutant or controls, revealing age-related declines in both state 3 and maximal state 3 values within genotypes ( P =0.08 and P =0.03 for comparison of middle-aged and old control or ND2 mutant state 3 values, respectively; P =0.001 and P =0.003 for comparison of middle-aged and old control or ND2 mutant maximal state 3 values, respectively). State 4 respiration was similar under all conditions tested. No differences were found for state 3 values between control and ND2 mutants at either middle or old ages. However, maximal state 3 values were decreased in both middle-aged and old ND2 mutants when compared with age-matched controls ( P =0.04 for middle-aged and P =0.003 for old animals). Error bars represent standard deviations; n =3 independent mitochondrial preparations; ** P

- Submitted by
- Invitrogen Antibodies (provider)
- Main image
- Experimental details
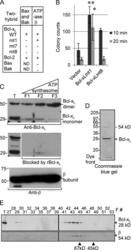
- Figure 3. Bcl-x L association with inner mitochondrial membranecomponents. (A) Summary of yeast two-hybrid interactionsbetween BCL-2 family proteins and the ATP synthase beta subunit,including wild-type (WT) and Bcl-x L mutants mt1(F131V/D133A), mt7 (V135A/N136I/W137L), and mt8 (G138E/R139L/I140N). (B)Yeast (BY4741) transformed with the indicated plasmids were heat ramptreated and presented as colony counts from four determinations in twoindependent experiments. Data are presented as the mean +- SEM.Student's t test was used; *, P =0.012 compared with control; **, P = 0.001. (C)Immunoblots for Bcl-x L (provided by L. Boise) or betasubunit in total rat liver mitochondria (T), inner membrane vesicles(F1), and highly purified ATP synthasomes (F2 and F3) of increasingpurity ( Ko et al., 2003 ). Thereplicate blot in the middle was probed with Bcl-x L antibodypreincubated with recombinant Bcl-x L (rBcl-x L )protein purified from Escherichia coli (lanesF1-F3 only). (D) Coomassie blue-stained preparative SDSgel of final purification step for Bcl-x L -bindingpartners from WEHI 7.1 cells. (E) Immunoblots for Bcl-x L andbeta subunit in size column chromatography fractions (F) and totallysates (T). Eluted size markers are indicated.

- Submitted by
- Invitrogen Antibodies (provider)
- Main image
- Experimental details
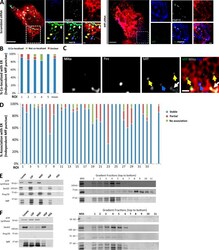
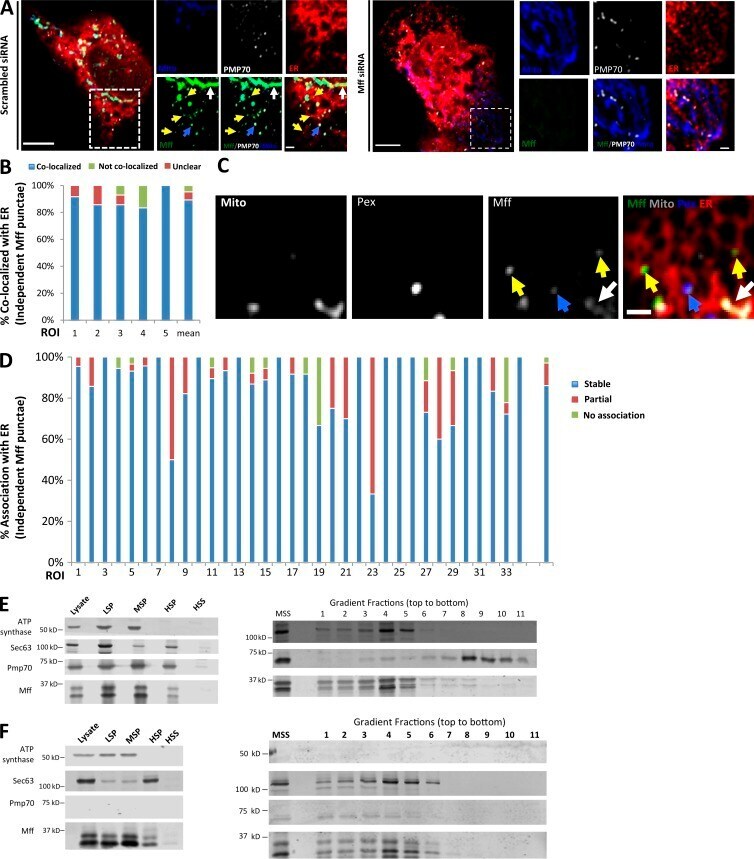
- Figure 4. A subpopulation of Mff localizes to ER. (A) Endogenous Mff localization in a fixed U2OS cell by immunofluorescence. Cells labeled with anti-Tom20 (mitochondria, blue), anti-PMP70 (peroxisomes, gray), anti-Mff (green) and transfected with ER-TagRFP (ER, red). Left, scrambled siRNA; right, Mff siRNA. Yellow arrows, independent punctae; blue arrow, peroxisome-associated puncta; white arrow, mitochondrially associated Mff. (B) Graph depicting the percentage of colocalization between independent Mff punctae and ER in U2OS cells (endogenous Mff). 54 independent Mff punctae were counted from five ROIs from four cells. Mean values from ROIs: 89.3 +- 6.7%, colocalized Mff with ER; 6.0 +- 6.1%, not colocalized; 4.8 +- 7.3%, unclear localization. (C) Live-cell time-lapse of GFP-Mff-S (green) in U2OS cell also expressing mCherry-mito3 (gray), eBFP2-peroxisome (blue), and E2-Crimson-ER (red). Yellow arrows, independent Mff punctae associating with ER; blue and gray arrows, peroxisomal and mitochondrial Mff, respectively. See also Video 6. (D) Graph depicting the degree of association between independent GFP-Mff-S punctae and ER from live-cell videos as in C (2.5-min videos imaged every 1.5 s). 34 ROIs from 30 U2OS cells analyzed (441 independent Mff punctae). Mean values from ROIs: 86.1 +- 17.1%, stably associated Mff punctae with ER; 11.0 +- 16.8%, partially associated; 4.6 +- 9.4%, not associated. (E) U2OS fractionation. Left: LSP, MSP, and HSP are low, medium, and
- Submitted by
- Invitrogen Antibodies (provider)
- Main image
- Experimental details
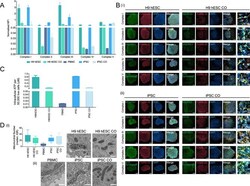
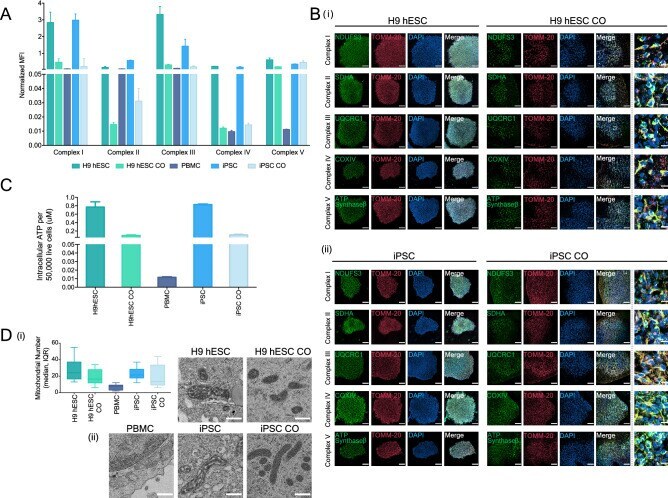
- Figure 4 Mitochondrial oxidative phosphorylation and morphology throughout CO generation. ( A ) Bar graph showing the oxidative phosphorylation (OXPHOS) complexes I-V assembly levels in H9 hESCs, H9 hESC COs, PBMCs, iPSCs and iPSC COs. Median fluorescence intensities for each complex were recorded using Luminex technology. Bars, median fluorescence intensity +- SD. ( B ) Representative immunofluorescence images showing the formation of the inner mitochondrial membrane OXPHOS proteins (complex I, NDUFS3; complex II, SDHA; complex III, UQCRC1; complex IV, COXIV; complex V, ATP synthase-beta; green) and the outer mitochondrial membrane (TOMM-20; red) in (i) H9 hESCs to H9 hESC COs and; (ii) iPSCs to iPSC COs. All scale bars, 100 mum. Last column shows insets, enlarged views of boxed areas from the merge CO images, all scale bars, 10 mum. In the CO tissues, out of focus light and autofluorescence of tissue matrix led to background noise which were corrected for better visualization. Brightness levels of each images were also adjusted to optimize visualization. Immunofluorescent images shown here were used for qualitative observations only--no quantitative analyses were performed. ( C ) Bar graph showing the intracellular ATP levels across H9 hESCs to H9 hESC COs and PBMCs, iPSCs to iPSC COs, bars, mean +- SD. ( D ) (i) Box plot summarizing the median number of mitochondria in 10 cells examined, boxes, median and interquartile range, IQR. (ii) Representative electron micrographs o
- Submitted by
- Invitrogen Antibodies (provider)
- Main image
- Experimental details
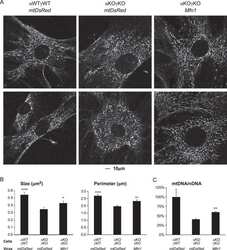
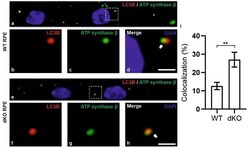
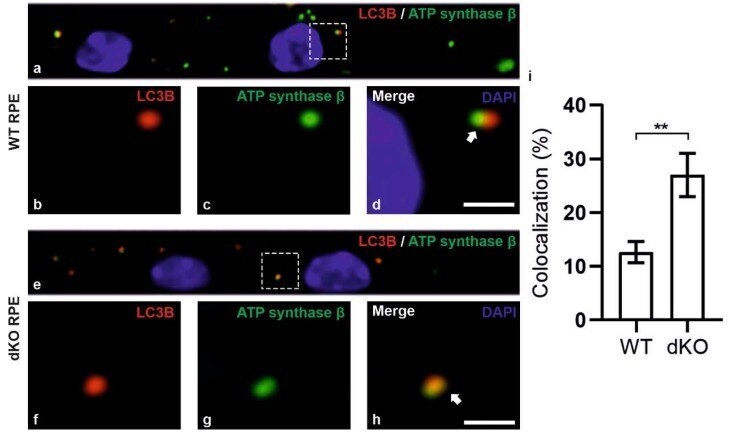
- Figure 5 Confocal microscopy analysis of autophagosome marker LC3B and mitochondrial marker ATP synthase beta in WT and dKO RPE cells ( a , e ). The colocalization of LC3B ( b , f ) and ATP synthase beta ( c , g ) will show the amount of local autophagosome formation. Our image analysis showed a ~158% increase in the LC3B and ATP synthase beta colocalization in dKO compared to in WT ( d , h , i ). Scale = 5 um. **p < 0.0025.
- Submitted by
- Invitrogen Antibodies (provider)
- Main image
- Experimental details
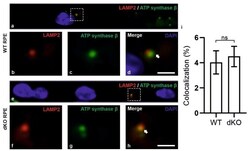
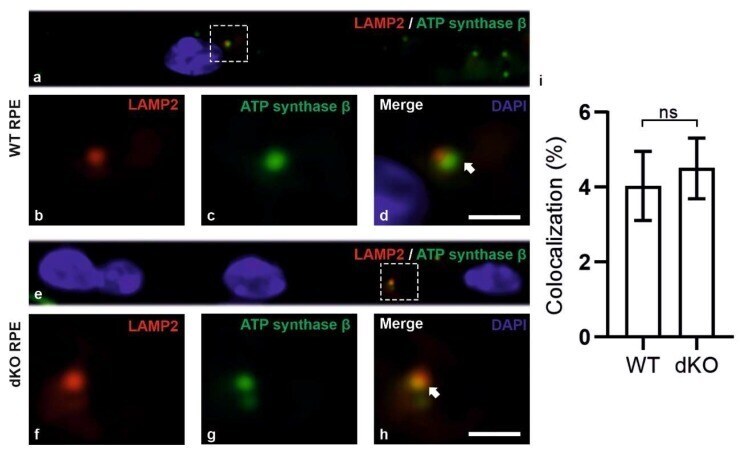
- Figure 6 Confocal microscopy analysis of lysosomal marker LAMP2 and mitochondrial marker ATP synthase beta in WT and dKO RPE cells ( a , e ). The colocalization of LAMP2 ( b , f ) and ATP synthase beta ( c , g ) shows the amount of autolysosome formation. Image analysis showed no significant changes in LAMP2 and ATP synthase beta colocalization in dKO animals compared to WT ( d , h , i ). Scale = 5 um. p = 0.70. ns-Nonsignificant.
- Submitted by
- Invitrogen Antibodies (provider)
- Main image
- Experimental details
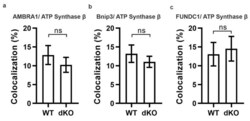
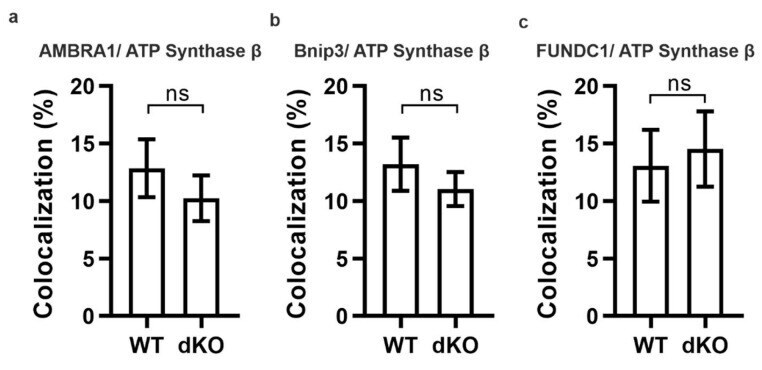
- Figure A1 Representative graphical data from double-staining of AMBRA1 ( a , p = 0.4), Bnip3 ( b , p = 0.4) and FUNDC1 ( c , p = 0.7) with ATP synthase beta. There was no statistically significant difference in the colocalization analysis between one-year-old WT and dKO. ns-Nonsignificant.
- Submitted by
- Invitrogen Antibodies (provider)
- Main image

- Experimental details
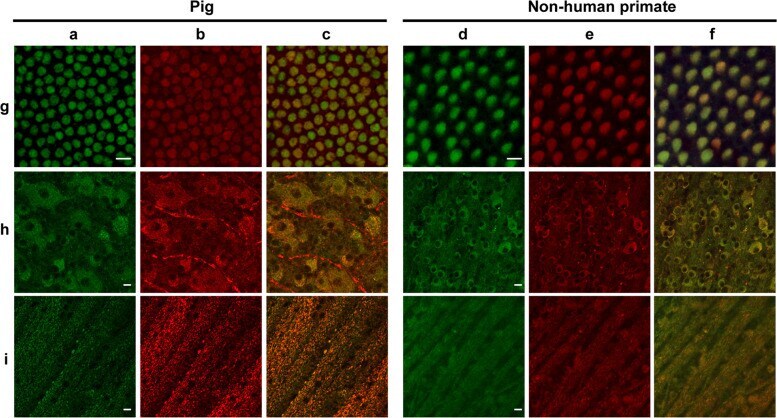
- Fig. 6 Autofluorescence and mitochondrial colocalization on the flat-mounted retina from pig and nonhuman primate ( Macaca fascicularis ). Autofluorescence ( a , d ) and mitochondrial ATP-synthase immunolabelling ( b , e ) with the merged images ( c , f ) in cone inner segments ( g ), ganglion cell layer ( h ), and optic fiber layer ( i ) showing co-localization except for the unspecific red labeling of blood vessels in the pig ganglion layer ( h ). Scale bars represent 10 um.
- Submitted by
- Invitrogen Antibodies (provider)
- Main image
- Experimental details
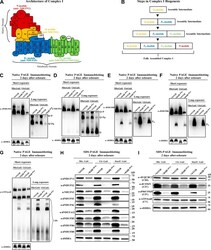
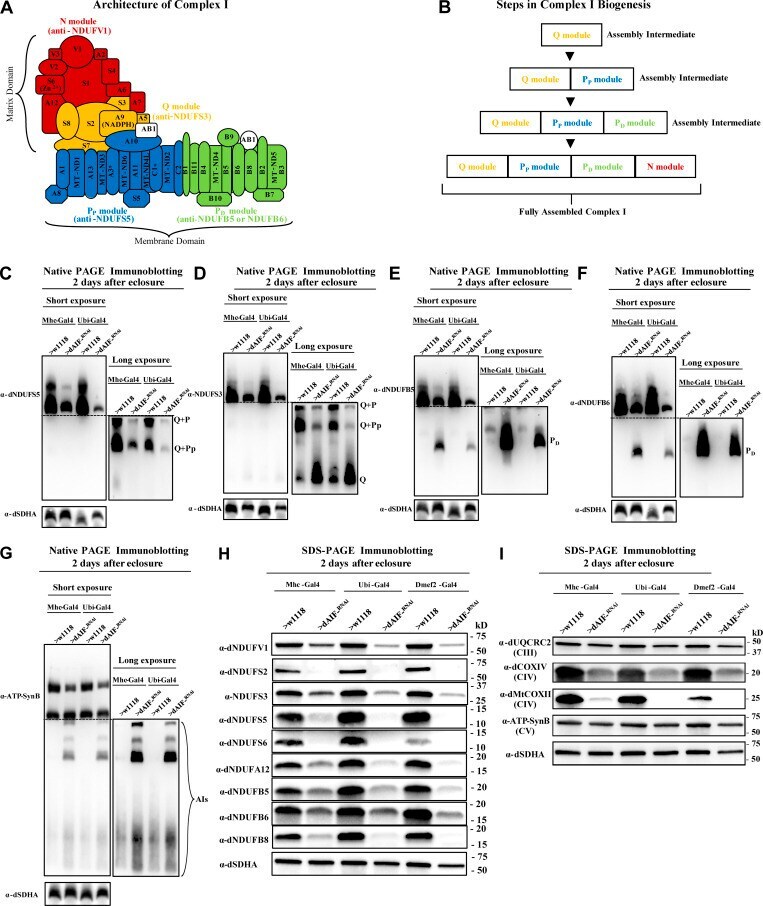
- Figure 4. The biogenesis of several AIs containing nuclear-encoded subunits is stalled when dAIF is disrupted. (A) A representation of mammalian CI showing the approximate relative positions of the 45 subunits. The first four letters of the nuclear-encoded subunit names have been eliminated for simplicity. The N, Q, P P , and P D modules are color-coded in red, orange, blue, and green, respectively. The antibodies used to track the various modules are shown and color-coded accordingly. (B) A schematic depicting the step-wise assembly process of CI. AIs corresponding to the Q, P D , Q+P P , and Q+P P +P D (i.e., Q+P) modules can be tracked by immunoblotting. (C-G) Mitochondrial preparations from flight muscles isolated from adult flies with the genotypes shown were analyzed by BN-PAGE, followed by immunoblotting with the indicated antibodies. (H and I) Total cell lysates from flight muscles isolated from adult flies with the genotypes shown were analyzed by SDS-PAGE and immunoblotting with the CI antibodies indicated (H) and the CIII, CIV, and CV antibodies indicated (I).
- Submitted by
- Invitrogen Antibodies (provider)
- Main image
- Experimental details
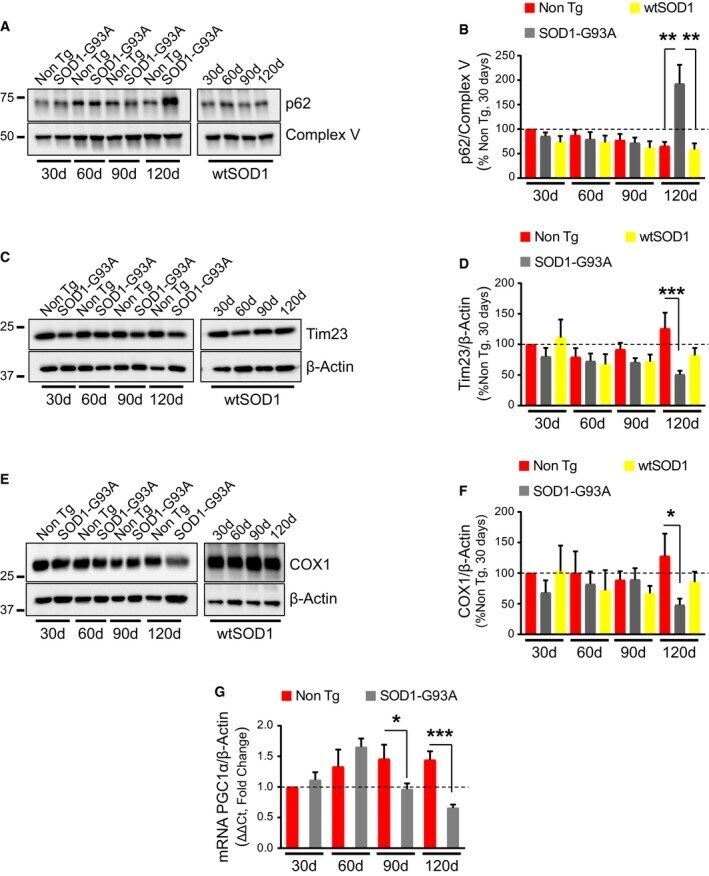
- Figure 1 MQC markers increase and mitochondrial content decreases in spinal cord of symptomatic SOD 1-G93A mice A, B Representative Western blot (A) and quantification (B) of p62 associated with mitochondria from spinal cords. Protein levels are normalized by subunit ATPase beta of mitochondria (Complex V). Mitochondrial p62 levels are increased at 120 days (symptomatic stage) in SOD1-G93A spinal cord relative to Non Tg and wild-type SOD1 (wtSOD1). Results are expressed as mean +- SEM relative to Non Tg at 30 days; n = 8 mice (four males and four females). At 120 days, ** P = 0.0018 (Non Tg vs. SOD1-G93A) and ** P = 0.0011 (SOD1-G93A vs. wtSOD1) by paired one-way ANOVA with Tukey's correction. No other statistically significant differences were found (paired Friedman's test with Dunn's correction at 30 days and paired one-way ANOVA with Tukey's correction at 60 and 90 days). C, D Representative Western blot (C) and quantification (D) of Tim23 in homogenates from spinal cords using beta-actin as normalizer. Results are expressed as mean +- SEM and relative to Non Tg at 30 days; n = 6 mice (three males and three females). *** P = 0.0002 (Non Tg vs. SOD1-G93A at 120 days) by paired one-way ANOVA with Tukey's correction. No other statistically significant differences were found (paired Friedman's test with Dunn's correction at 30 days and paired one-way ANOVA with Tukey's correction at 60 and 90 days). Tim23 is decreased in SOD1-G93A spinal cord relative to Non Tg
- Submitted by
- Invitrogen Antibodies (provider)
- Main image
- Experimental details
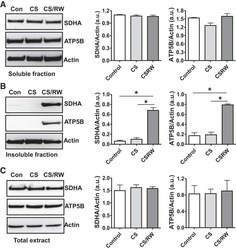
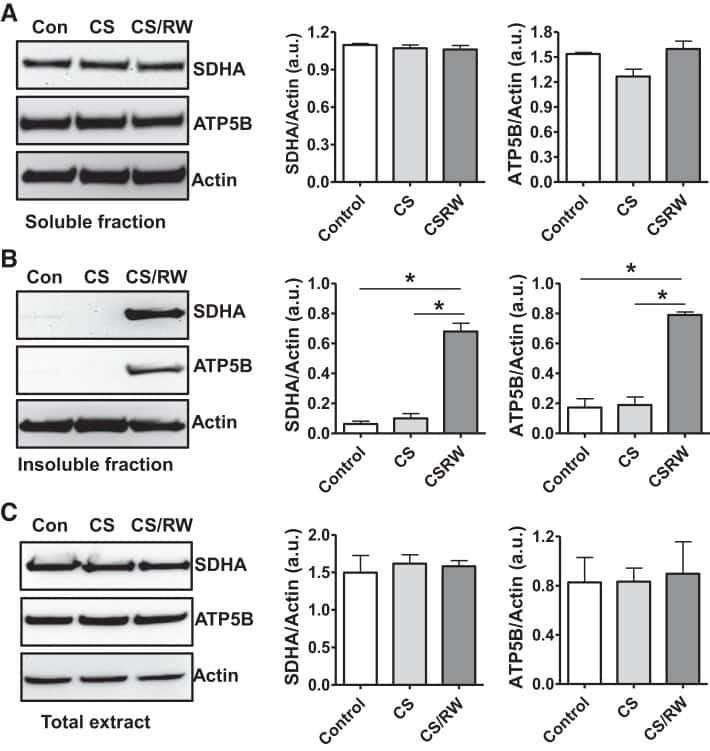
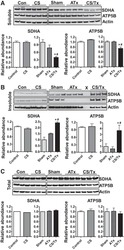
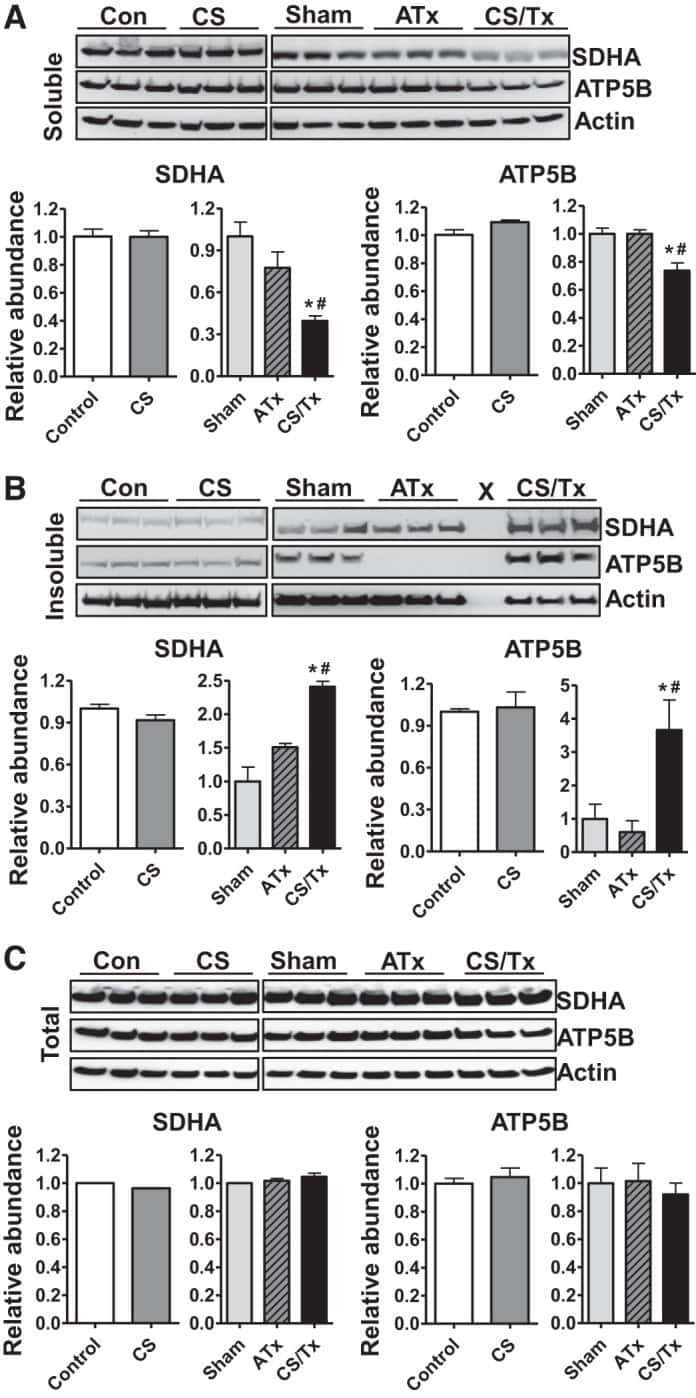
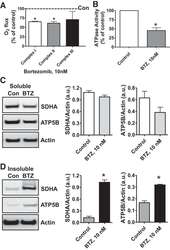
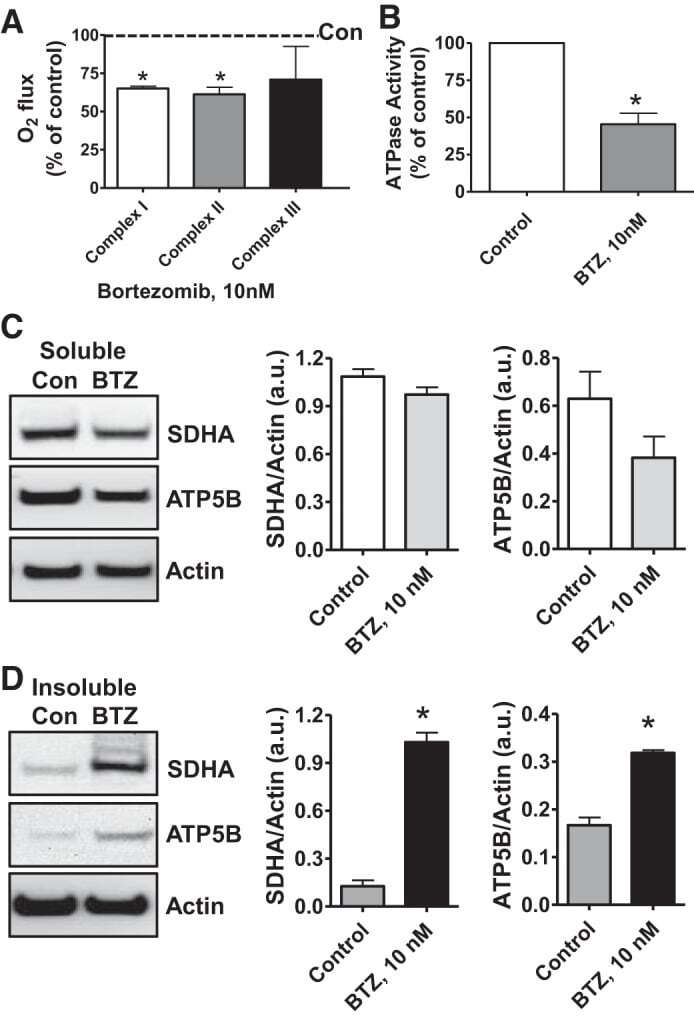
- Fig. 6. Proteasome inhibition decreases mitochondrial respiration and impairs mitochondrial respiratory complex protein homeostasis in NRK cells. A : digitonin-permeabilized NRK cells (5 x 10 6 ) were treated with vehicle control (DMSO) or the ChT-L proteasome inhibitor bortezomib (BTZ; 10 nM) for 24 h. High-resolution respirometry was used to determine oxygen flux through complexes I, II, and III. Values are expressed as % of control of 4 independent experiments. Differences between groups were compared with an unpaired Student's t- test. *Means are significantly different ( P < 0.05) compared with control. B : ATPase activity of ATP synthase (complex V) was assayed in NRK cells treated with DMSO (vehicle control) or BTZ for 24 h. Renal cell extracts (10 mug) with or without oligomycin (20 muM) were incubated with the enzyme mix in the presence of ATP and NADPH (MitoCheck Complex V Activity Assay kit, Cayman). NADH oxidation rate was monitored at 340 nm for up to 30 min with a BioTek Gen5 microplate reader. Bar graph shows oligomycin-inhibitable ATPase activity expressed as % of control ( n = 3). Differences between groups were compared with a Student's t -test. *Means are significantly different ( P < 0.001). C and D : Western blots of SDHA and ATP5B in soluble ( C ) and insoluble fractions ( D ) of NRK cell extracts after treatment with vehicle control (Con; DMSO) or BTZ (10 nM) for 24 h. Representative blots of 4 independent experiments are shown
- Submitted by
- Invitrogen Antibodies (provider)
- Main image
- Experimental details
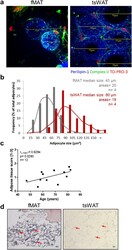
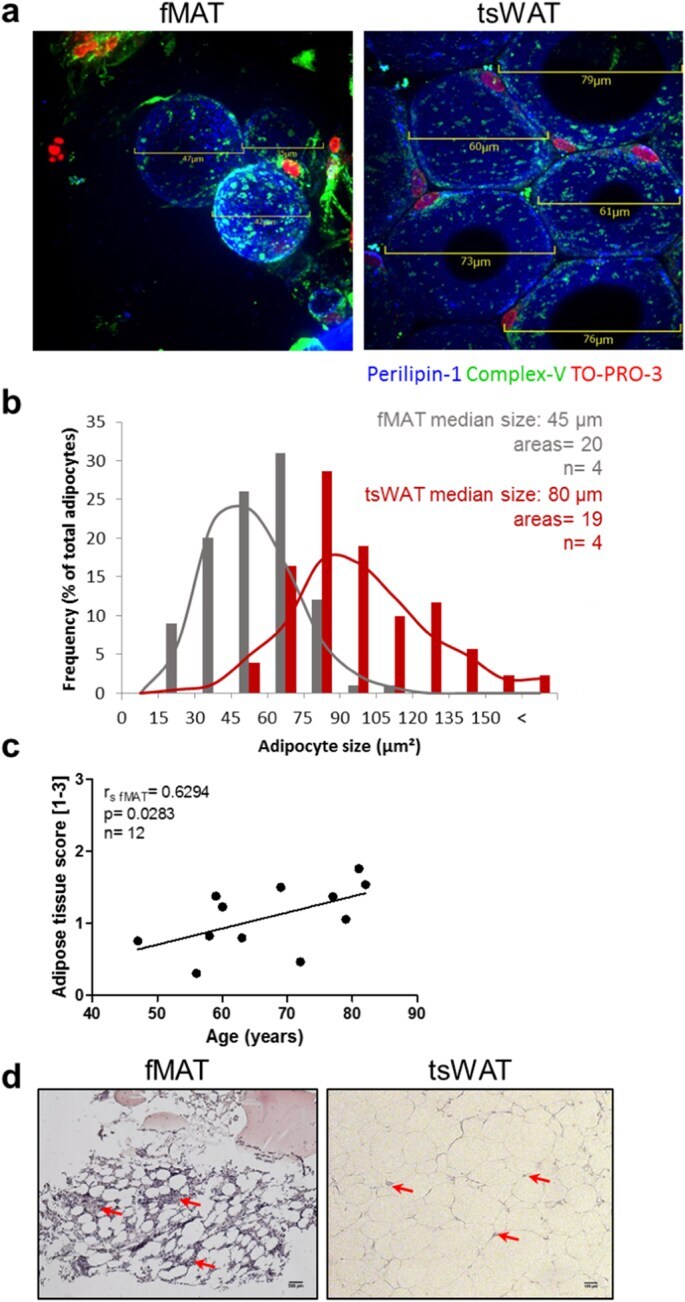
- Fig. 1 Comparison of human MAT of the femur (fMAT) with sWAT of the thighs (tsWAT). (a) and (b) Adipocyte size is smaller in fMAT than in tsWAT. (a) Representative merged IF images of whole mount stainings showing adipocytes labelled with perilipin-1 (blue). Nuclei were stained with To-Pro3 (red). Green fluorescence shows active mitochondria stained with ATP synthase beta (ComplexV). Scale bars indicate the size of fMAT (left) and tsWAT (right) adipocytes. (b) Frequency of fMAT (gray) and tsWAT (red) adipocyte size of different donors using indicated scale bars of IF images. Adipocyte median size, number of areas and sample size (n) are indicated in the graph. Samples of four donors pooled from at least three independent experiments. (c) Human fMAT increases with age. Quantitative calculated adipose tissue score [arbitrary units 1-3] of fMAT is plotted against donor age. Each dot point represents one individual. Spearman coefficient (r fMAT ), p value and sample size (n) are indicated in the graph. (d) Representative H&E stains of fMAT (left panel) and tsWAT (right panel) are shown. Red arrows indicate infiltrating cells within the tissues. Scale bars indicate 200 mum for fMAT and 100 mum for tsWAT. (For interpretation of the references to colour in this figure legend, the reader is referred to the web version of this article.) Fig. 1
- Submitted by
- Invitrogen Antibodies (provider)
- Main image
- Experimental details
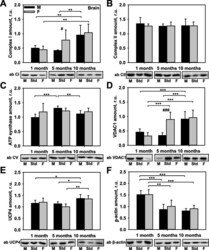
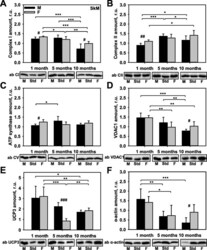
- Fig. 1 Comparison of protein expression in the brain tissues of female and male mice. Quantitative analysis of western blot (WB) images obtained from 1, 5, and 10-month-old female (F) and male (M) mice showing the relative amounts of Complex I ( a ), Complex II ( b ), ATP synthase ( c ), VDAC1 ( d ), UCP4 ( e ), and beta-actin ( f ) as compared to a brain tissue standard (Std). Representative WB images are shown below the plots. 20 mug of total protein were loaded in each lane. Values represent the means +- SD of data obtained from six animals per group; * p < 0.05, ** p < 0.01, and *** p < 0.001 (mark age differences); # p < 0.05, ## p < 0.01, and ### p < 0.001 (mark sex differences)

- Submitted by
- Invitrogen Antibodies (provider)
- Main image

- Experimental details
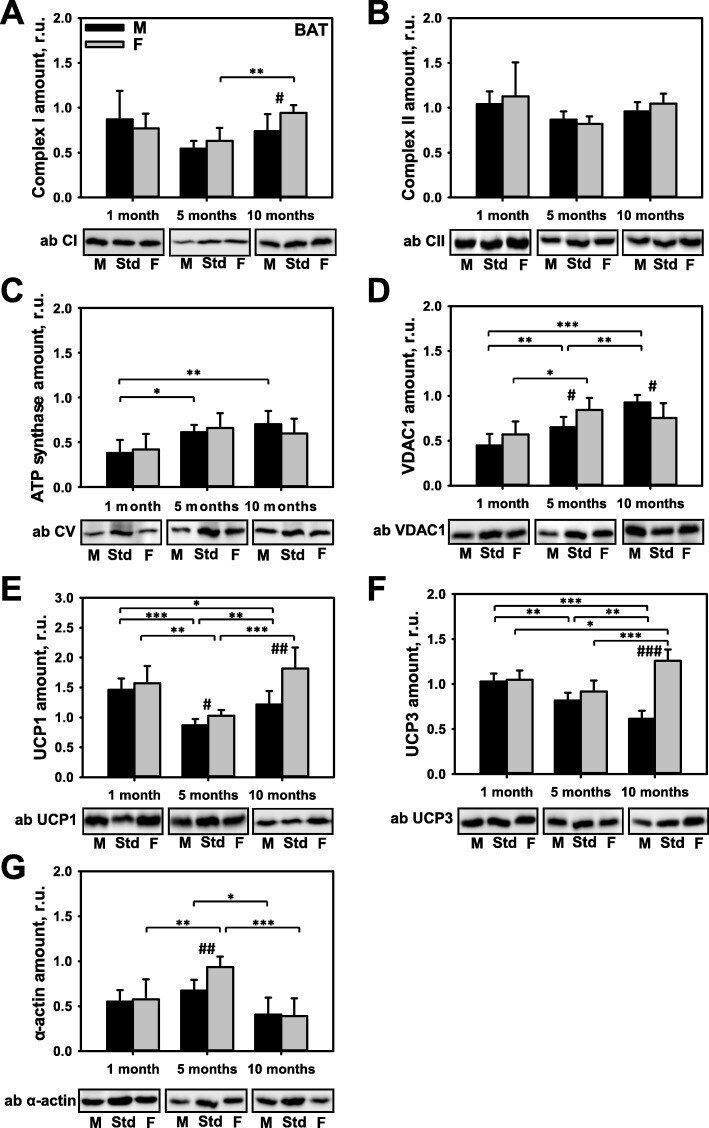
- Fig. 2 Comparison of protein expression in brown adipose tissue (BAT) from female and male mice. A quantitative analysis of western blot (WB) images obtained from 1, 5, and 10-month old female (F) and male (M) mice showing the relative amounts of Complex I ( a ), Complex II ( b ), ATP synthase ( c ), VDAC1 ( d ), UCP1 ( e ), UCP3 ( f ), and alpha-actin ( g ) as compared to a BAT tissue standard (Std). Representative WB images are shown below the plots. 20 mug of total protein were loaded in each lane. Values represent the means +- SD of data obtained from six animals per group; * p < 0.05, ** p < 0.01, and *** p < 0.001 (mark age differences); # p < 0.05, ## p < 0.01, and ### p < 0.001 (mark sex differences)
- Submitted by
- Invitrogen Antibodies (provider)
- Main image
- Experimental details
- Fig. 3 Comparison of protein expression in skeletal muscle (SkM) from female and male mice. A quantitative analysis of western blot (WB) images obtained from 1, 5, and 10-month old female (F) and male (M) mice showing the relative amounts of Complex I ( a ), Complex II ( b ), ATP synthase ( c ), VDAC1 ( d ), UCP3 ( e ), and alpha-actin ( f ) as compared to a SkM tissue standard (Std). Representative WB images are shown below the plots. 50 mug of total protein was loaded in each lane. Values represent the means +- SD of data obtained from six animals per group; * p < 0.05, ** p < 0.01, and *** p < 0.001 (mark age differences); # p < 0.05, ## p < 0.01, and ### p < 0.001 (mark sex differences)

- Submitted by
- Invitrogen Antibodies (provider)
- Main image
- Experimental details
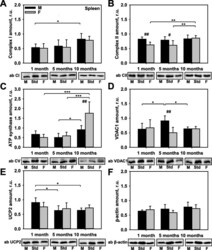
- Fig. 4 Comparison of protein expression in spleen tissue from female and male mice. A quantitative analysis of western blot (WB) images obtained from 1, 5, and 10-month old female (F) and male (M) mice showing the relative amounts of Complex I ( a ), Complex II ( b ), ATP synthase ( c ), VDAC1 ( d ), UCP2 ( e ), and beta-actin ( f ) as compared to a spleen tissue standard (Std). Representative WB images are shown below the plots. 50 mug of total protein was loaded in each lane. Values represent the means +- SD of data obtained from six animals per group; * p < 0.05, ** p < 0.01, and *** p < 0.001 (mark age differences); # p < 0.05, ## p < 0.01, and ### p < 0.001 (mark sex differences)

- Submitted by
- Invitrogen Antibodies (provider)
- Main image
- Experimental details
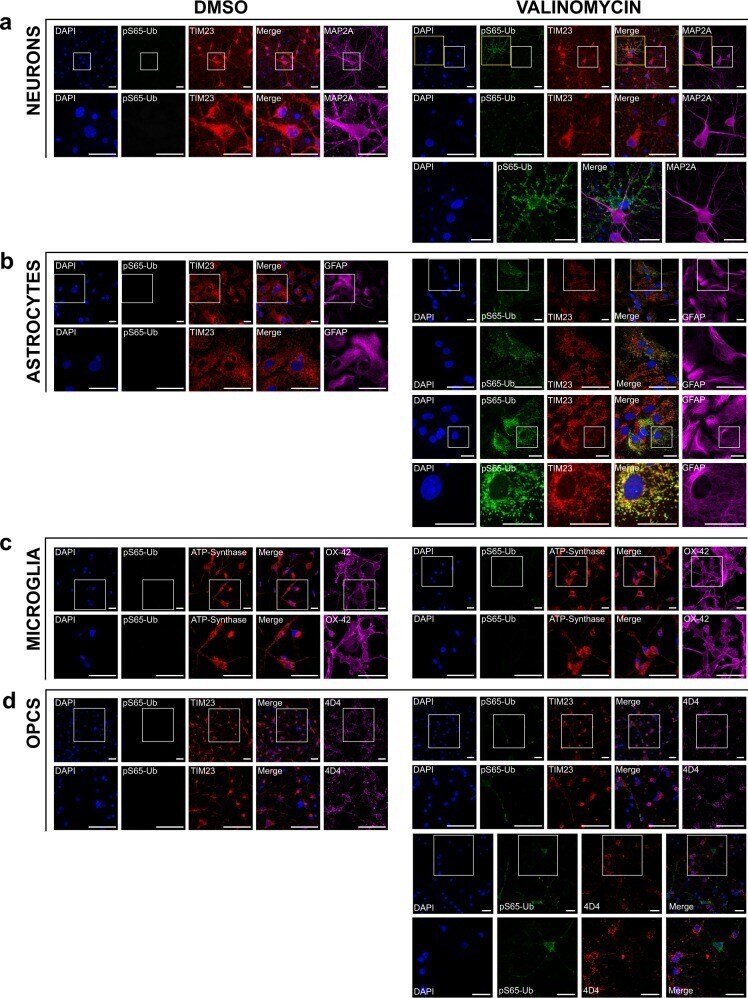
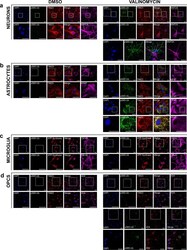
- Fig. 2 Immunofluorescence of primary neurons, astrocytes, microglia, and OPCs derived from WT rats. Cultured cells were treated with 100 nM valinomycin or DMSO control for 4 h at 37 degC, then fixed and analyzed by immunofluorescence with the indicated antibodies. Cells were also stained with DAPI to show cell nuclei. White boxes indicate areas shown at higher magnification immediately below. Each channel is shown individually as well as an image of the DAPI, pS65-Ub, and mitochondrial marker channels merged, as indicated. a Primary cortical neurons treated with DMSO control (left) or with valinomycin (right). Higher-magnification images of the areas indicated by yellow boxes are shown at bottom to clarify the non-overlapping pS65-Ub immunofluorescence with the neuronal marker MAP2A. b Primary cortical astrocytes treated with DMSO control or with valinomycin. A second panel of higher-magnification images of cortical astrocytes treated with valinomycin is included to allow better visualization of the colocalization of pS65-Ub with the mitochondrial marker TIM23 in astrocytes. c Primary cortical microglia treated with DMSO control or with valinomycin. The mitochondrial marker ATP-Synthase was substituted for TIM23 because the microglial marker OX-42 antibody is the same species and isotype as anti-TIM23. d Primary cortical OPCs treated with DMSO control or with valinomycin. Additional higher-magnification images of cortical OPCs treated with valinomycin are shown below to bette