 Explore
 Validate
 Learn
Learn Western blot
Antibody data
- Antibody Data
- Antigen structure
- References [1]
- Comments [0]
- Validations
- Western blot [1]
- Immunohistochemistry [1]
- Other assay [1]
Submit
Validation data
Reference
Comment
Report error
- Product number
- PA5-40596 - Provider product page

- Provider
- Invitrogen Antibodies
- Product name
- MAD4 Polyclonal Antibody
- Antibody type
- Polyclonal
- Antigen
- Synthetic peptide
- Description
- Peptide sequence: SLLILLEAAE YLERRDREAE HGYASVLPFD GDFAREKTKA AGLVRKAPNN Sequence homology: Cow: 93%; Dog: 93%; Guinea Pig: 93%; Human: 100%; Mouse: 86%; Rabbit: 93%; Sheep: 93%
- Reactivity
- Human
- Host
- Rabbit
- Isotype
- IgG
- Vial size
- 100 μL
- Concentration
- 0.5 mg/mL
- Storage
- -20°C, Avoid Freeze/Thaw Cycles
Submitted references Genomic deregulation of PRMT5 supports growth and stress tolerance in chronic lymphocytic leukemia.
Schnormeier AK, Pommerenke C, Kaufmann M, Drexler HG, Koeppel M
Scientific reports 2020 Jun 17;10(1):9775
Scientific reports 2020 Jun 17;10(1):9775
No comments: Submit comment
Supportive validation
- Submitted by
- Invitrogen Antibodies (provider)
- Main image
- Experimental details
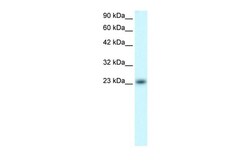
- Western blot analysis of human Jurkat cell lysate using an anti-MAD4 polyclonal antibody (Product # PA5-40596).

Supportive validation
- Submitted by
- Invitrogen Antibodies (provider)
- Main image
- Experimental details
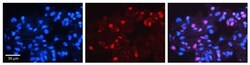
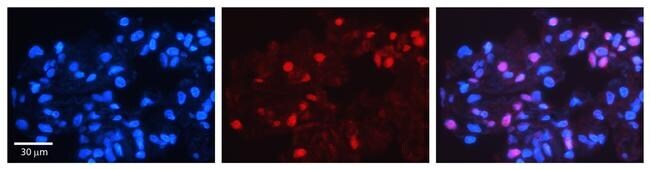
- Immunohistochemistry (paraffin-embedded) analysis of human lung tissue using an anti-MAD4 polyclonal antibody (Product # PA5-40596).; Secondary Antibody: Donkey anti-Rabbit-Cy3.
Supportive validation
- Submitted by
- Invitrogen Antibodies (provider)
- Main image
- Experimental details
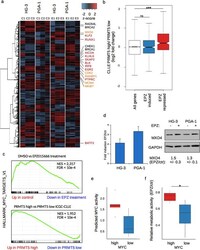
- Figure 2 PRMT5 supports growth promoting pathways in vitro and in vivo . ( a ) Heatmap showing up- and downregulated genes of three replicates of RNA-seq per cell line, calculated by DESeq. 2 (padj < 0.05, logFC > |0.6|). C1-3 represent untreated control replicates, E1-3 those treated with 10 uM EPZ015666 for 96 h. Highlighted are genes involved in B cell and lymphocyte specific pathways (red), cell cycle progression (orange) and checkpoint control (black). b) Correlation between transcriptional changes of EPZ015666 treated cells and donors from the CLLE cohort. Boxplot depicts log2 fold change in expression between PRMT5 high versus PRMT5 low donors, for all genes (white), genes induced (blue) or repressed (red) upon EPZ015666-treatment, respectively. Statistical testing by Mann-Whitney-U test (***p < 10 -12 ). ( c ) GSEA for control versus EPZ015666 treated HG-3 and PGA-1 cells (upper panel) and for PRMT5 high versus PRMT5 low CLL donors (lower panel) shows a downregulation of hallmark MYC target V1 gene set. ( d ) Upregulation of MXD4 upon treatment of HG-3 and PGA-1 cells with EPZ015666, shown at the mRNA-level (left) and protein (right), GAPDH served as loading control. Below the blot the median fold change of treated over control of protein abundance was calculated including the SD from three independent experiments. ( e ) Boxplot shows the transcriptional activity of MYC in the MYC high and MYC low cell line groups, estimated via DoRothEA v2. ( f ) Metabolic activity u
