 Explore
 Validate
 Learn
LearnPA5-29138
antibody from Invitrogen Antibodies
Targeting: YY1
DELTA, INO80S, NF-E1, UCRBP, YIN-YANG-1
 Western blot
Antibody data
- Antibody Data
- Antigen structure
- References [1]
- Comments [0]
- Validations
- Western blot [1]
- Other assay [4]
Submit
Validation data
Reference
Comment
Report error
- Product number
- PA5-29138 - Provider product page

- Provider
- Invitrogen Antibodies
- Product name
- YY1 Polyclonal Antibody
- Antibody type
- Polyclonal
- Antigen
- Recombinant protein fragment
- Description
- Recommended positive controls: 293T.
- Concentration
- 0.88 mg/mL
Submitted references CircRNA circYY1 (hsa_circ_0101187) Modulates Cell Glycolysis and Malignancy Through Regulating YY1 Expression by Sponging miR-769-3p in Breast Cancer.
Zhang X, Li J, Feng Q
Cancer management and research 2021;13:1145-1158
Cancer management and research 2021;13:1145-1158
No comments: Submit comment
Supportive validation
- Submitted by
- Invitrogen Antibodies (provider)
- Main image

- Experimental details
- YY1 Polyclonal Antibody detects YY1 protein by Western blot analysis. A. 30 µg 293T whole cell lysate/extract.10 % SDS-PAGE. YY1 Polyclonal Antibody (Product # PA5-29138) dilution: 1:1,000.

Supportive validation
- Submitted by
- Invitrogen Antibodies (provider)
- Main image

- Experimental details
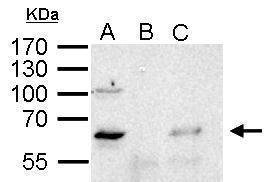
- YY1 Polyclonal Antibody immunoprecipitates YY1 protein in IP experiments. IP Sample: 1,000 µg HeLa whole cell lysate/extract A. 50 µg HeLa whole cell lysate/extract B. Control with 2 µg of preimmune rabbit IgG C. Immunoprecipitation of YY1protein by 2 µg of YY1 Polyclonal Antibody (Product # PA5-29138) 10% SDS-PAGE The immunoprecipitated YY1 protein was detected by YY1 Polyclonal Antibody diluted at 1:1,000.
- Submitted by
- Invitrogen Antibodies (provider)
- Main image

- Experimental details
- Figure 5 YY1 served as a target for miR-769-3p in BC cells. ( A and B ) QRT-PCR and Western blotting were carried out to analyze the expression of YY1 mRNA and protein in BC tissues and neighboring normal tissues. ( C and D ) Correlation of YY1 mRNA and circYY1 or miR-769-3p expression in BC tissues was assessed by Pearson's correlation analysis. ( E ) Prediction of the binding sites between miR-769-3p and YY1 by the TargetScan database. ( F ) Relative luciferase activities were investigated in BT549 and MDA-MB-231 cells co-transfected with miR-769-3p mimic or miR-NC and YY1-3'UTR-WT luciferase reporter or YY1-3'UTR-MUT luciferase reporter. ( G ) RNA pull-down assay revealed the enrichment of YY1 mRNA in the miR-769-3p probe group and Oligo probe group. ( H ) Western blotting showed the protein level of YY1 in BT549 and MDA-MB-231 cells transfected with miR-769-3p mimic or miR-NC. ( I ) Western blotting revealed the level of YY1 protein in BC cells. ** P < 0.01 and *** P < 0.001.

- Submitted by
- Invitrogen Antibodies (provider)
- Main image

- Experimental details
- Figure 6 The circYY1/miR-769-3p/YY1 axis regulated the malignancy and glycolysis of BC cells. ( A ) QRT-PCR analysis of miR-769-3p expression in BT549 and MDA-MB-231 cells transfected with anti-miR-769-3p or anti-NC. ( B ) Western blotting analysis of YY1 protein level in BT549 and MDA-MB-231 cells transfected with si-NC, si-circYY1#1, or si-circYY1#1+anti-miR-769-3p. ( C ) The protein level of YY1 in BT549 and MDA-MB-231 cells transfected with vector or YY1 was analyzed with Western blotting. ( D - K ) BT549 and MDA-MB-231 cells were transfected with si-NC, si-circYY1#1, si-circYY1#1+anti-miR-769-3p, or si-circYY1#1+YY1. ( D - G ) The viability, colony formation, migration, and invasion of BT549 and MDA-MB-231 cells were determined by MTT assay ( D ), colony formation assay ( E ), or transwell assay ( F and G ). ( H - J ) The levels of glucose uptake, lactate production, and ATP release in BT549 and MDA-MB-231 cells were analyzed with a matching kit. ( K ) Assessment of HK2 and LDHA protein levels in BT549 and MDA-MB-231 cells by Western blotting. ** P < 0.01 and *** P < 0.001.

- Submitted by
- Invitrogen Antibodies (provider)
- Main image

- Experimental details
- Figure 7 CircYY1 contributed to BC growth in vivo. ( A ) Tumor volumes in mice were measured every 7 days. ( B ) Tumor weight was measured 35 days after injection with BT549 cells carrying sh-circYY1 or sh-NC. ( C ) QRT-PCR analysis of circYY1 and miR-769-3p expression in mice tumor tissues in the sh-circYY1 group and sh-NC group. ( D ) Western blotting analysis of YY1, PCNA, HK2, and LDHA protein levels in mice tumor tissues in the sh-circYY1 group and sh-NC group. ** P < 0.01 and *** P < 0.001.
