Explore
 Validate
 Learn
LearnPA5-29171
antibody from Invitrogen Antibodies
Targeting: YY1
DELTA, INO80S, NF-E1, UCRBP, YIN-YANG-1
 Western blot
 Immunocytochemistry
Antibody data
- Antibody Data
- Antigen structure
- References [1]
- Comments [0]
- Validations
- Immunocytochemistry [4]
- Immunohistochemistry [2]
- Chromatin Immunoprecipitation [2]
- Other assay [1]
Submit
Validation data
Reference
Comment
Report error
- Product number
- PA5-29171 - Provider product page

- Provider
- Invitrogen Antibodies
- Product name
- YY1 Polyclonal Antibody
- Antibody type
- Polyclonal
- Antigen
- Recombinant full-length protein
- Description
- Recommended positive controls: A431, NIH-3T3, PC-12, Rat2. Predicted reactivity: Mouse (100%), Rat (100%), Xenopus laevis (98%), Chicken (98%), Bovine (100%). Store product as a concentrated solution. Centrifuge briefly prior to opening the vial.
- Reactivity
- Human, Mouse, Rat
- Host
- Rabbit
- Isotype
- IgG
- Vial size
- 100 μL
- Concentration
- 1.14 mg/mL
- Storage
- Store at 4°C short term. For long term storage, store at -20°C, avoiding freeze/thaw cycles.
Submitted references Upregulation of Yy1 Suppresses Dilated Cardiomyopathy caused by Ttn insufficiency.
Liao D, Chen W, Tan CY, Wong JX, Chan PS, Tan LW, Foo R, Jiang J
Scientific reports 2019 Nov 8;9(1):16330
Scientific reports 2019 Nov 8;9(1):16330
No comments: Submit comment
Supportive validation
- Submitted by
- Invitrogen Antibodies (provider)
- Main image
- Experimental details
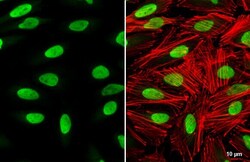
- YY1 Polyclonal Antibody detects YY1 protein at nucleus by immunofluorescent analysis. Sample: HeLa cells were fixed in 4% paraformaldehyde at RT for 15 min. Green: YY1 stained by YY1 Polyclonal Antibody (Product # PA5-29171) diluted at 1:1,000. Red: phalloidin, a cytoskeleton marker, diluted at 1:200. Scale bar= 10 µm.

- Submitted by
- Invitrogen Antibodies (provider)
- Main image

- Experimental details
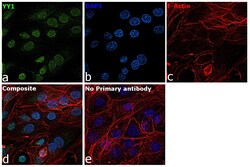
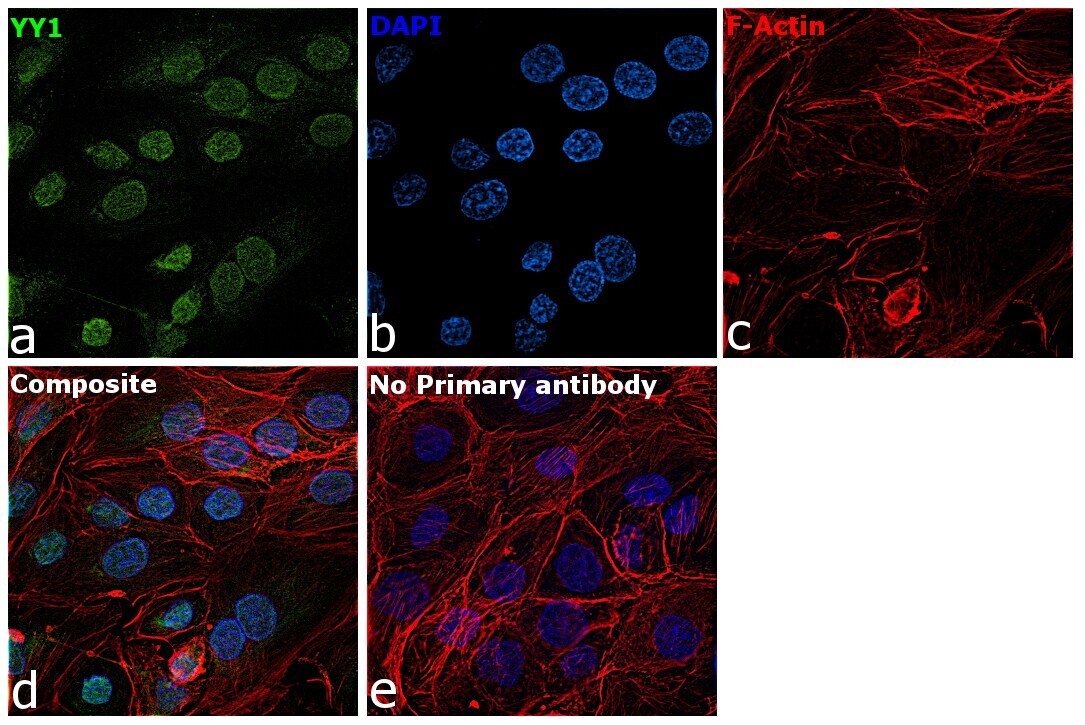
- Immunofluorescence analysis of YY1 was performed using DU 145 cells. The cells were fixed with 4% paraformaldehyde for 10 minutes, permeabilized with 0.1% Triton™ X-100 for 15 minutes, and blocked with 2% BSA for 1 hour at room temperature. The cells were labeled with YY1 Rabbit Polyclonal Antibody (Product # PA5-29171) at 1:100 dilution in 0.1% BSA and incubated overnight at 4 degree and then labeled with Goat anti-Rabbit IgG (H+L) Highly Cross-Adsorbed Secondary Antibody, Alexa Fluor Plus 488 (Product # A32731) at a dilution of 1:2000 for 45 minutes at room temperature (Panel a: green). Nuclei (Panel b: blue) were stained with ProLong™ Diamond Antifade Mountant with DAPI (Product # P36962). F-actin (Panel c: red) was stained with Rhodamine Phalloidin (Product # R415, 1:300). Panel d represents the composite image showing nuclear localization of YY1. Panel e represents control cells with no primary antibody to assess background. The images were captured at 60X magnification.

- Submitted by
- Invitrogen Antibodies (provider)
- Main image

- Experimental details
- YY1 Polyclonal Antibody detects YY1 protein at nucleus by immunofluorescent analysis. Sample: HeLa cells were fixed in 4% paraformaldehyde at RT for 15 min. Green: YY1 stained by YY1 Polyclonal Antibody (Product # PA5-29171) diluted at 1:1,000. Red: phalloidin, a cytoskeleton marker, diluted at 1:200. Scale bar= 10 µm.

- Submitted by
- Invitrogen Antibodies (provider)
- Main image
- Experimental details
- Immunofluorescence analysis of YY1 was performed using DU 145 cells. The cells were fixed with 4% paraformaldehyde for 10 minutes, permeabilized with 0.1% Triton™ X-100 for 15 minutes, and blocked with 2% BSA for 1 hour at room temperature. The cells were labeled with YY1 Rabbit Polyclonal Antibody (Product # PA5-29171) at 1:100 dilution in 0.1% BSA and incubated overnight at 4 degree and then labeled with Goat anti-Rabbit IgG (H+L) Highly Cross-Adsorbed Secondary Antibody, Alexa Fluor Plus 488 (Product # A32731) at a dilution of 1:2000 for 45 minutes at room temperature (Panel a: green). Nuclei (Panel b: blue) were stained with ProLong™ Diamond Antifade Mountant with DAPI (Product # P36962). F-actin (Panel c: red) was stained with Rhodamine Phalloidin (Product # R415, 1:300). Panel d represents the composite image showing nuclear localization of YY1. Panel e represents control cells with no primary antibody to assess background. The images were captured at 60X magnification.
Supportive validation
- Submitted by
- Invitrogen Antibodies (provider)
- Main image
- Experimental details
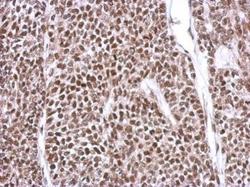
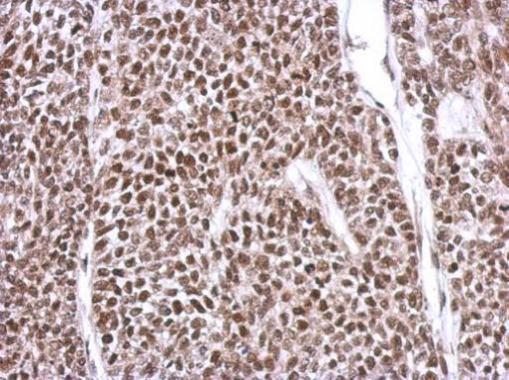
- Immunohistochemical analysis of paraffin-embedded 59T xenograft, using YY1 (Product # PA5-29171) antibody at 1:500 dilution. Antigen Retrieval: EDTA based buffer, pH 8.0, 15 min.
- Submitted by
- Invitrogen Antibodies (provider)
- Main image
- Experimental details
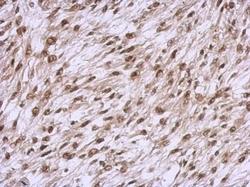
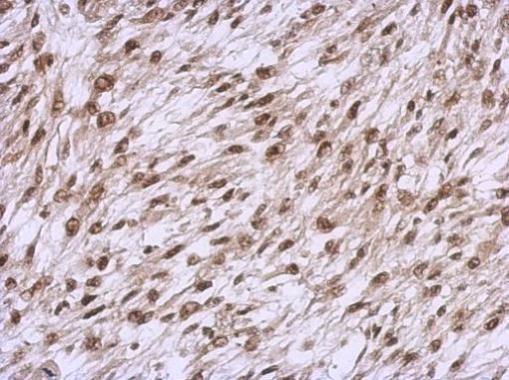
- Immunohistochemical analysis of paraffin-embedded C2C12 xenograft, using YY1 (Product # PA5-29171) antibody at 1:500 dilution. Antigen Retrieval: EDTA based buffer, pH 8.0, 15 min.
Supportive validation
- Submitted by
- Invitrogen Antibodies (provider)
- Main image

- Experimental details
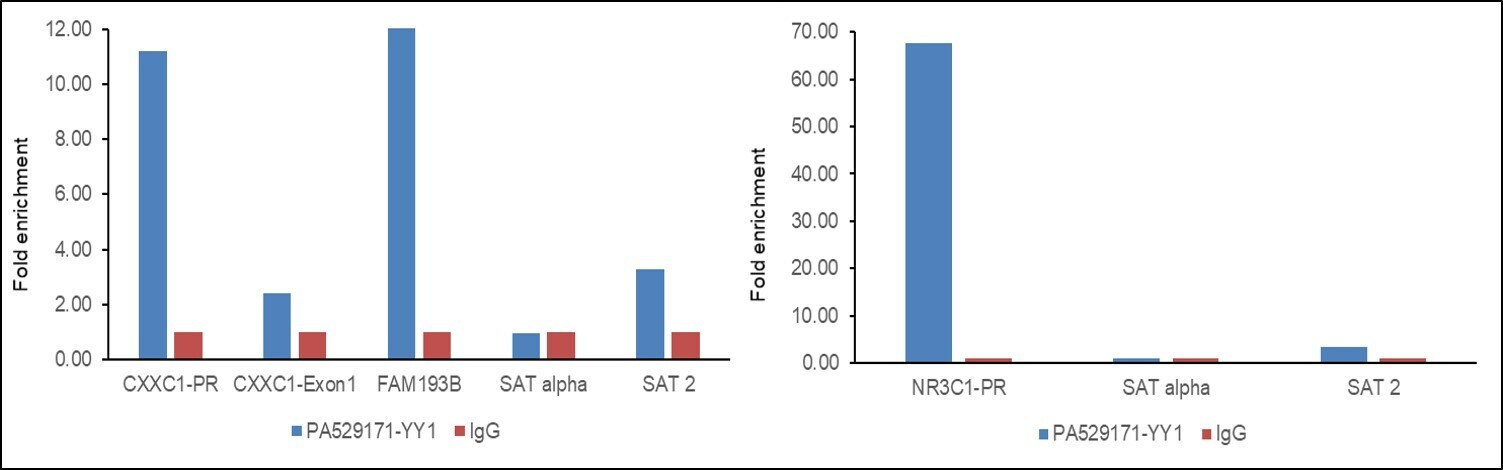
- Chromatin Immunoprecipitation (ChIP) assay of endogenous YY1 protein using YY1 Antibody: ChIP was performed using YY1 Polyclonal Antibody (Product # PA5-29171, 5 µg) on sheared chromatin from DU 145 cells using the MAGnify ChIP System kit (Product # 49-2024). Normal Rabbit IgG was used as a negative IP control. The purified DNA was analyzed by qPCR using primers binding to CXXC1-Promoter, CXXC1- Exon1, FAM193B and NR3C1- Promoter (active) and SAT alpha and SAT2 satellite repeats (Inactive). Data is presented as fold enrichment of the antibody signal versus the negative control IgG using the comparative CT method.
- Submitted by
- Invitrogen Antibodies (provider)
- Main image
- Experimental details
- Chromatin Immunoprecipitation (ChIP) assay of endogenous YY1 protein using YY1 Antibody: ChIP was performed using YY1 Polyclonal Antibody (Product # PA5-29171, 5 µg) on sheared chromatin from DU 145 cells using the MAGnify ChIP System kit (Product # 49-2024). Normal Rabbit IgG was used as a negative IP control. The purified DNA was analyzed by qPCR using primers binding to CXXC1-Promoter, CXXC1- Exon1, FAM193B and NR3C1- Promoter (active) and SAT alpha and SAT2 satellite repeats (Inactive). Data is presented as fold enrichment of the antibody signal versus the negative control IgG using the comparative CT method.

Supportive validation
- Submitted by
- Invitrogen Antibodies (provider)
- Main image

- Experimental details
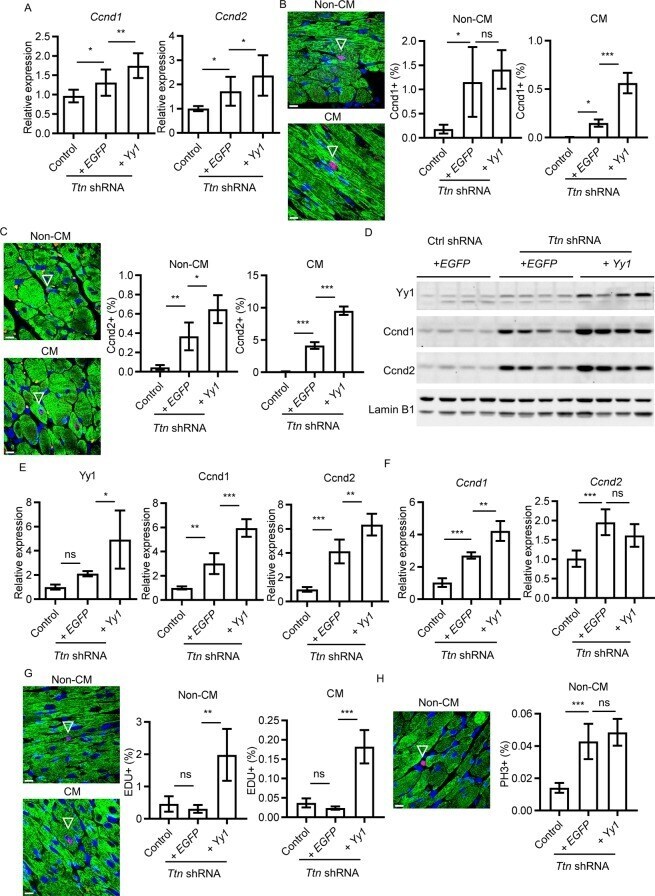
- Figure 4 Upregulation of Yy1 promotes cardiac cell cycle in dilated cardiomyopathy induced by Ttn shRNA. ( A ) Quantitative real-time PCR analysis of Ccnd1 and Ccnd2 expression in mouse heart tissue from control, Ttn shRNA and Yy1 treated groups. Virus does, 0.2E + 13 vg/kg. Mice were harvest four weeks after transduction. n >= 10. ( B ) Paraffin sections (left) stained with DAPI (blue), cTnI (green) and Ccnd1 (red), representing Non-CM and CM with positive Ccnd1 signal (arrowed); quantification of Ccnd1 + Non-CM and CM (right) from control, Ttn shRNA and Yy1 treated groups, n >= 4. ( C ) Paraffin section (left) and quantification (right) of Ccnd2 + in Non-CM and CM respectively, n >= 4. ( D ) Western blot and quantitative analysis ( E ) of Yy1, Ccnd1 and Ccnd2 protein levels in mouse heart tissue, n = 4. Data were normalized by Lamin B1 antibody. Full-length blots were presented in Supplementary Fig. S6 . ( F ) Quantitative real-time PCR analysis of Ccnd1 and Ccnd2 expression in isolated CM from control, Ttn shRNA and Yy1 treated groups four weeks after virus transduction, n >= 3. ( G ) Paraffin section (left) and quantification (right) of EdU + in Non-CM and CM respectively, n = 4. ( H ) Paraffin section (left) and quantification (right) of pH3 + in non-CM, n >= 4. In ( B ), ( C ), ( G ) and ( H ), magnification = 100x, scale bar = 10 um. Data were shown as mean +- SD and were normalized to total nucleus number labelled by DAPI.