Explore
 Validate
 Learn
LearnPA5-27882
antibody from Invitrogen Antibodies
Targeting: NFE2L2
NRF2
 Western blot
 Immunocytochemistry Immunoprecipitation Immunohistochemistry
 Flow cytometry Chromatin Immunoprecipitation Other assay
Antibody data
- Antibody Data
- Antigen structure
- References [18]
- Comments [0]
- Validations
- Immunocytochemistry [14]
- Immunohistochemistry [2]
- Chromatin Immunoprecipitation [3]
- Other assay [13]
Submit
Validation data
Reference
Comment
Report error
- Product number
- PA5-27882 - Provider product page

- Provider
- Invitrogen Antibodies
- Product name
- Nrf2 Polyclonal Antibody
- Antibody type
- Polyclonal
- Antigen
- Recombinant full-length protein
- Description
- Recommended positive controls: C8D30, 3xFlag-human NFE2L2-transfected 293T, MDA-MB-231 nuclear extract, MDA-MB-231 nuclear extract (30 µM tBHQ, 4hr), HepG2 (10 µM MG132 treatment for 15 hr). Predicted reactivity: Rhesus Monkey (99%), Bovine (84%). Store product as a concentrated solution. Centrifuge briefly prior to opening the vial.
- Reactivity
- Human, Mouse, Rat, Chicken/Avian, Zebrafish
- Host
- Rabbit
- Isotype
- IgG
- Vial size
- 100 μL
- Concentration
- 0.26 mg/mL
- Storage
- Store at 4°C short term. For long term storage, store at -20°C, avoiding freeze/thaw cycles.
Submitted references Preventive Effect of Limosilactobacillus fermentum SCHY34 on Lead Acetate-Induced Neurological Damage in SD Rats.
E3 ligase TRIM15 facilitates non-small cell lung cancer progression through mediating Keap1-Nrf2 signaling pathway.
Regulation of VEGFA, KRAS, and NFE2L2 Oncogenes by MicroRNAs in Head and Neck Cancer.
Astragaloside IV protects against ischemia/reperfusion (I/R)-induced kidney injury based on the Keap1-Nrf2/ARE signaling pathway.
P- Hydroxybenzyl Alcohol Alleviates Oxidative Stress in a Nonalcoholic Fatty Liver Disease Larval Zebrafish Model and a BRL-3A Hepatocyte Via the Nrf2 Pathway.
The Role of Nrf2 Transcription Factor and Sp1-Nrf2 Protein Complex in Glutamine Transporter SN1 Regulation in Mouse Cortical Astrocytes Exposed to Ammonia.
Ficus erecta Thunb Leaves Alleviate Memory Loss Induced by Scopolamine in Mice via Regulation of Oxidative Stress and Cholinergic System.
Sulforaphane Protects Piglet Brains from Neonatal Hypoxic-Ischemic Injury.
Polarization of Low-Grade Inflammatory Monocytes Through TRAM-Mediated Up-Regulation of Keap1 by Super-Low Dose Endotoxin.
Oxidative Stress Modulation by Cameroonian Spice Extracts in HepG2 Cells: Involvement of Nrf2 and Improvement of Glucose Uptake.
Chloroquine reverses chemoresistance via upregulation of p21(WAF1/CIP1) and autophagy inhibition in ovarian cancer.
Biochemical study on the protective effect of curcumin on acetaminophen and gamma-irradiation induced hepatic toxicity in rats.
VEGFA and NFE2L2 Gene Expression and Regulation by MicroRNAs in Thyroid Papillary Cancer and Colloid Goiter.
NRF2 Activation Inhibits Both TGF-β1- and IL-13-Mediated Periostin Expression in Fibroblasts: Benefit of Cinnamaldehyde for Antifibrotic Treatment.
Myokine irisin-induced protection against oxidative stress in vitro. Involvement of heme oxygenase-1 and antioxidazing enzymes superoxide dismutase-2 and glutathione peroxidase.
Acute maternal oxidant exposure causes susceptibility of the fetal brain to inflammation and oxidative stress.
Sodium fluoride affects zebrafish behaviour and alters mRNA expressions of biomarker genes in the brain: Role of Nrf2/Keap1.
Acetyl-l-carnitine prevents homocysteine-induced suppression of Nrf2/Keap1 mediated antioxidation in human lens epithelial cells.
Long X, Wu H, Zhou Y, Wan Y, Kan X, Gong J, Zhao X
Frontiers in nutrition 2022;9:852012
Frontiers in nutrition 2022;9:852012
E3 ligase TRIM15 facilitates non-small cell lung cancer progression through mediating Keap1-Nrf2 signaling pathway.
Liang M, Wang L, Sun Z, Chen X, Wang H, Qin L, Zhao W, Geng B
Cell communication and signaling : CCS 2022 May 9;20(1):62
Cell communication and signaling : CCS 2022 May 9;20(1):62
Regulation of VEGFA, KRAS, and NFE2L2 Oncogenes by MicroRNAs in Head and Neck Cancer.
Cuzziol CI, Marzochi LL, Possebon VS, Kawasaki-Oyama RS, Mattos MF, Junior VS, Ferreira LAM, Pavarino ÉC, Castanhole-Nunes MMU, Goloni-Bertollo EM
International journal of molecular sciences 2022 Jul 5;23(13)
International journal of molecular sciences 2022 Jul 5;23(13)
Astragaloside IV protects against ischemia/reperfusion (I/R)-induced kidney injury based on the Keap1-Nrf2/ARE signaling pathway.
Su Y, Xu J, Chen S, Feng J, Li J, Lei Z, Qiao L, Wang Y, Zeng D
Translational andrology and urology 2022 Aug;11(8):1177-1188
Translational andrology and urology 2022 Aug;11(8):1177-1188
P- Hydroxybenzyl Alcohol Alleviates Oxidative Stress in a Nonalcoholic Fatty Liver Disease Larval Zebrafish Model and a BRL-3A Hepatocyte Via the Nrf2 Pathway.
An J, Cheng L, Yang L, Song N, Zhang J, Ma K, Ma J
Frontiers in pharmacology 2021;12:646239
Frontiers in pharmacology 2021;12:646239
The Role of Nrf2 Transcription Factor and Sp1-Nrf2 Protein Complex in Glutamine Transporter SN1 Regulation in Mouse Cortical Astrocytes Exposed to Ammonia.
Dąbrowska K, Skowrońska K, Popek M, Albrecht J, Zielińska M
International journal of molecular sciences 2021 Oct 18;22(20)
International journal of molecular sciences 2021 Oct 18;22(20)
Ficus erecta Thunb Leaves Alleviate Memory Loss Induced by Scopolamine in Mice via Regulation of Oxidative Stress and Cholinergic System.
Sohn E, Kim YJ, Kim JH, Jeong SJ
Molecular neurobiology 2021 Aug;58(8):3665-3676
Molecular neurobiology 2021 Aug;58(8):3665-3676
Sulforaphane Protects Piglet Brains from Neonatal Hypoxic-Ischemic Injury.
Wang B, Kulikowicz E, Lee JK, Koehler RC, Yang ZJ
Developmental neuroscience 2020;42(2-4):124-134
Developmental neuroscience 2020;42(2-4):124-134
Polarization of Low-Grade Inflammatory Monocytes Through TRAM-Mediated Up-Regulation of Keap1 by Super-Low Dose Endotoxin.
Rahtes A, Li L
Frontiers in immunology 2020;11:1478
Frontiers in immunology 2020;11:1478
Oxidative Stress Modulation by Cameroonian Spice Extracts in HepG2 Cells: Involvement of Nrf2 and Improvement of Glucose Uptake.
Nwakiban APA, Cicolari S, Piazza S, Gelmini F, Sangiovanni E, Martinelli G, Bossi L, Carpentier-Maguire E, Tchamgoue AD, Agbor G, Kuiaté JR, Beretta G, Dell'Agli M, Magni P
Metabolites 2020 May 1;10(5)
Metabolites 2020 May 1;10(5)
Chloroquine reverses chemoresistance via upregulation of p21(WAF1/CIP1) and autophagy inhibition in ovarian cancer.
Hwang JR, Kim WY, Cho YJ, Ryu JY, Choi JJ, Jeong SY, Kim MS, Kim JH, Paik ES, Lee YY, Han HD, Lee JW
Cell death & disease 2020 Dec 4;11(12):1034
Cell death & disease 2020 Dec 4;11(12):1034
Biochemical study on the protective effect of curcumin on acetaminophen and gamma-irradiation induced hepatic toxicity in rats.
Eassawy MMT, Salem AA, Ismail AFM
Environmental toxicology 2020 Dec 17;
Environmental toxicology 2020 Dec 17;
VEGFA and NFE2L2 Gene Expression and Regulation by MicroRNAs in Thyroid Papillary Cancer and Colloid Goiter.
Stuchi LP, Castanhole-Nunes MMU, Maniezzo-Stuchi N, Biselli-Chicote PM, Henrique T, Padovani Neto JA, de-Santi Neto D, Girol AP, Pavarino EC, Goloni-Bertollo EM
Genes 2020 Aug 19;11(9)
Genes 2020 Aug 19;11(9)
NRF2 Activation Inhibits Both TGF-β1- and IL-13-Mediated Periostin Expression in Fibroblasts: Benefit of Cinnamaldehyde for Antifibrotic Treatment.
Mitamura Y, Murai M, Mitoma C, Furue M
Oxidative medicine and cellular longevity 2018;2018:2475047
Oxidative medicine and cellular longevity 2018;2018:2475047
Myokine irisin-induced protection against oxidative stress in vitro. Involvement of heme oxygenase-1 and antioxidazing enzymes superoxide dismutase-2 and glutathione peroxidase.
Mazur-Bialy AI, Kozlowska K, Pochec E, Bilski J, Brzozowski T
Journal of physiology and pharmacology : an official journal of the Polish Physiological Society 2018 Feb;69(1):117-125
Journal of physiology and pharmacology : an official journal of the Polish Physiological Society 2018 Feb;69(1):117-125
Acute maternal oxidant exposure causes susceptibility of the fetal brain to inflammation and oxidative stress.
Akhtar F, Rouse CA, Catano G, Montalvo M, Ullevig SL, Asmis R, Kharbanda K, Maffi SK
Journal of neuroinflammation 2017 Sep 30;14(1):195
Journal of neuroinflammation 2017 Sep 30;14(1):195
Sodium fluoride affects zebrafish behaviour and alters mRNA expressions of biomarker genes in the brain: Role of Nrf2/Keap1.
Mukhopadhyay D, Priya P, Chattopadhyay A
Environmental toxicology and pharmacology 2015 Sep;40(2):352-9
Environmental toxicology and pharmacology 2015 Sep;40(2):352-9
Acetyl-l-carnitine prevents homocysteine-induced suppression of Nrf2/Keap1 mediated antioxidation in human lens epithelial cells.
Yang SP, Yang XZ, Cao GP
Molecular medicine reports 2015 Jul;12(1):1145-50
Molecular medicine reports 2015 Jul;12(1):1145-50
No comments: Submit comment
Supportive validation
- Submitted by
- Invitrogen Antibodies (provider)
- Main image

- Experimental details
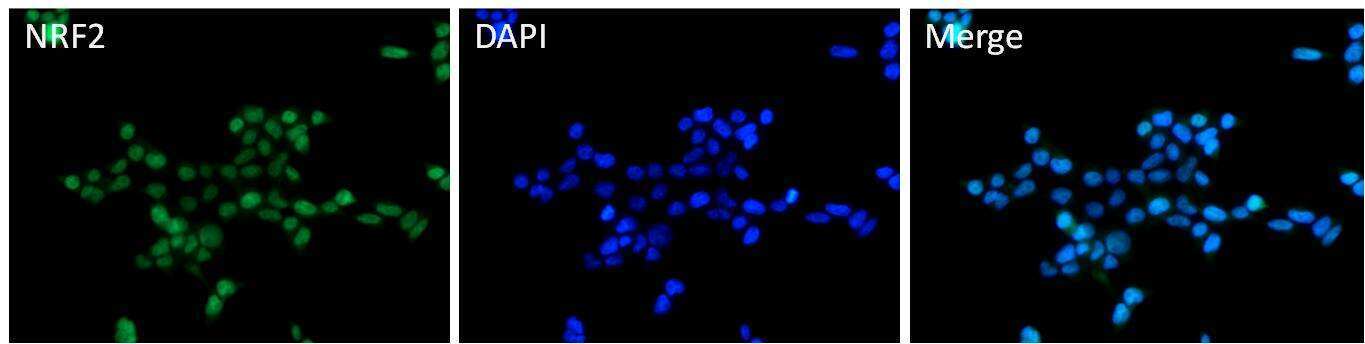
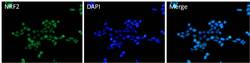
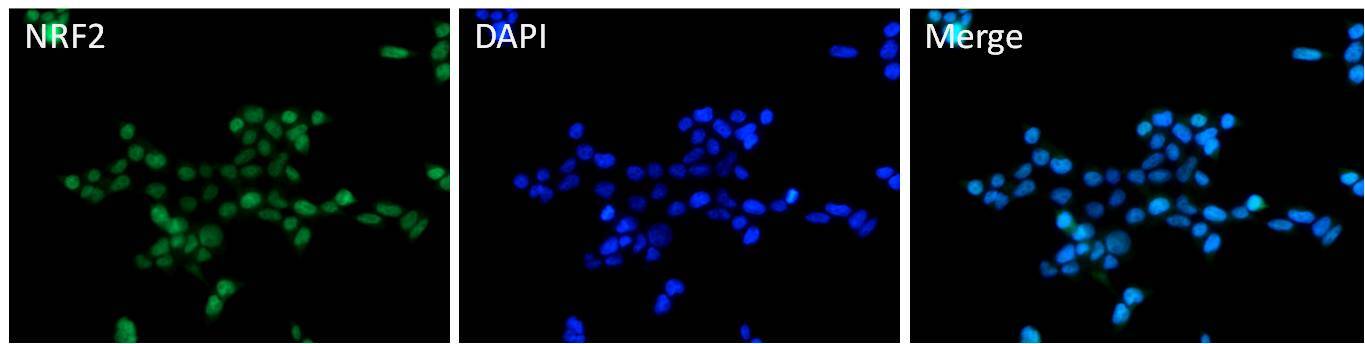
- Immunofluorescent analysis of NRF2 (green) HEK293T cells. Cells fixed with 4% formaldehyde were permeabilized and blocked with 1X PBS containing 5% BSA and 0.3% Triton X-100 for 1 hour at room temperature. Cells were probed with an NRF2 polyclonal antibody (Product # PA5-27882) at a dilution of 1:100 overnight at 4°C in 1X PBS containing 1% BSA and 0.3% Triton X-100, washed with 1X PBS, and incubated with a fluorophore-conjugated goat anti-rabbit IgG secondary antibody at a dilution of 1:200 for 1 hour at room temperature. Nuclei (blue) were stained with DAPI. Images were taken on a Leica DM1000 microscope at 40X magnification. Data courtesy of the Innovators Program.
- Submitted by
- Invitrogen Antibodies (provider)
- Main image

- Experimental details
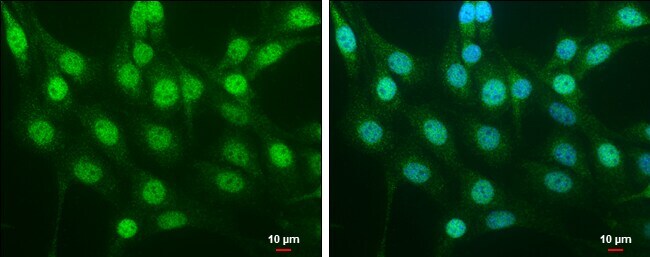
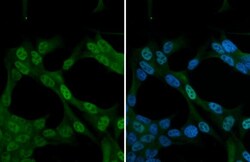
- Immunocytochemistry-Immunofluorescence analysis of Nrf2 was performed in NIH/3T3 cells fixed in 4% paraformaldehyde at RT for 15 min. Green: Nrf2 Polyclonal Antibody (Product # PA5-27882) diluted at 1:500. Blue: Hoechst 33342 staining. Scale bar = 10 µm.
- Submitted by
- Invitrogen Antibodies (provider)
- Main image

- Experimental details
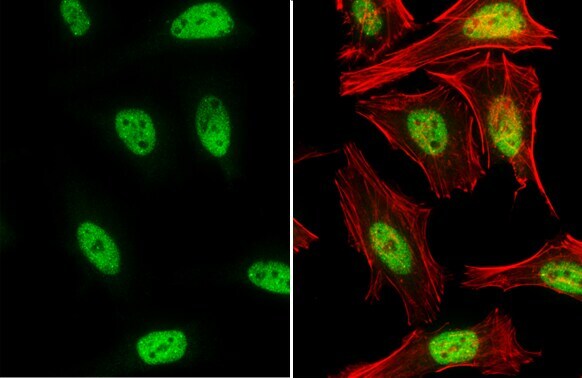
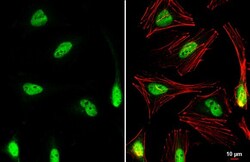
- Immunocytochemistry-Immunofluorescence analysis of Nrf2 was performed in HeLa cells fixed in 4% paraformaldehyde at RT for 15 min. Green: Nrf2 Polyclonal Antibody (Product # PA5-27882) diluted at 1:500. Red: phalloidin, a cytoskeleton marker.

- Submitted by
- Invitrogen Antibodies (provider)
- Main image

- Experimental details
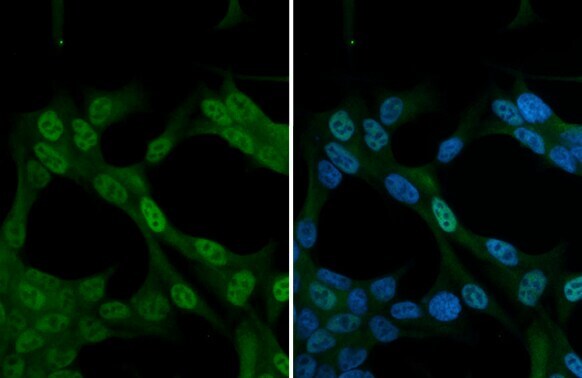
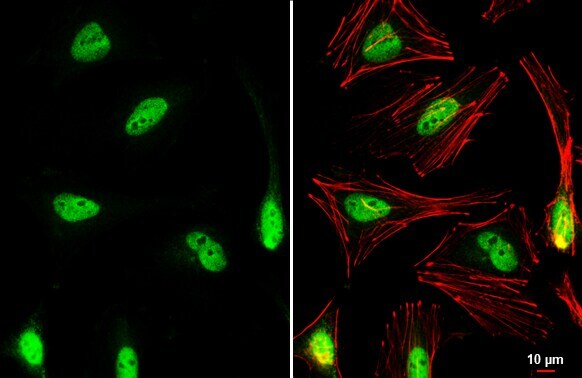
- Nrf2 Polyclonal Antibody detects NRF2 protein at nucleus by immunofluorescent analysis. Sample: HeLa cells were fixed in 4% paraformaldehyde at RT for 15 min. Green: NRF2 stained by Nrf2 Polyclonal Antibody (Product # PA5-27882) diluted at 1:1,000. Red: phalloidin, a cytoskeleton marker, diluted at 1:200. Scale bar= 10 µm.

- Submitted by
- Invitrogen Antibodies (provider)
- Main image

- Experimental details
- Nrf2 Polyclonal Antibody detects NRF2 protein at nucleus by immunofluorescent analysis. Sample: Neuro2A cells were fixed in 4% paraformaldehyde at RT for 15 min. Green: NRF2 stained by Nrf2 Polyclonal Antibody (Product # PA5-27882) diluted at 1:1,000.
- Submitted by
- Invitrogen Antibodies (provider)
- Main image
- Experimental details
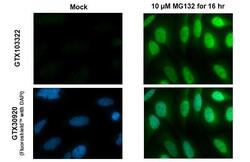
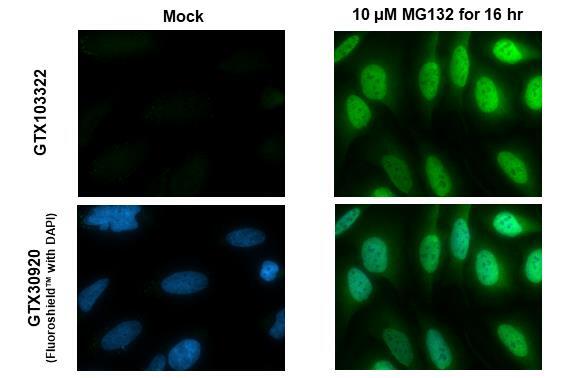
- Nrf2 Polyclonal Antibody detects NRF2 protein at nucleus by immunofluorescent analysis. Sample: Mock and treated HeLa cells were fixed in 4% paraformaldehyde at RT for 15 min. Green: NRF2 stained by Nrf2 Polyclonal Antibody (Product # PA5-27882) diluted at 1:500. Blue: Fluoroshield with DAPI .
- Submitted by
- Invitrogen Antibodies (provider)
- Main image
- Experimental details
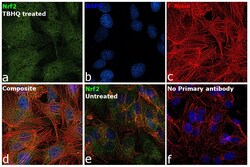
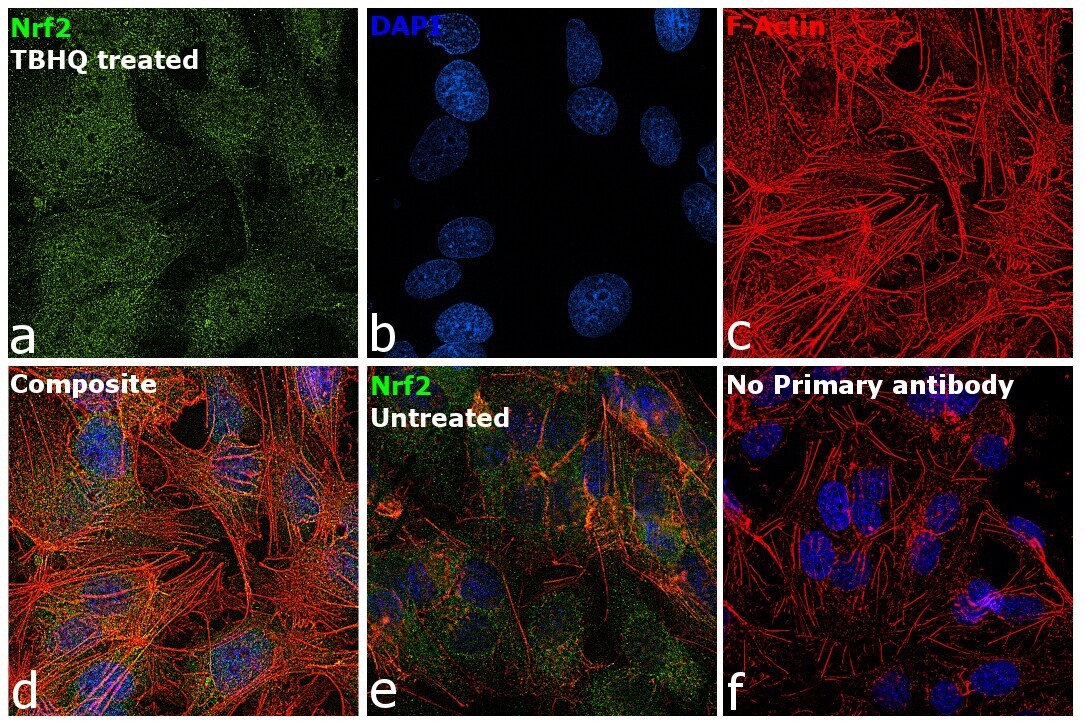
- Immunofluorescence analysis of Nuclear factor erythroid 2-related factor 2 was performed using 70% confluent log phase Hep G2 cells treated with TBHQ (100 micromolar for 4h). The cells were fixed with 4% paraformaldehyde for 10 minutes, permeabilized with 0.1% Triton™ X-100 for 15 minutes, and blocked with 2% BSA for 45 minutes at room temperature. The cells were labeled with Nrf2 Polyclonal Antibody (Product # PA5-27882) at 1:100 dilution in 0.1% BSA, incubated at 4-degree Celsius overnight, and then labeled with Donkey anti-Rabbit IgG (H+L) Highly Cross-Adsorbed Secondary Antibody, Alexa Fluor Plus 488 (Product # A32790), (1:2000 dilution), for 45 minutes at room temperature (Panel a: Green). Nuclei (Panel b:Blue) were stained with ProLong™ Diamond Antifade Mountant with DAPI (Product # P36962). F-actin (Panel c: Red) was stained with Rhodamine Phalloidin (Product # R415, 1:300 dilution). Panel d represents the merged image showing nuclear translocation of NRF2 upon TBHQ treatment. Panel e represents untreated cells showing predominant cytoplasmic localization. Panel f represents control cells with no primary antibody to assess the background. The images were captured at 60X magnification.
- Submitted by
- Invitrogen Antibodies (provider)
- Main image

- Experimental details
- Immunocytochemistry-Immunofluorescence analysis of Nrf2 was performed in NIH/3T3 cells fixed in 4% paraformaldehyde at RT for 15 min. Green: Nrf2 Polyclonal Antibody (Product # PA5-27882) diluted at 1:500. Blue: Hoechst 33342 staining. Scale bar = 10 µm.

- Submitted by
- Invitrogen Antibodies (provider)
- Main image

- Experimental details
- Immunocytochemistry-Immunofluorescence analysis of Nrf2 was performed in HeLa cells fixed in 4% paraformaldehyde at RT for 15 min. Green: Nrf2 Polyclonal Antibody (Product # PA5-27882) diluted at 1:500. Red: phalloidin, a cytoskeleton marker.
- Submitted by
- Invitrogen Antibodies (provider)
- Main image

- Experimental details
- Immunofluorescence analysis of Nuclear factor erythroid 2-related factor 2 was performed using 70% confluent log phase Hep G2 cells treated with TBHQ (100 micromolar for 4h). The cells were fixed with 4% paraformaldehyde for 10 minutes, permeabilized with 0.1% Triton™ X-100 for 15 minutes, and blocked with 2% BSA for 45 minutes at room temperature. The cells were labeled with Nrf2 Polyclonal Antibody (Product # PA5-27882) at 1:100 dilution in 0.1% BSA, incubated at 4-degree Celsius overnight, and then labeled with Donkey anti-Rabbit IgG (H+L) Highly Cross-Adsorbed Secondary Antibody, Alexa Fluor Plus 488 (Product # A32790), (1:2000 dilution), for 45 minutes at room temperature (Panel a: Green). Nuclei (Panel b:Blue) were stained with ProLong™ Diamond Antifade Mountant with DAPI (Product # P36962). F-actin (Panel c: Red) was stained with Rhodamine Phalloidin (Product # R415, 1:300 dilution). Panel d represents the merged image showing nuclear translocation of NRF2 upon TBHQ treatment. Panel e represents untreated cells showing predominant cytoplasmic localization. Panel f represents control cells with no primary antibody to assess the background. The images were captured at 60X magnification.

- Submitted by
- Invitrogen Antibodies (provider)
- Main image
- Experimental details
- Nrf2 Polyclonal Antibody detects NRF2 protein at nucleus by immunofluorescent analysis. Sample: Neuro2A cells were fixed in 4% paraformaldehyde at RT for 15 min. Green: NRF2 stained by Nrf2 Polyclonal Antibody (Product # PA5-27882) diluted at 1:1,000.

- Submitted by
- Invitrogen Antibodies (provider)
- Main image

- Experimental details
- Nrf2 Polyclonal Antibody detects NRF2 protein at nucleus by immunofluorescent analysis. Sample: Mock and treated HeLa cells were fixed in 4% paraformaldehyde at RT for 15 min. Green: NRF2 stained by Nrf2 Polyclonal Antibody (Product # PA5-27882) diluted at 1:500. Blue: Fluoroshield with DAPI .

- Submitted by
- Invitrogen Antibodies (provider)
- Main image
- Experimental details
- Nrf2 Polyclonal Antibody detects NRF2 protein at nucleus by immunofluorescent analysis. Sample: HeLa cells were fixed in 4% paraformaldehyde at RT for 15 min. Green: NRF2 stained by Nrf2 Polyclonal Antibody (Product # PA5-27882) diluted at 1:1,000. Red: phalloidin, a cytoskeleton marker, diluted at 1:200. Scale bar= 10 µm.
- Submitted by
- Invitrogen Antibodies (provider)
- Main image
- Experimental details
- Immunofluorescent analysis of NRF2 (green) HEK293T cells. Cells fixed with 4% formaldehyde were permeabilized and blocked with 1X PBS containing 5% BSA and 0.3% Triton X-100 for 1 hour at room temperature. Cells were probed with an NRF2 polyclonal antibody (Product # PA5-27882) at a dilution of 1:100 overnight at 4°C in 1X PBS containing 1% BSA and 0.3% Triton X-100, washed with 1X PBS, and incubated with a fluorophore-conjugated goat anti-rabbit IgG secondary antibody at a dilution of 1:200 for 1 hour at room temperature. Nuclei (blue) were stained with DAPI. Images were taken on a Leica DM1000 microscope at 40X magnification. Data courtesy of the Innovators Program.
Supportive validation
- Submitted by
- Invitrogen Antibodies (provider)
- Main image
- Experimental details
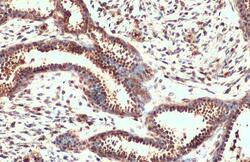
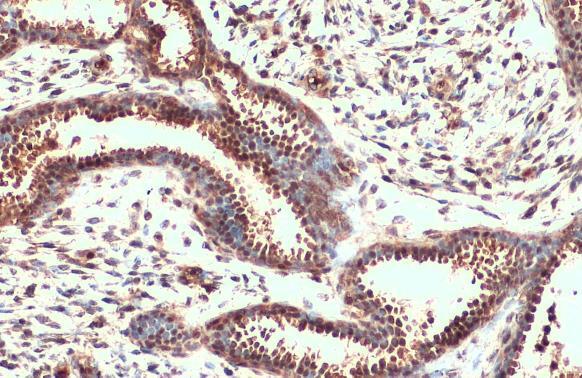
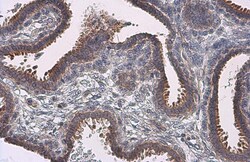
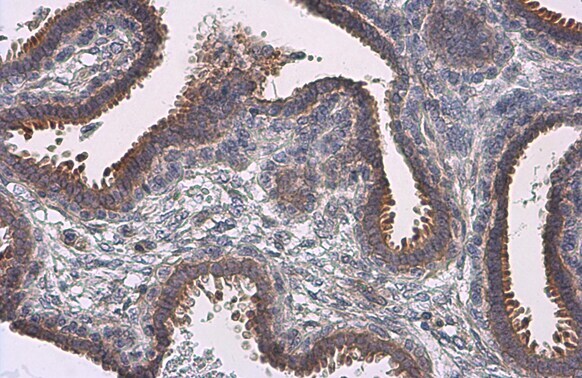
- Nrf2 Polyclonal Antibody detects NRF2 protein at cytoplasm and nucleus by immunohistochemical analysis. Sample: Paraffin-embedded human breast carcinoma. NRF2 stained by Nrf2 Polyclonal Antibody (Product # PA5-27882) diluted at 1:500. Antigen Retrieval: Citrate buffer, pH 6.0, 15 min.
- Submitted by
- Invitrogen Antibodies (provider)
- Main image
- Experimental details
- Immunohistochemistry (Paraffin) analysis of Nrf2 was performed in paraffin-embedded human breast carcinoma tissue using Nrf2 Polyclonal Antibody (Product # PA5-27882) at a dilution of 1:500. Antigen Retrieval: Citrate buffer, pH 6.0, 15 min.
Supportive validation
- Submitted by
- Invitrogen Antibodies (provider)
- Main image
- Experimental details
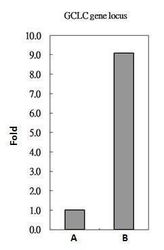
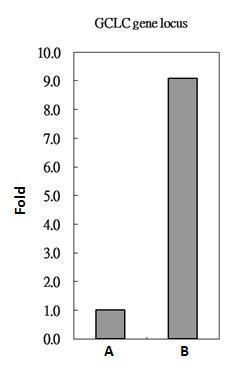
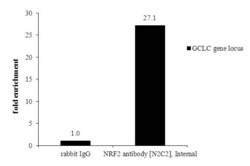
- PA5-27882 antibody immunoprecipitates NRF2 protein-DNA in ChIP experiments. ChIP Sample: HeLa whole cell lysate/extract with 5 µg preimmune rabbit IgG (A) or 5 µg of NRF2 antibody (Product # PA5-27882) (B). The precipitated DNA was detected by PCR with primer set targeting to GCLC gene locus.
- Submitted by
- Invitrogen Antibodies (provider)
- Main image

- Experimental details
- ChIP assay analysis of Nrf2 was performed in HepG2 chromatin extracts using 5 µg of either normal rabbit IgG or Nrf2 Polyclonal Antibody (Product # PA5-27882). The precipitated DNA was detected by PCR with primer set targeting to GCLC gene locus.

- Submitted by
- Invitrogen Antibodies (provider)
- Main image
- Experimental details
- ChIP assay analysis of Nrf2 was performed in HepG2 chromatin extracts using 5 µg of either normal rabbit IgG or Nrf2 Polyclonal Antibody (Product # PA5-27882). The precipitated DNA was detected by PCR with primer set targeting to GCLC gene locus.

Supportive validation
- Submitted by
- Invitrogen Antibodies (provider)
- Main image
- Experimental details
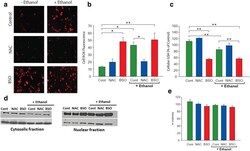
- Fig. 5 Loss of GSH content in microglia influences oxidative stress but not cell viability. EOC13.31 microglia cells were divided into six groups: either untreated (control) or pretreated with 500 muM NAC or 200 muM BSO for 18 h, prior to 22 mM EtOH exposure for 6 h. Confocal images (20x) of cells labeled with CellROX Deep Red Reagent to detect ROS generation ( a ). Semi-quantification analysis of ROS fluorescence intensity ( b ). Intracellular GSH levels were determined fluorometrically by labeling cells with 50 muM Monochlorobimane ( c ). Western blot analysis for Nrf-2 expression and nuclear translocation, where Lamin B1 and beta actin was used as a loading control for nuclear and cytosolic fraction, respectively ( d ). Effect of the above treatment regimen on cell viability (MTS assay) ( e ). Values are presented as mean average +- SEM three independent experiments. Student-Newman-Keuls comparison analysis was used (* p

- Submitted by
- Invitrogen Antibodies (provider)
- Main image
- Experimental details
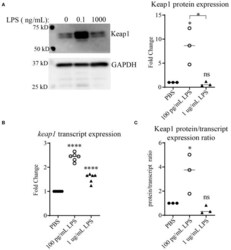
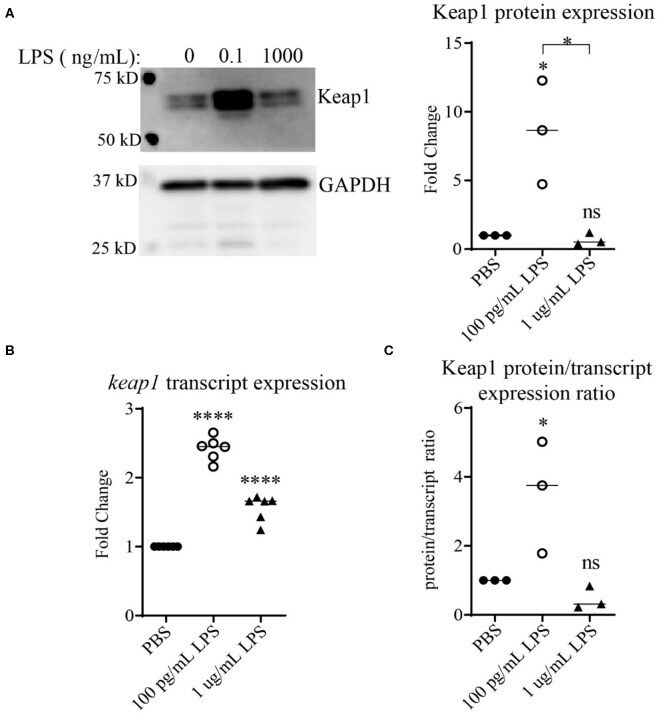
- Figure 1 Chronic SLD-LPS leads to Keap1 protein accumulation. (A) Representative Western blot image (left panel) and quantification (right panel) of Keap1 expressions in BMDMs treated with the indicated doses of LPS or PBS for 5 days ( n = 3). (B) keap1 relative transcript levels as assessed by qRT-PCR using the DeltaDeltaCT method ( n = 5). (C) The quantified protein expression values in (A) divided by the transcript values in (B) . Data is representative of at least 3 separate experiments with cells cultured in vitro from three independent mice. ANOVA analysis with Tukey's multiple comparisons test. * p < 0.05, **** p < 0.0001.
- Submitted by
- Invitrogen Antibodies (provider)
- Main image
- Experimental details
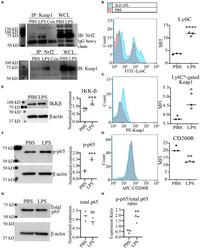
- Figure 3 SLD-LPS-mediated Keap1 accumulation is correlated with a pro-inflammatory monocyte phenotype. BMDMs were treated with either PBS or SLD-LPS (100 pg/mL) for 5 days. (A) Representative Co-IP result with no lysate IP (just antibody and beads) (Con.) and the whole cell lysate input (WCL) controls. Keap1 antibody was used to pull-down Nrf2 (upper blot), and Nrf2 was used to pull down Keap1 (lower blot). See Supplemental Figures S3 , S4 for un-altered blots. (B-D) The levels of Ly6C (B) , Keap-1 (C) , and CD200R (D) were analyzed and quantified using geometric mean fluorescence intensity (MFI) by flow cytometry. (E-G) Representative western blots of IKKbeta (E) , p-p65 (S536) (F) , and total NF-kappaB p65 (G) in monocytes with quantification on the left. (H) p-p65/total p65 ratio. All data are representative of at least 3 separate experiments ( n = 3, except for IKK-beta where n = 5). Unpaired student t -test. * p < 0.05, ** p < 0.01, *** p < 0.001, **** p < 0.0001.

- Submitted by
- Invitrogen Antibodies (provider)
- Main image
- Experimental details
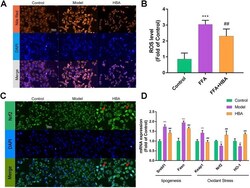
- FIGURE 5 The effect of HBA on FFA-induced BRL-3A cell in vitro (A) Nile red staining of BRL-3A cells after 1 mm FFA with and without HBA (20 muM) treatment to reveal lipid level. (B) Measurement of ROS level in BRL-3A cells after 1 mm FFA with and without HBA (20 muM) treatment. (C) Fluorescence image of FITC-conjugated secondary antibody staining indicates the location of Nrf2 (green), DAPI staining indicates the location of the nucleus (blue), and the merged images show the nuclear location of Nrf2 protein. Red arrows show the HBA-induced translocation of Nrf2 to the nucleus. (D) mRNA expression profile of HBA on FFA induced BRL-3A cell related to lipogenesis and oxidant stress. Bar indicate means +- SD. ** p < 0.01*** p < 0.001 represent compared with the control; ## p < 0.01, ### p < 0.001 represent compared with Model. p < 0.05 was considered as statistically significant calculated by One-way ANOVA followed by Tukey''s test ( n = 3, n indicates the replicates of the experiment).

- Submitted by
- Invitrogen Antibodies (provider)
- Main image
- Experimental details
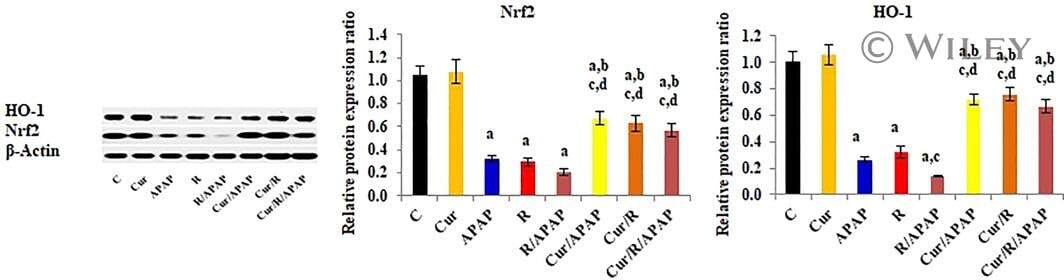
- 8 FIGURE Curcumin up-regulates the relative protein expression ratio of Nuclear factor erythroid-related factor-2 (Nrf2), and Hemeoxygenase-1 (HO-1) to beta-actin, determined by Western blot analysis in liver tissues of intoxicated rats. The results are demonstrated as mean +- SE, n = 10 rats/group. C, control untreated group; CUR, curcumin-pretreated rats; APAP, acetaminophen treated rats; R, gamma-irradiated rats; R/APAP, animals exposed to gamma-irradiation then intoxicated with APAP; CUR/APAP, Curcumin pretreated rats intoxicated with APAP; CUR/R, Curcumin pretreated rats then exposed to gamma-irradiation; CUR/R/APAP, Curcumin pretreated rats, exposed to gamma-irradiation and intoxicated with APAP; a: significant to the untreated control, b: significant to APAP, c: significant to R, and d: significant to R/APAP, ( p
- Submitted by
- Invitrogen Antibodies (provider)
- Main image

- Experimental details
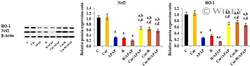
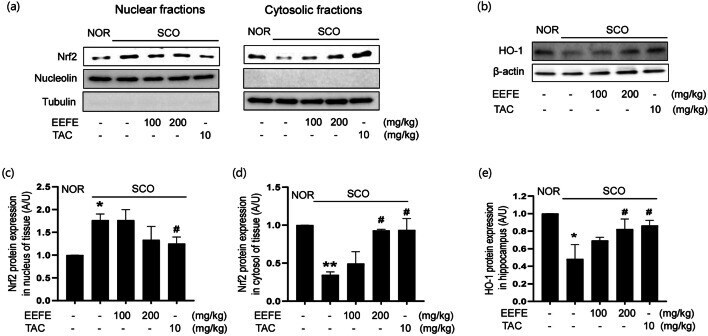
- Fig. 4 Effects of EEFE on the protein expressions of HO-1 and Nrf2 in SCO-induced memory impairment mouse brains. Western blotting was performed to determine the levels of Nrf2 and HO-1. a , b Representative photographs show the immunoblots for Nrf2 in nuclear (left) and cytosolic (right) fractions ( a ), and HO-1 in whole-brain tissues ( b ). c - e Bar graphs represent a quantitative analysis of relative band intensities of the Nrf2 in the nucleus ( c ) and cytosol ( d ), and HO-1 in whole-brain tissues ( e ) compared with NOR. Expression levels were normalized to beta-actin for whole lysates, tubulin for cytosol, or nucleolin for the nucleus. TAC was used as a positive control. Data are presented as the mean +- SEM ( n= 5). ** p
- Submitted by
- Invitrogen Antibodies (provider)
- Main image

- Experimental details
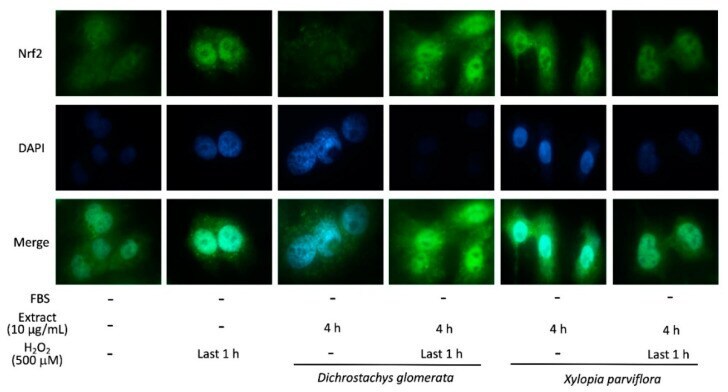
- Figure 4 Effect of Dichrostachys glomerata and Xylopia parviflora extracts on Nrf2 nuclear translocation in HepG2 cells. Cells were treated with 10 ug/mL spice extracts for 4 h; 500 uM H 2 O 2 was added in the last hour. Nrf2 was detected with Alexa Fluor 488 F(ab')2 fragment of anti-rabbit antibody; nuclei were counterstained with 4',6-diamidino-2-phenylindole dihydrochloride (DAPI). Images are representative of three separate observations.
- Submitted by
- Invitrogen Antibodies (provider)
- Main image
- Experimental details
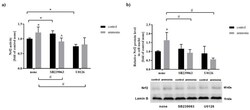
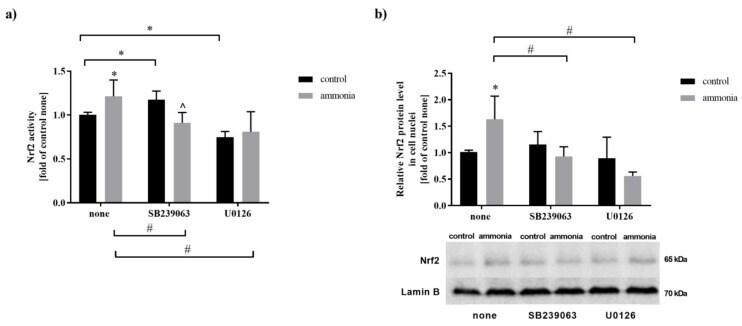
- Figure 1 The effect of MAPK, and MEK1/2 inhibitors in the absence or presence of ammonia on the Nrf2 activity and Nrf2 nuclear protein level. ( a ) Nrf2 activity in mouse cortical astrocytes after exposure to ammonia, MAPK, and MEK1/2 inhibitors. Results are the mean +- SD ( n = 4). (*) p < 0.05 vs. control none; (#) p < 0.05 vs. ammonia none; (^) p < 0.05 vs. control SB239063; two-way ANOVA, Bonferroni post hoc test. ( b ) Nrf2 protein level in cell nuclei of mouse cortical astrocytes after exposition to ammonia, MAPK, and MEK1/2 inhibitors. Results are the mean +- SD ( n = 4). (*) p < 0.05 vs. control none; (#) p < 0.05 vs. ammonia none; (^) p < 0.05 vs. control SB239063; two-way ANOVA, Bonferroni post hoc test.
- Submitted by
- Invitrogen Antibodies (provider)
- Main image
- Experimental details
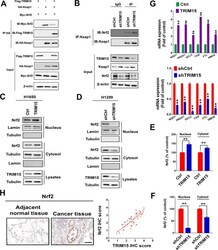
- Fig. 5 TRIM15 stabilizes Nrf2 through binding with Keap1. A HEK293 cells transfected with Flag-TRIM15, HA-Keap1, and Myc-Nrf2 were subjected to immunoprecipitation with HA antibody. Lysates were analyzed by western blotting. B TRIM15 reduced the interaction between Nrf2 and Keap1. Cell lysates were immunoprecipitated with an anti-Keap1 antibody and blotted with an anti-Nrf2 antibody. C - F Subcellular fractionation was used to isolate cytoplasmic and nuclear proteins, and immunoblotting was performed to examine the localization of Nrf2 following the downregulation or overexpression of TRIM15. Nuclear and cytoplasmic levels of Nrf2 are quantified. G Effect of TRIM15 knockdown (H1299 cells) or overexpression (H1650 cells) on the mRNA expression of the Nrf2-regulated genes. NAD(P)H quinone dehydrogenase1(NOQ1), thioredoxin (TXN), peroxiredoxin 1(PRDX1), hemoxygenase 1(HMOX1), glutamate-cysteine ligase catalytic subunit (GCLC), glutathione S-transferase mu1(GSTM1), glutathione S-transferase mu3(GSTM3), ferritin light chain (FTL). H Representative IHC staining images of Nrf2 in the same set of NSCLC tissue slices. Correlation analysis of TRIM15 and Nrf2 expression in NSCLC samples. Spearman correlation coefficients are shown. Scale bars, 100 mum. Statistical analyses were performed by two-tailed unpaired Student's t -test. ** P < 0.01

- Submitted by
- Invitrogen Antibodies (provider)
- Main image

- Experimental details
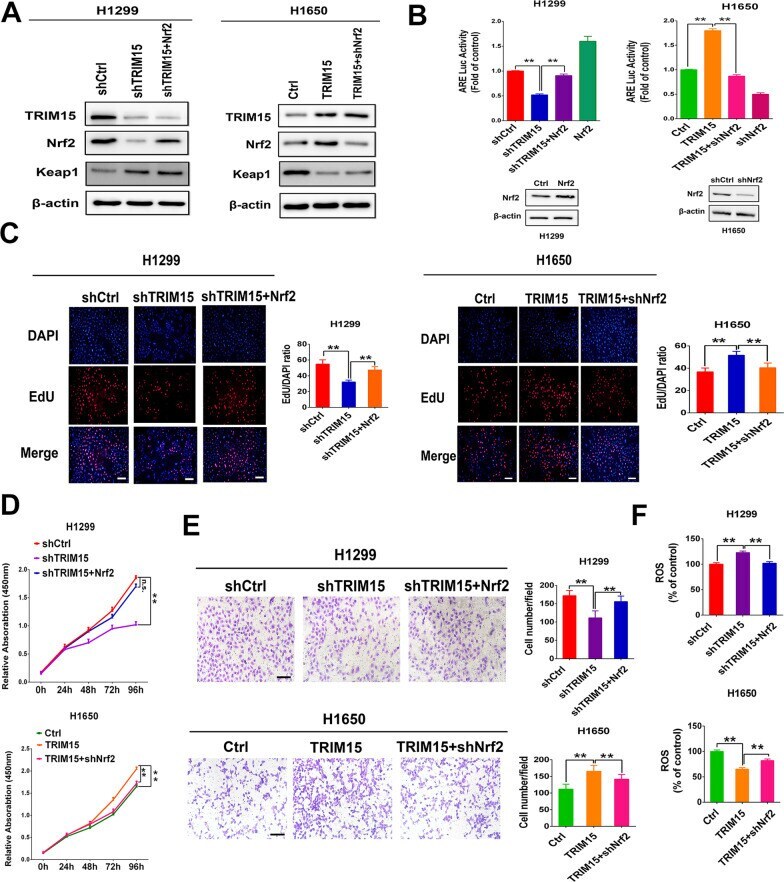
- Fig. 6 TRIM15-mediated Nrf2 signaling regulates growth and invasion in NSCLC cells in vitro. A Western blot analyses of TRIM15, Nrf2, Keap1, and Nrf2 target NQO1 in H1299 cells with TRIM15 knockdown with or without subsequent Nrf2 overexpression and H1650 cells overexpressing TRIM15 with or without subsequent knockdown of Nrf2. B ARE Luc reporter activity assessed in H1299 cells expressing shTRIM15, sh TRIM15 + Nrf2 or H1650 cells overexpressing TRIM15 with or without subsequent knockdown of Nrf2. Up-regulating of Nrf2 expression in H1299 cells or down-regulating of Nrf2 expression in H1650 cells was set as a control. C - F Cell proliferation ( C , D ), invasion ( E ) and ROS formation ( F ) in H1299 cells with or without shTRIM15 and Nrf2 rescue or in H1650 cells with or without TRIM15 overexpression and shNrf2 rescue. Statistical analyses were performed by two-tailed unpaired Student's t -test. ** P < 0.01
- Submitted by
- Invitrogen Antibodies (provider)
- Main image
- Experimental details
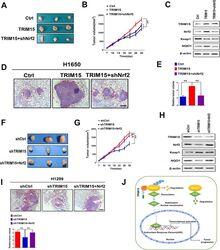
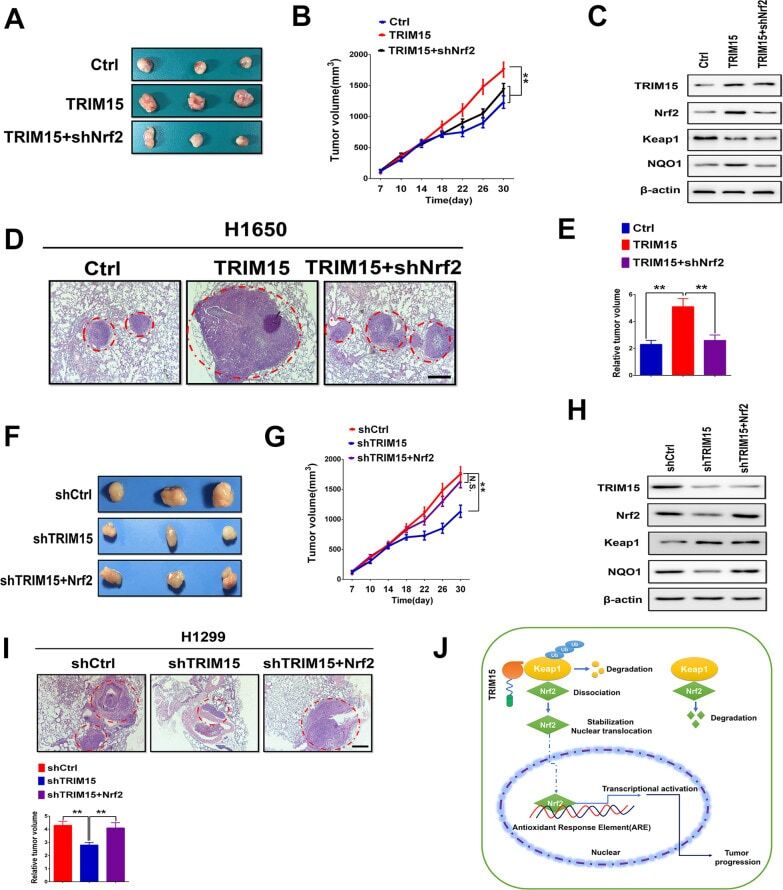
- Fig. 7 TRIM15 mediated increase in Nrf2 regulates growth and invasion in vivo. A Nude mice were randomized into three groups and subcutaneously injected with H1650 cells that had been transfected with control (empty vector), TRIM15, or TRIM15 + shNrf2 plasmids. Tumors formed in nude mice were collected 30 days after grafting, and the tumor weight were measured. B Measurement of tumor volume in experimental groups over time. C Western blotting analysis was performed to evaluate the levels of TRIM15, Nrf2, Keap1, and NQO1 in harvested tumors. D , E Up-regulation of TRIM15 significantly promoted lung metastasis in H1650 xenograft nude mice models, whereas the suppression of Nrf2 prevented the tumor metastasis of TRIM15 overexpressing cells. Representative pictures of the lung metastases in nude mice by H&E staining. Quantification of lung metastases in all groups. Scale bar: 200 mum. F , G A representative image of tumor growth in nude mice subcutaneously inoculated with H1299 cells tranfected with shCtrl, shTRIM15 or shTRIM15 + Nrf2 plasmids. Tumor volumes were measured on the indicated days. H Western blotting analysis was performed to evaluate the levels of TRIM15, Nrf2, Keap1, and NQO1 in xenograft tumors. I Representative pictures of the lung metastases in nude mice by H&E staining. Quantification of lung metastases in all groups. Scale bar: 200 mum. J TRIM15 was significantly upregulated in NSCLC and that increased TRIM15 was associated with poor survival. TRIM15 promoted
- Submitted by
- Invitrogen Antibodies (provider)
- Main image
- Experimental details
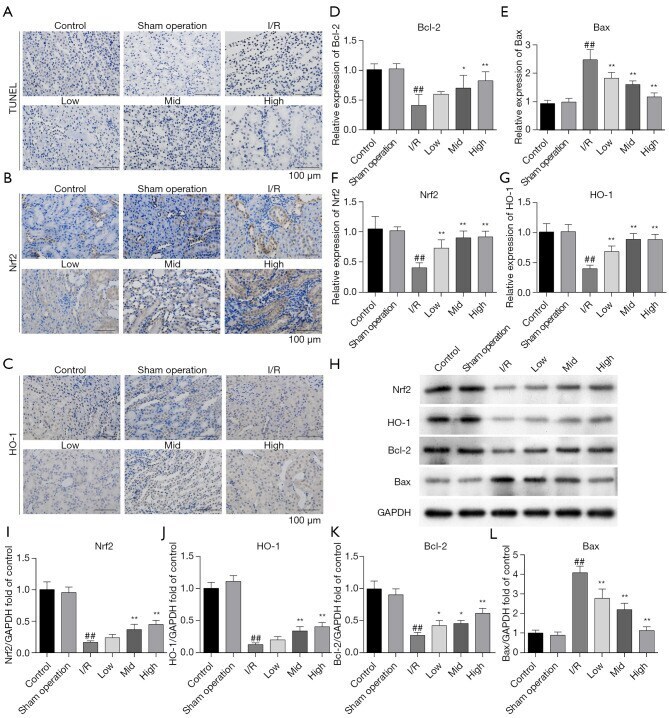
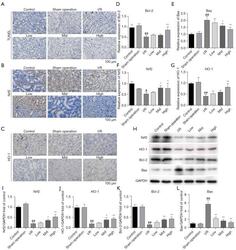
- Figure 2 AS-IV treatment relieved I/R-induced apoptosis and regulated the Nrf2/HO-1 pathway in rat kidney tissues. (A) Apoptosis in the renal tissues of AKI rats as detected by TUNEL staining. Magnification x400. (B,C) Nrf2 and HO-1 were detected by IHC. Magnification x400. Bcl-2, Bax, Nrf2, and HO-1 expression were evaluated by qRT-PCR (D-G) and western blotting (H-L). # P

- Submitted by
- Invitrogen Antibodies (provider)
- Main image
- Experimental details
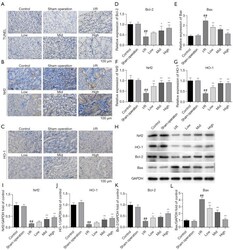
- Figure 5 AS-IV relieved renal cell apoptosis and regulated the Nrf2/HO-1 pathway in the I/R-induced CKD model. (A) Apoptosis in the renal tissues of the CKD rats as determined by TUNEL staining. Magnification x400. (B,C) Nrf2 and HO-1 were detected by IHC. Magnification x400. Bcl-2, Bax, Nrf2, and HO-1 expression in kidney tissues was evaluated by qRT-PCR (D-G) and western blotting (H-L). ## P