Explore
 Validate
 Learn
Learn Western blot
 Immunocytochemistry
Antibody data
- Antibody Data
- Antigen structure
- References [1]
- Comments [0]
- Validations
- Immunocytochemistry [2]
- Immunohistochemistry [1]
- Other assay [1]
Submit
Validation data
Reference
Comment
Report error
- Product number
- PA5-82000 - Provider product page

- Provider
- Invitrogen Antibodies
- Product name
- LEF1 Polyclonal Antibody
- Antibody type
- Polyclonal
- Antigen
- Recombinant protein fragment
- Description
- Immunogen sequence: SDVNSKQGMS RHPPAPDIPT FYPLSPGGVG QITPPLGWQG QPVYPITGGF RQPYPSSLSV DTSMSRFSHH MIPGPPGPHT TGIPHPAIVT PQVKQEHPHT DSDLMHVKPQ HEQRKEQEPK RPHIKKPLNA FMLY
- Reactivity
- Human
- Host
- Rabbit
- Isotype
- IgG
- Vial size
- 100 μL
- Concentration
- 0.1 mg/mL
- Storage
- Store at 4°C short term. For long term storage, store at -20°C, avoiding freeze/thaw cycles.
Submitted references Changes in the Expression of Smooth Muscle Cell-Related Genes in Human Dermal Sheath Cup Cells Associated with the Treatment Outcome of Autologous Cell-Based Therapy for Male and Female Pattern Hair Loss.
Yoshida Y, Takahashi M, Yamanishi H, Nakazawa Y, Kishimoto J, Ohyama M
International journal of molecular sciences 2022 Jun 27;23(13)
International journal of molecular sciences 2022 Jun 27;23(13)
No comments: Submit comment
Supportive validation
- Submitted by
- Invitrogen Antibodies (provider)
- Main image

- Experimental details
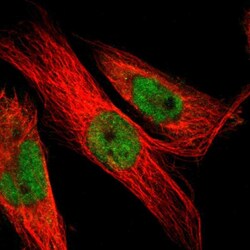
- Immunofluorescent analysis of LEF1 in U-251 MG cells using a LEF1 polyclonal antibody (Product # PA5-82000). The analysis shows localization to nucleoplasm & cytosol.

- Submitted by
- Invitrogen Antibodies (provider)
- Main image
- Experimental details
- Immunofluorecent analysis of LEF1 in human cell line U-251 MG using LEF1 Polyclonal Antibody (Product # PA5-82000). Staining shows localization to nucleoplasm and cytosol.

Supportive validation
- Submitted by
- Invitrogen Antibodies (provider)
- Main image

- Experimental details
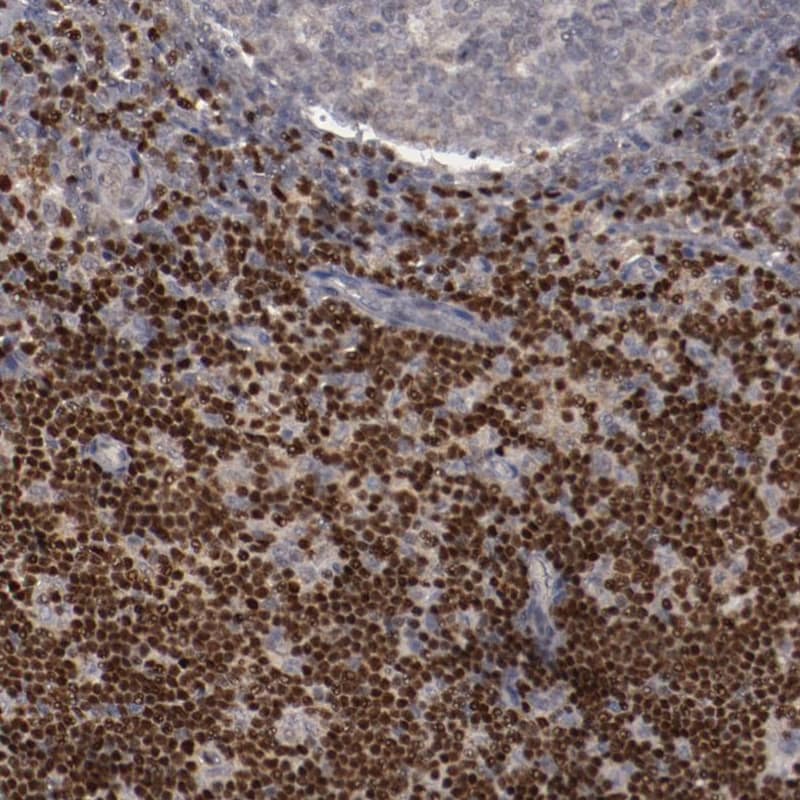
- Immunohistochemical analysis of LEF1 in human lymph node using LEF1 Polyclonal Antibody (Product # PA5-82000) shows moderate to strong nuclear positivity in non - germinal center cells.
Supportive validation
- Submitted by
- Invitrogen Antibodies (provider)
- Main image

- Experimental details
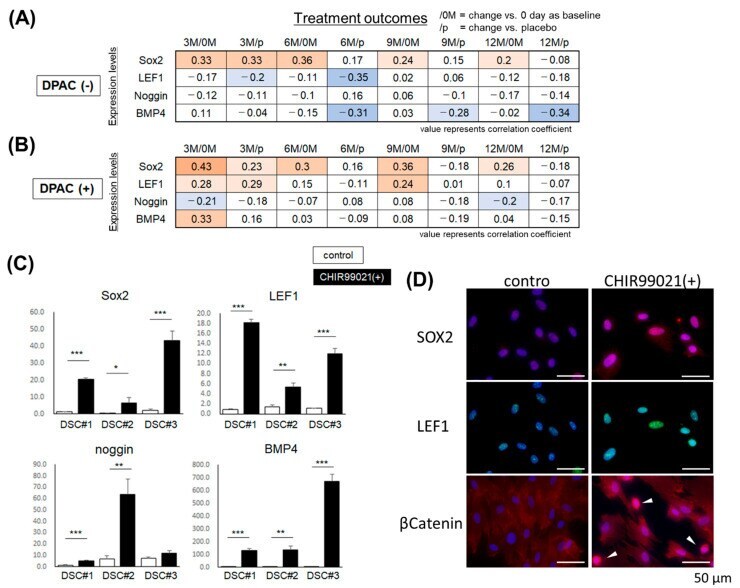
- Effect of DPAC medium and CHIR99021 treatment on DSC cells. ( A , B ) Correlation between the treatment outcome score at 3, 6, 9, and 12 months vs. day 0 (3 M/0 M, 6 M/0 M, 9 M/0 M, and 12 M/0 M) or vs. placebo (3 M/p, 6 M/p, 9 M/p, and 12 M/p) during the clinical study using DSC cell lines [], and the expression levels of DP markers. Each value represents the correlation coefficient. Red: positive correlation; blue: inverse correlation. ( C ) Relative expression levels of Sox2, LEF1, Noggin, and BMP4 in three DSC cell lines (DSC#1-#3) cultured in medium (control) or with 3 uM CHIR99021 ( n = 3). Expression levels were normalized to GAPDH and the results are expressed as the mean +- S.D. Student's t -test, * p < 0.05, ** p < 0.01, *** p < 0.001. ( D ) Immunostaining of DSC cells cultured in control or CHIR99021-containing medium for SOX2 (red), LEF1 (green), and beta-catenin (red). Blue indicates Hoechst 33,342 nuclear staining. Arrowheads: beta-catenin nuclear translocation. Bars = 50 um.