Explore
 Validate
 Learn
Learn Western blot
 Other assay
Antibody data
- Antibody Data
- Antigen structure
- References [1]
- Comments [0]
- Validations
- Other assay [2]
Submit
Validation data
Reference
Comment
Report error
- Product number
- PA5-69473 - Provider product page

- Provider
- Invitrogen Antibodies
- Product name
- DRAM Polyclonal Antibody
- Antibody type
- Polyclonal
- Antigen
- Synthetic peptide
- Reactivity
- Human, Mouse
- Host
- Rabbit
- Isotype
- IgG
- Vial size
- 100 µL
- Concentration
- 0.5 mg/mL
- Storage
- -20° C, Avoid Freeze/Thaw Cycles
Submitted references Role of DRAM1 in mitophagy contributes to preeclampsia regulation in mice.
Chen G, Lin Y, Chen L, Zeng F, Zhang L, Huang Y, Huang P, Liao L, Yu Y
Molecular medicine reports 2020 Sep;22(3):1847-1858
Molecular medicine reports 2020 Sep;22(3):1847-1858
No comments: Submit comment
Supportive validation
- Submitted by
- Invitrogen Antibodies (provider)
- Main image

- Experimental details
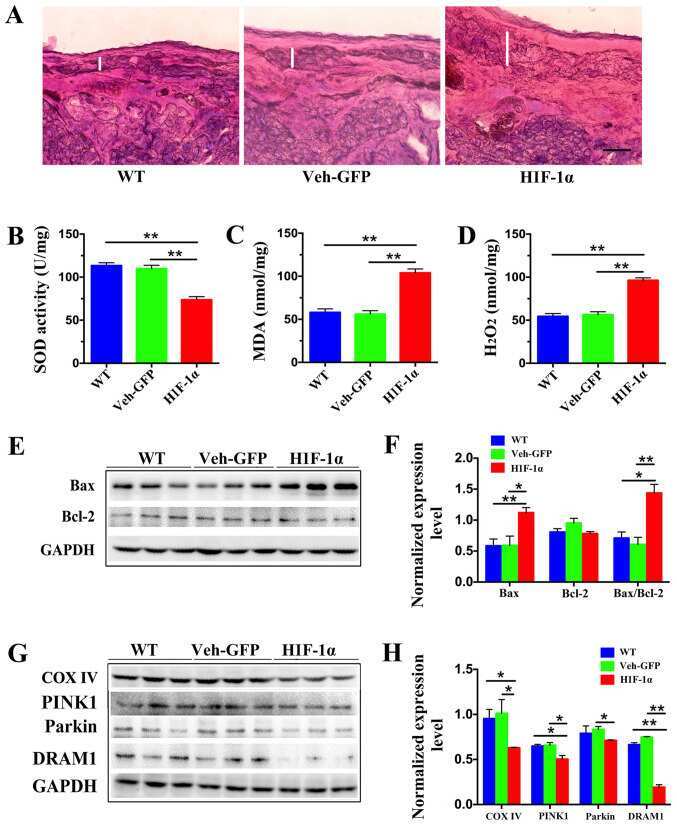
- Figure 2. Levels of oxidative stress, apoptosis and mitochondrial autophagy are increased in the placenta of preeclampsia mice. (A) Morphological examination of mouse placenta at embryonic day 19.5 by hematoxylin and eosin staining revealed that the junctional zone (represented by the white line) of Hif-1alpha mice was larger than those of WT and Veh-GFP mice. Scale bar, 100 um. (B) Activity of SOD in placental tissue was detected by nitro-blue tetrazolium, (C) levels of MDA were measured using thiobarbituric acid and (D) levels of H 2 O 2 were measured using titanium sulfate. **P
- Submitted by
- Invitrogen Antibodies (provider)
- Main image
- Experimental details
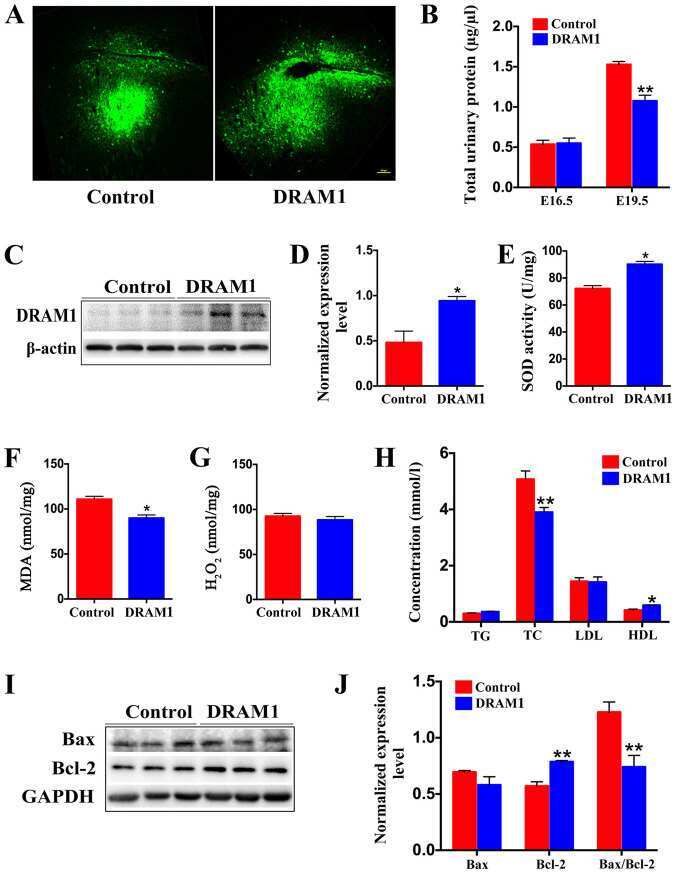
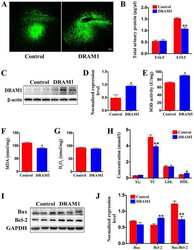
- Figure 3. Overexpression of DRAM1 can effectively reduce apoptosis induced by oxidative stress and significantly reduce the urine protein and blood lipid levels in preeclampsia. (A) Representative images showing the overexpression of DRAM1 or control in the placenta of mice at E19.5. Scale bar, 100 um. (B) Bicinchoninic acid protein assays were used to determine the total urinary protein level in the control and DRAM1 mice at E16.5 and E19.5 (n=6). (C) Representative western blot images and (D) semi-quantification of DRAM1 levels in the placenta of DRAM1-overexpressing or control mice at E19.5 (n=3). Densitometry results were normalized against the levels of GAPDH. Levels of placental oxidative stress in DRAM1 mice was significantly decreased. (E) SOD in placental tissue was detected by nitro-blue tetrazolium, (F) levels of MDA were measured using thiobarbituric acid and (G) levels of H 2 O 2 were measured using titanium sulfate (n=3). (H) TG, TC, LDL and HDL levels in the serum of control and DRAM1 mice at E19.5 (n=6). (I) Representative western blot images and (J) semi-quantification of Bax and Bcl-2 in the placenta of control and DRAM1 mice. Densitometry results were normalized against the levels of GAPDH (n=3). Data are presented as the mean +- SEM. *P