 Explore
 Validate
 Learn
Learn Western blot
 Immunocytochemistry
 Immunohistochemistry
Antibody data
- Antibody Data
- Antigen structure
- References [8]
- Comments [0]
- Validations
- Immunocytochemistry [7]
- Immunoprecipitation [1]
- Other assay [12]
Submit
Validation data
Reference
Comment
Report error
- Product number
- PA1-021 - Provider product page

- Provider
- Invitrogen Antibodies
- Product name
- NFATC4 Polyclonal Antibody
- Antibody type
- Polyclonal
- Antigen
- Synthetic peptide
- Description
- PA1-021 detects nuclear factor of activated T-cells 3 (NFAT3) from human cells. PA1-021 has been successfully used in Western blot immunohistochemistry, immunofluorescence, and immunoprecipitation procedures. By Western blot, this antibody detects an ~150 kDa protein representing NFAT3 in HEK293 cells transfected with the human NFAT3 gene. Immunohistochemical staining of NFAT3 in HEK293 cells transfected with the human NFAT3 gene results in cytoplasmic staining. The PA1-021 immunogen is a synthetic peptide corresponding to residues C R(887) D L S G F P A P P G E E P P A(902) of human NFAT3. This sequence is 94% conserved with mouse NFAT3. The PA1-021 immunizing peptide (Cat. # PEP-122) is available for use in neutralization and control experiments.
- Reactivity
- Human
- Host
- Rabbit
- Isotype
- IgG
- Vial size
- 100 μg
- Concentration
- 1 mg/mL
- Storage
- -20°C, Avoid Freeze/Thaw Cycles
Submitted references Inhibition of Syk promotes chemical reprogramming of fibroblasts via metabolic rewiring and H(2) S production.
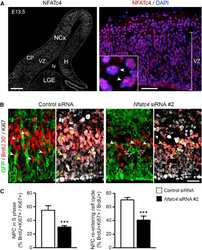
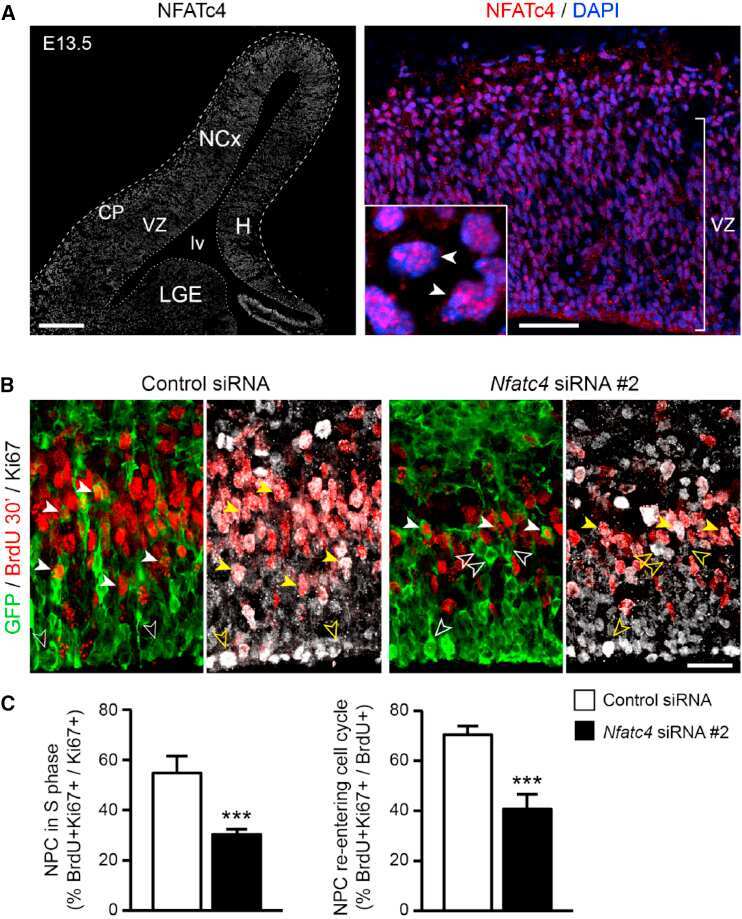
Transcriptional Profiling of Hypoxic Neural Stem Cells Identifies Calcineurin-NFATc4 Signaling as a Major Regulator of Neural Stem Cell Biology.
Nuclear factor of activated T cells (NFAT) signaling regulates PTEN expression and intestinal cell differentiation.
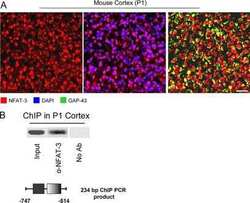
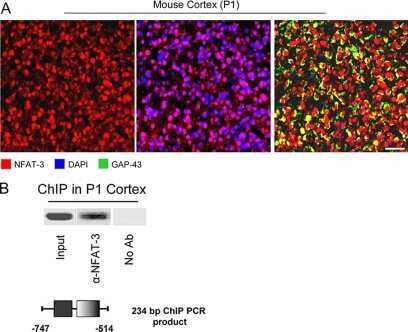
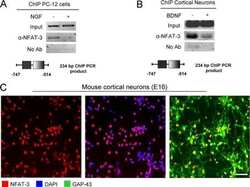
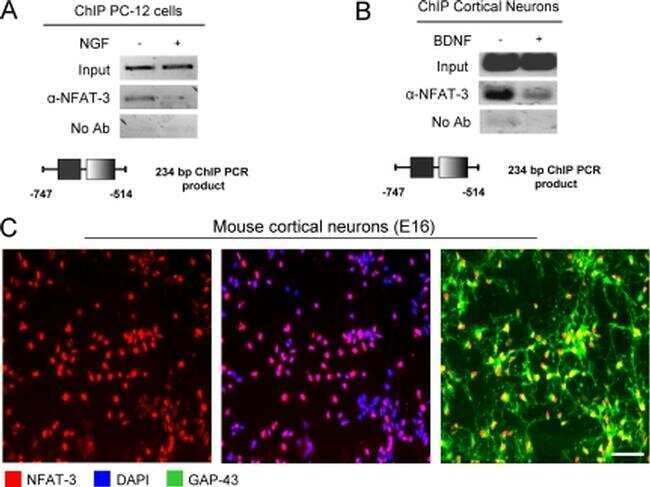
NFAT-3 is a transcriptional repressor of the growth-associated protein 43 during neuronal maturation.
The transcription factor NFAT3 mediates neuronal survival.
Nicotine activates nuclear factor of activated T cells c2 (NFATc2) and prevents cell cycle entry in T cells.
Phosphorylation of NFATc4 by p38 mitogen-activated protein kinases.
Phosphorylation of NFATc4 by p38 mitogen-activated protein kinases.
Wang W, Ren S, Lu Y, Chen X, Qu J, Ma X, Deng Q, Hu Z, Jin Y, Zhou Z, Ge W, Zhu Y, Yang N, Li Q, Pu J, Chen G, Ye C, Wang H, Zhao X, Liu Z, Zhu S
The EMBO journal 2021 Jun 1;40(11):e106771
The EMBO journal 2021 Jun 1;40(11):e106771
Transcriptional Profiling of Hypoxic Neural Stem Cells Identifies Calcineurin-NFATc4 Signaling as a Major Regulator of Neural Stem Cell Biology.
Moreno M, Fernández V, Monllau JM, Borrell V, Lerin C, de la Iglesia N
Stem cell reports 2015 Aug 11;5(2):157-65
Stem cell reports 2015 Aug 11;5(2):157-65
Nuclear factor of activated T cells (NFAT) signaling regulates PTEN expression and intestinal cell differentiation.
Wang Q, Zhou Y, Jackson LN, Johnson SM, Chow CW, Evers BM
Molecular biology of the cell 2011 Feb 1;22(3):412-20
Molecular biology of the cell 2011 Feb 1;22(3):412-20
NFAT-3 is a transcriptional repressor of the growth-associated protein 43 during neuronal maturation.
Nguyen T, Lindner R, Tedeschi A, Forsberg K, Green A, Wuttke A, Gaub P, Di Giovanni S
The Journal of biological chemistry 2009 Jul 10;284(28):18816-23
The Journal of biological chemistry 2009 Jul 10;284(28):18816-23
The transcription factor NFAT3 mediates neuronal survival.
Benedito AB, Lehtinen M, Massol R, Lopes UG, Kirchhausen T, Rao A, Bonni A
The Journal of biological chemistry 2005 Jan 28;280(4):2818-25
The Journal of biological chemistry 2005 Jan 28;280(4):2818-25
Nicotine activates nuclear factor of activated T cells c2 (NFATc2) and prevents cell cycle entry in T cells.
Frazer-Abel AA, Baksh S, Fosmire SP, Willis D, Pierce AM, Meylemans H, Linthicum DS, Burakoff SJ, Coons T, Bellgrau D, Modiano JF
The Journal of pharmacology and experimental therapeutics 2004 Nov;311(2):758-69
The Journal of pharmacology and experimental therapeutics 2004 Nov;311(2):758-69
Phosphorylation of NFATc4 by p38 mitogen-activated protein kinases.
Yang TT, Xiong Q, Enslen H, Davis RJ, Chow CW
Molecular and cellular biology 2002 Jun;22(11):3892-904
Molecular and cellular biology 2002 Jun;22(11):3892-904
Phosphorylation of NFATc4 by p38 mitogen-activated protein kinases.
Yang TT, Xiong Q, Enslen H, Davis RJ, Chow CW
Molecular and cellular biology 2002 Jun;22(11):3892-904
Molecular and cellular biology 2002 Jun;22(11):3892-904
No comments: Submit comment
Supportive validation
- Submitted by
- Invitrogen Antibodies (provider)
- Main image
- Experimental details
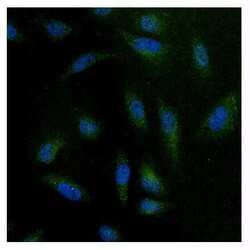
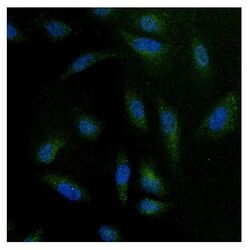
- Immunofluorescent analysis of NFAT3 using anti-NFAT3 polyclonal antibody (Product # PA1-021) (shown in green) in HeLa cells. Formalin fixed cells were permeabilized with 0.1% Triton X-100 in TBS for 10 minutes at room temperature. Cells were then blocked with 1% Blocker BSA (Product # 37525) for 15 minutes at room temperature. Cells were probed with a rabbit polyclonal antibody recognizing NFAT3 (Product # PA1-021), at a dilution of 1:100 for at least 1 hour at room temperature. Cells were washed with PBS and incubated with DyLight 488 goat-anti-rabbit secondary antibody (Product # 35552) at a dilution of 1:400 for 30 minutes at room temperature. Nuclei (blue) were stained with Hoechst 33342 dye (Product # 62249). Images were taken on a Thermo Scientific ArrayScan at 20X magnification.
- Submitted by
- Invitrogen Antibodies (provider)
- Main image
- Experimental details
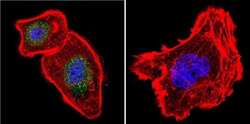
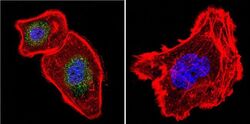
- Immunofluorescent analysis of NFAT3 in A431 Cells. Cells were grown on chamber slides and fixed with formaldehyde prior to staining. Cells were probed without (control) or with a NFAT3 polyclonal antibody (Product # PA1-021) at a dilution of 1:100 overnight at 4 C, washed with PBS and incubated with a DyLight-488 conjugated secondary antibody (Product # 35552). NFAT3 staining (green), F-Actin staining with Phalloidin (red) and nuclei with DAPI (blue) is shown. Images were taken at 60X magnification.

- Submitted by
- Invitrogen Antibodies (provider)
- Main image
- Experimental details
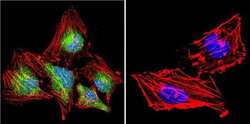
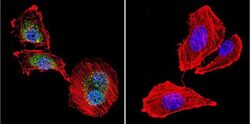
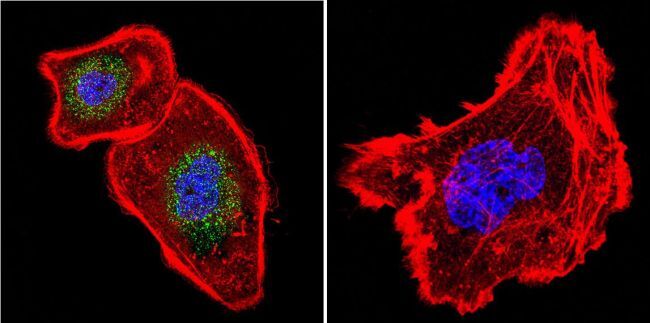
- Immunofluorescent analysis of NFAT3 in HeLa Cells. Cells were grown on chamber slides and fixed with formaldehyde prior to staining. Cells were probed without (control) or with a NFAT3 polyclonal antibody (Product # PA1-021) at a dilution of 1:20 overnight at 4 C, washed with PBS and incubated with a DyLight-488 conjugated secondary antibody (Product # 35552). NFAT3 staining (green), F-Actin staining with Phalloidin (red) and nuclei with DAPI (blue) is shown. Images were taken at 60X magnification.

- Submitted by
- Invitrogen Antibodies (provider)
- Main image
- Experimental details
- Immunofluorescent analysis of NFAT3 in U251 Cells. Cells were grown on chamber slides and fixed with formaldehyde prior to staining. Cells were probed without (control) or with a NFAT3 polyclonal antibody (Product # PA1-021) at a dilution of 1:20 overnight at 4 C, washed with PBS and incubated with a DyLight-488 conjugated secondary antibody (Product # 35552). NFAT3 staining (green), F-Actin staining with Phalloidin (red) and nuclei with DAPI (blue) is shown. Images were taken at 60X magnification.

- Submitted by
- Invitrogen Antibodies (provider)
- Main image
- Experimental details
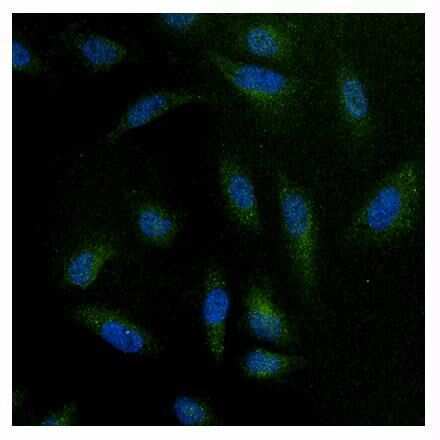
- Immunofluorescent analysis of NFAT3 using anti-NFAT3 polyclonal antibody (Product # PA1-021) (shown in green) in HeLa cells. Formalin fixed cells were permeabilized with 0.1% Triton X-100 in TBS for 10 minutes at room temperature. Cells were then blocked with 1% Blocker BSA (Product # 37525) for 15 minutes at room temperature. Cells were probed with a rabbit polyclonal antibody recognizing NFAT3 (Product # PA1-021), at a dilution of 1:100 for at least 1 hour at room temperature. Cells were washed with PBS and incubated with DyLight 488 goat-anti-rabbit secondary antibody (Product # 35552) at a dilution of 1:400 for 30 minutes at room temperature. Nuclei (blue) were stained with Hoechst 33342 dye (Product # 62249). Images were taken on a Thermo Scientific ArrayScan at 20X magnification.

- Submitted by
- Invitrogen Antibodies (provider)
- Main image
- Experimental details
- Immunofluorescent analysis of NFAT3 in A431 Cells. Cells were grown on chamber slides and fixed with formaldehyde prior to staining. Cells were probed without (control) or with a NFAT3 polyclonal antibody (Product # PA1-021) at a dilution of 1:100 overnight at 4 C, washed with PBS and incubated with a DyLight-488 conjugated secondary antibody (Product # 35552). NFAT3 staining (green), F-Actin staining with Phalloidin (red) and nuclei with DAPI (blue) is shown. Images were taken at 60X magnification.
- Submitted by
- Invitrogen Antibodies (provider)
- Main image

- Experimental details
- Immunofluorescent analysis of NFAT3 in HeLa Cells. Cells were grown on chamber slides and fixed with formaldehyde prior to staining. Cells were probed without (control) or with a NFAT3 polyclonal antibody (Product # PA1-021) at a dilution of 1:20 overnight at 4 C, washed with PBS and incubated with a DyLight-488 conjugated secondary antibody (Product # 35552). NFAT3 staining (green), F-Actin staining with Phalloidin (red) and nuclei with DAPI (blue) is shown. Images were taken at 60X magnification.

Supportive validation
- Submitted by
- Invitrogen Antibodies (provider)
- Main image

- Experimental details
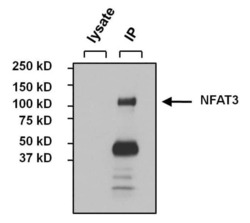
- Immunoprecipitation of NFAT3 was performed on MCF7 cells. The antigen:antibody complex was formed by incubating 500 µg whole cell lysate with 3 µg of rabbit polyclonal antibody recognizing NFAT3 (Product # PA1-021) overnight on a rocking platform at 4°C. The immune-complex was captured on 50 µL Protein A/G Plus Agarose (Product # 20423). Captured immune-complexes were washed and proteins eluted with 5X Reducing Sample Loading Dye (Product # 39000). Samples were resolved on a 4-20% Tris-HCl polyacrylamide gel. Proteins were transferred to PVDF membrane and blocked with 5% Milk/TBS-0.1%Tween for at least 1 hour. Membranes were washed in TBS-0.1%Tween 20 and probed with a goat anti-rabbit-HRP secondary antibody (Product # 31460) at a dilution of 1:20,000 for at least one hour. Membranes were washed and chemiluminescent detection performed using Pierce Super Signal West Dura (Product # 34075).

Supportive validation
- Submitted by
- Invitrogen Antibodies (provider)
- Main image

- Experimental details
- Immunoprecipitation of NFAT3 was performed on MCF7 cells. The antigen:antibody complex was formed by incubating 500 µg whole cell lysate with 3 µg of rabbit polyclonal antibody recognizing NFAT3 (Product # PA1-021) overnight on a rocking platform at 4°C. The immune-complex was captured on 50 µL Protein A/G Plus Agarose (Product # 20423). Captured immune-complexes were washed and proteins eluted with 5X Reducing Sample Loading Dye (Product # 39000). Samples were resolved on a 4-20% Tris-HCl polyacrylamide gel. Proteins were transferred to PVDF membrane and blocked with 5% Milk/TBS-0.1%Tween for at least 1 hour. Membranes were washed in TBS-0.1%Tween 20 and probed with a goat anti-rabbit-HRP secondary antibody (Product # 31460) at a dilution of 1:20,000 for at least one hour. Membranes were washed and chemiluminescent detection performed using Pierce Super Signal West Dura (Product # 34075).

- Submitted by
- Invitrogen Antibodies (provider)
- Main image

- Experimental details
- NULL

- Submitted by
- Invitrogen Antibodies (provider)
- Main image
- Experimental details
- NULL
- Submitted by
- Invitrogen Antibodies (provider)
- Main image
- Experimental details
- NULL
- Submitted by
- Invitrogen Antibodies (provider)
- Main image
- Experimental details
- NULL

- Submitted by
- Invitrogen Antibodies (provider)
- Main image
- Experimental details
- NULL
- Submitted by
- Invitrogen Antibodies (provider)
- Main image
- Experimental details
- Immunoprecipitation of NFAT3 was performed on MCF7 cells. The antigen:antibody complex was formed by incubating 500 µg whole cell lysate with 3 µg of rabbit polyclonal antibody recognizing NFAT3 (Product # PA1-021) overnight on a rocking platform at 4øC. The immune-complex was captured on 50 µL Protein A/G Plus Agarose (Product # 20423). Captured immune-complexes were washed and proteins eluted with 5X Reducing Sample Loading Dye (Product # 39000). Samples were resolved on a 4-20% Tris-HCl polyacrylamide gel. Proteins were transferred to PVDF membrane and blocked with 5% Milk/TBS-0.1%Tween for at least 1 hour. Membranes were washed in TBS-0.1%Tween 20 and probed with a goat anti-rabbit-HRP secondary antibody (Product # 31460) at a dilution of 1:20,000 for at least one hour. Membranes were washed and chemiluminescent detection performed using Pierce Super Signal West Dura (Product # 34075).

- Submitted by
- Invitrogen Antibodies (provider)
- Main image

- Experimental details
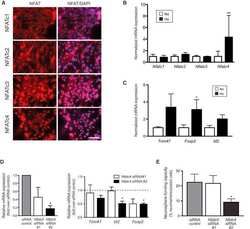
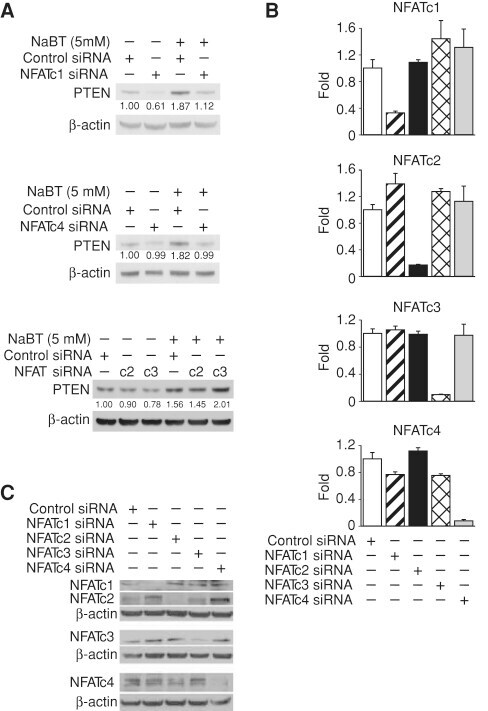
- FIGURE 2: Knockdown of NFATc1 and NFATc4, but not NFATc2 and NFATc3, attenuated NaBT induction of PTEN expression in HT29 cells. (A) HT29 cells were transfected with control siRNA or siRNA specific targeting NFATc1 (upper panel), c4 (middle panel), c2 or c3 (lower panel). After a 24-h incubation, transfected cells were treated with NaBT (5 mM) for an additional 24 h. Cells were lysed and Western blot analysis was performed using antibodies against PTEN and beta-actin. PTEN signals were quantitated densitometrically and expressed as fold change with respect to beta-actin. (B, C) HT29 cells were transfected with control siRNA or siRNA targeting NFATc1, c2, c3, or c4. After a 48-h incubation, total RNA (B) and total protein (C) were extracted and real-time RT-PCR and Western blot performed for analysis of NFATc1, NFATc2, NFATc3, and NFATc4 mRNA and protein expression, respectively.
- Submitted by
- Invitrogen Antibodies (provider)
- Main image
- Experimental details
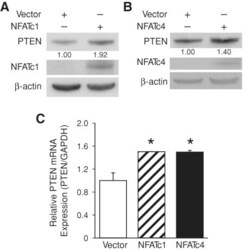
- FIGURE 3: NFATc1 and NFATc4 regulation of PTEN expression in HT29. (A, B) HT29 cells were transfected with control vector or active mutants for NFATc1 (A) or NFATc4 (B). After a 48-h incubation, PTEN, NFATc1, and NFATc4 expression was determined by Western blot. beta-Actin was blotted to confirm equal loading. PTEN signals were quantitated densitometrically and expressed as fold change with respect to beta-actin. (C) HT29 cells were transfected with control vector or active mutants for NFATc1 or NFATc4. After a 48-h incubation, total RNA was extracted and PTEN mRNA levels were determined by real-time RT-PCR. (Data represent mean +- SD; *, P < 0.05 vs. control.)

- Submitted by
- Invitrogen Antibodies (provider)
- Main image
- Experimental details
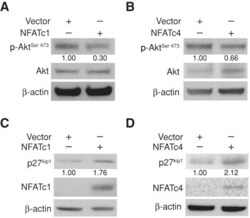
- FIGURE 4: Overexpression of NFATc1 or NFATc4 decreased Akt phosphorylation in HT29 cells. HT29 Cells were transfected with pcDNA3.1 control vector or active mutants for NFATc1 (A, C) or NFATc4 (B, D). After a 48-h incubation, phospho-Akt, total Akt, p27 kip1 , and NFATc1 or NFATc4 expression were determined by Western blot. beta-Actin was blotted to confirm equal loading. Phospho-Akt and p27 kip1 signals were quantitated densitometrically and expressed as fold change with respect to total Akt and beta-actin, respectively.

- Submitted by
- Invitrogen Antibodies (provider)
- Main image

- Experimental details
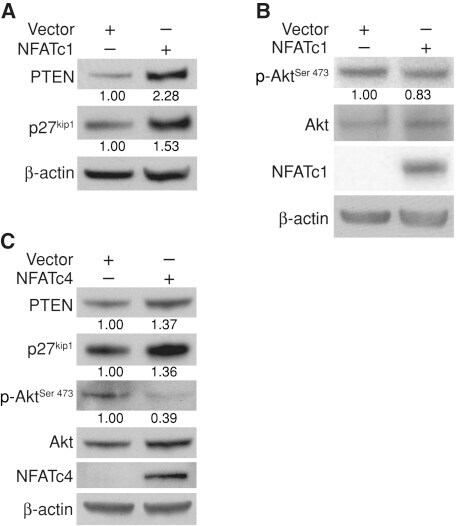
- FIGURE 5: NFATc1 and NFATc4 induction of PTEN expression in Caco-2 cells. Caco-2 cells were transfected with pcDNA3.1 control vector or the active mutant for NFATc1 (A, B) or NFATc4 (C). After a 48-h incubation, PTEN and p27 kip1 (A, C) or phospho-Akt and total Akt (B, C) were determined by Western blot. beta-Actin was blotted to confirm equal loading; overexpression was confirmed by expression of NFATc1 and NFATc4 in B and C, respectively. PTEN and p27 kip1 signals were quantitated densitometrically and expressed as fold change with respect to beta-actin. Phospho-Akt signals were quantitated densitometrically and expressed as fold change with respect to total Akt.
- Submitted by
- Invitrogen Antibodies (provider)
- Main image
- Experimental details
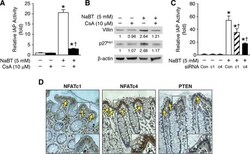
- FIGURE 7: Inhibition of NFAT attenuated NaBT-mediated intestinal cell differentiation in HT29 cells. (A, B) HT29 cells were treated with CsA, NaBT, or the combination of NaBT with CsA for 24 h. Cells were lysed and alkaline phosphatase activity was determined (A). (Data represent mean +- SD; *, P < 0.05 vs. control; +, P < 0.05 vs. NaBT alone.) Villin and p27 kip1 expression was determined by Western blotting (B). Villin and p27 kip1 signals were quantitated densitometrically and expressed as fold change with respect to beta-actin. (C) HT29 cells were transfected with NFATc1, NFATc4, or control siRNA. After a 24-h incubation, transfected cells were treated with NaBT (5 mM) for 24 h. Cells were lysed and alkaline phosphatase activity was determined. (Data represent mean +- SD; *, P < 0.05 vs. control; +, P < 0.05 vs. NaBT alone.) (D) Immunohistochemical analysis of NFATc1, NFATc4, and PTEN protein expression in normal human colon. Human colon tissue sections were fixed and stained with primary anti-human NFATc1, NFATc4, or PTEN antibodies. NFATc1, NFATc4, and PTEN are specifically expressed in the differentiated region (i.e., upper crypts; arrows).
