Explore
 Validate
 Learn
Learn Western blot
 Immunocytochemistry
Antibody data
- Antibody Data
- Antigen structure
- References [1]
- Comments [0]
- Validations
- Immunocytochemistry [4]
- Immunoprecipitation [1]
- Immunohistochemistry [3]
- Other assay [2]
Submit
Validation data
Reference
Comment
Report error
- Product number
- MA1-153 - Provider product page

- Provider
- Invitrogen Antibodies
- Product name
- BCR-ABL Monoclonal Antibody (7C6)
- Antibody type
- Monoclonal
- Antigen
- Other
- Description
- Western blot analysis of MA1-153 detects ~130-160 kDa and a 210-250 kDa protein in K562 cells. In addition to BCR-ABL, BCR and ABL are also expressed in these cells and full length BCR is also detected by the antibody. For detection purposes, non-reducing conditions resulted in enhanced detection of BCR-ABL.
- Reactivity
- Human, Mouse
- Host
- Mouse
- Isotype
- IgG
- Antibody clone number
- 7C6
- Vial size
- 100 μg
- Concentration
- 1 mg/mL
- Storage
- -20°C
Submitted references The quiescent fraction of chronic myeloid leukemic stem cells depends on BMPR1B, Stat3 and BMP4-niche signals to persist in patients in remission.
Jeanpierre S, Arizkane K, Thongjuea S, Grockowiak E, Geistlich K, Barral L, Voeltzel T, Guillemin A, Gonin-Giraud S, Gandrillon O, Nicolini FE, Mead AJ, Maguer-Satta V, Lefort S
Haematologica 2021 Jan 1;106(1):111-122
Haematologica 2021 Jan 1;106(1):111-122
No comments: Submit comment
Supportive validation
- Submitted by
- Invitrogen Antibodies (provider)
- Main image
- Experimental details
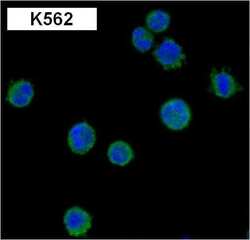
- Immunofluorescent analysis of BCR-ABL (green) in K562 cells. Formalin fixed cells were permeabilized with 0.1% Triton X-100 in TBS for 10 minutes at room temperature. Cells were blocked with 1% Blocker BSA (Product # 37525) for 15 minutes at room temperature. Cells were probed with a BCR-ABL monoclonal antibody (Product # MA1-153) at a dilution of 1:50 for at least 1 hour at room temperature, washed with PBS, and incubated with a DyLight 488-conjugated goat anti-mouse IgG secondary antibody (Product # 35502). Nuclei (blue) were stained with Hoechst 33342 dye (Product # 62249). Images were taken on a Thermo Scientific ToxInsight Instrument at 20X magnification.
- Submitted by
- Invitrogen Antibodies (provider)
- Main image

- Experimental details
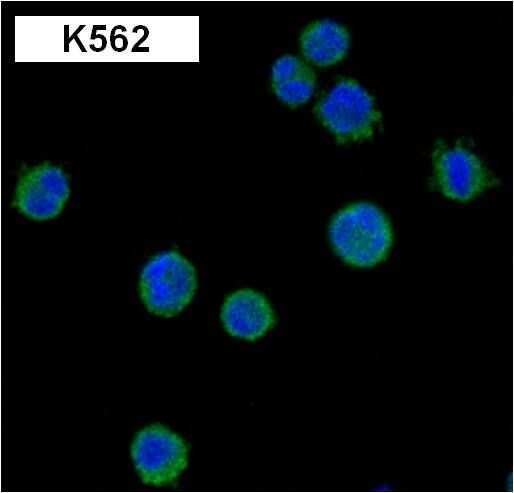
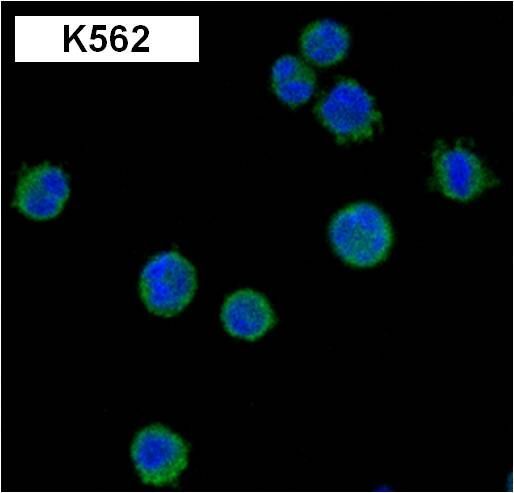
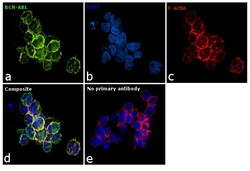
- Immunofluorescence analysis of BCR-ABL was performed using 70% confluent log phase K-562 cells. The cells were fixed with 4% paraformaldehyde for 10 minutes, permeabilized with 0.1% Triton™ X-100 for 15 minutes, and blocked with 1% BSA for 1 hour at room temperature. The cells were labeled with BCR-ABL Monoclonal Antibody (7C6) (Product # MA1-153) at 1:100 dilution in 0.1% BSA, incubated at 4 degree Celsius overnight and then labeled with Goat anti-Mouse IgG (H+L) Superclonal™ Secondary Antibody, Alexa Fluor® 488 conjugate (Product # A28175) at a dilution of 1:2000 for 45 minutes at room temperature (Panel a: green). Nuclei (Panel b: blue) were stained with ProLong™ Diamond Antifade Mountant with DAPI (Product # P36962). F-actin (Panel c: red) was stained with Rhodamine Phalloidin (Product # R415). Panel d represents the merged image showing membranous localization. Panel e represents control cells with no primary antibody to assess background. The images were captured at 60X magnification.

- Submitted by
- Invitrogen Antibodies (provider)
- Main image

- Experimental details
- Immunofluorescent analysis of BCR-ABL (green) in K562 cells. Formalin fixed cells were permeabilized with 0.1% Triton X-100 in TBS for 10 minutes at room temperature. Cells were blocked with 1% Blocker BSA (Product # 37525) for 15 minutes at room temperature. Cells were probed with a BCR-ABL monoclonal antibody (Product # MA1-153) at a dilution of 1:50 for at least 1 hour at room temperature, washed with PBS, and incubated with a DyLight 488-conjugated goat anti-mouse IgG secondary antibody (Product # 35502). Nuclei (blue) were stained with Hoechst 33342 dye (Product # 62249). Images were taken on a Thermo Scientific ToxInsight Instrument at 20X magnification.
- Submitted by
- Invitrogen Antibodies (provider)
- Main image
- Experimental details
- Immunofluorescence analysis of BCR-ABL was performed using 70% confluent log phase K-562 cells. The cells were fixed with 4% paraformaldehyde for 10 minutes, permeabilized with 0.1% Triton™ X-100 for 15 minutes, and blocked with 1% BSA for 1 hour at room temperature. The cells were labeled with BCR-ABL Monoclonal Antibody (7C6) (Product # MA1-153) at 1:100 dilution in 0.1% BSA, incubated at 4 degree Celsius overnight and then labeled with Goat anti-Mouse IgG (H+L) Superclonal™ Secondary Antibody, Alexa Fluor® 488 conjugate (Product # A28175) at a dilution of 1:2000 for 45 minutes at room temperature (Panel a: green). Nuclei (Panel b: blue) were stained with ProLong™ Diamond Antifade Mountant with DAPI (Product # P36962). F-actin (Panel c: red) was stained with Rhodamine Phalloidin (Product # R415). Panel d represents the merged image showing membranous localization. Panel e represents control cells with no primary antibody to assess background. The images were captured at 60X magnification.

Supportive validation
- Submitted by
- Invitrogen Antibodies (provider)
- Main image
- Experimental details
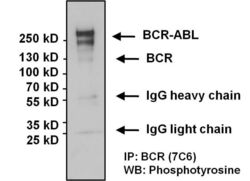
- Immunoprecipitation of BCR-ABL and BCR was performed using K562 whole cell lysate. Antigen-antibody complexes were formed by incubating 800 µg of lysate with 5 µg of a BCR monoclonal antibody (Product # MA1-153) overnight on a rocking platform at 4°C. The immune complexes were captured on 50 µl Protein A/G Agarose (Product # 20421), washed extensively, and eluted with 5X Lane Marker Reducing Sample Buffer (Product # 39000). The sample was resolved on a 4-20% Tris-HCl polyacrylamide gel, transferred to a PVDF membrane, and blocked with 5% BSA/TBS-0.1%Tween for 1 hour. The membrane was probed with a phosphotyrosine monoclonal antibody (detecting p-Tyr-BCR-ABL/p-Tyr-BCR) at a dilution of 1:1000 overnight rotating at 4°C, washed in TBST, and probed with a goat anti-mouse IgG-HRP secondary antibody (Product # 31430) at a dilution of 1:20,000 for 1 hour. Chemiluminescent detection was performed using SuperSignal West Pico (Product # 34080).
Supportive validation
- Submitted by
- Invitrogen Antibodies (provider)
- Main image
- Experimental details
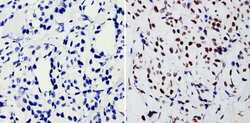
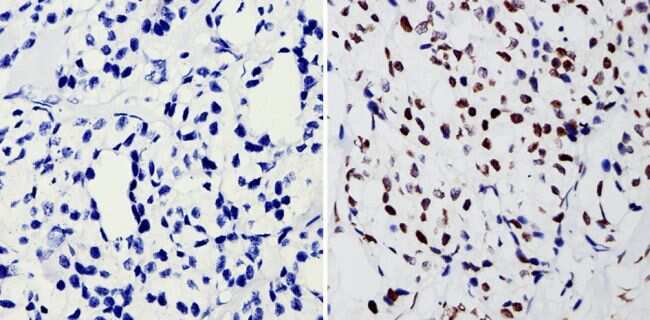
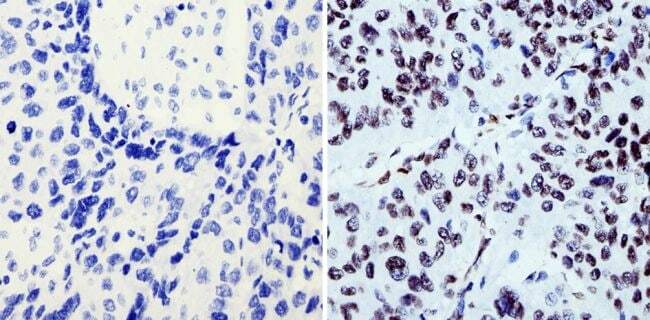
- Immunohistochemistry analysis of BCR-ABL showing staining in the nucleus of paraffin-embedded human breast carcinoma (right) compared with a negative control without primary antibody (left). To expose target proteins, antigen retrieval was performed using 10mM sodium citrate (pH 6.0), microwaved for 8-15 min. Following antigen retrieval, tissues were blocked in 3% H2O2-methanol for 15 min at room temperature, washed with ddH2O and PBS, and then probed with a BCR-ABL monoclonal antibody (Product # MA1-153) diluted in 3% BSA-PBS at a dilution of 1:200 overnight at 4°C in a humidified chamber. Tissues were washed extensively in PBST and detection was performed using an HRP-conjugated secondary antibody followed by colorimetric detection using a DAB kit. Tissues were counterstained with hematoxylin and dehydrated with ethanol and xylene to prep for mounting.
- Submitted by
- Invitrogen Antibodies (provider)
- Main image
- Experimental details
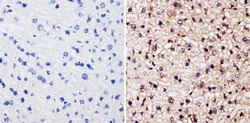
- Immunohistochemistry analysis of BCR-ABL showing staining in the nucleus and cytoplasm of paraffin-embedded mouse liver tissue (right) compared with a negative control without primary antibody (left). To expose target proteins, antigen retrieval was performed using 10mM sodium citrate (pH 6.0), microwaved for 8-15 min. Following antigen retrieval, tissues were blocked in 3% H2O2-methanol for 15 min at room temperature, washed with ddH2O and PBS, and then probed with a BCR-ABL monoclonal antibody (Product # MA1-153) diluted in 3% BSA-PBS at a dilution of 1:100 overnight at 4°C in a humidified chamber. Tissues were washed extensively in PBST and detection was performed using an HRP-conjugated secondary antibody followed by colorimetric detection using a DAB kit. Tissues were counterstained with hematoxylin and dehydrated with ethanol and xylene to prep for mounting.
- Submitted by
- Invitrogen Antibodies (provider)
- Main image
- Experimental details
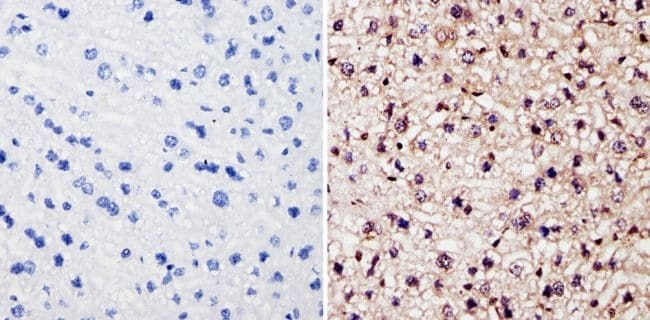
- Immunohistochemistry analysis of BCR-ABL showing staining in the nucleus of paraffin-embedded human hepatocarcinoma (right) compared with a negative control without primary antibody (left). To expose target proteins, antigen retrieval was performed using 10mM sodium citrate (pH 6.0), microwaved for 8-15 min. Following antigen retrieval, tissues were blocked in 3% H2O2-methanol for 15 min at room temperature, washed with ddH2O and PBS, and then probed with a BCR-ABL monoclonal antibody (Product # MA1-153) diluted in 3% BSA-PBS at a dilution of 1:200 overnight at 4°C in a humidified chamber. Tissues were washed extensively in PBST and detection was performed using an HRP-conjugated secondary antibody followed by colorimetric detection using a DAB kit. Tissues were counterstained with hematoxylin and dehydrated with ethanol and xylene to prep for mounting.
Supportive validation
- Submitted by
- Invitrogen Antibodies (provider)
- Main image

- Experimental details
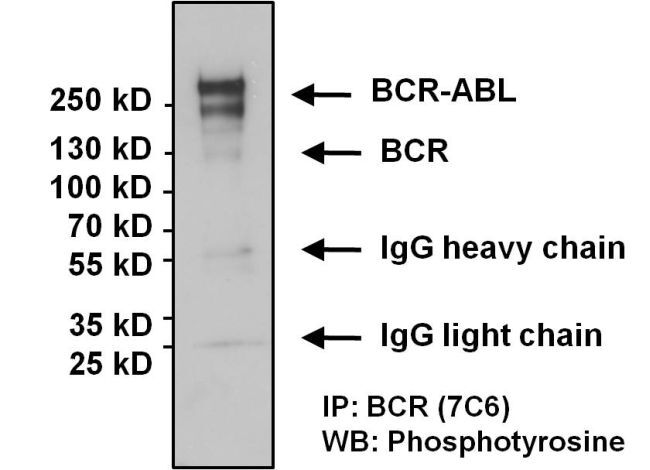
- Immunoprecipitation of BCR-ABL and BCR was performed using K562 whole cell lysate. Antigen-antibody complexes were formed by incubating 800 µg of lysate with 5 µg of a BCR monoclonal antibody (Product # MA1-153) overnight on a rocking platform at 4øC. The immune complexes were captured on 50 µl Protein A/G Agarose (Product # 20421), washed extensively, and eluted with 5X Lane Marker Reducing Sample Buffer (Product # 39000). The sample was resolved on a 4-20% Tris-HCl polyacrylamide gel, transferred to a PVDF membrane, and blocked with 5% BSA/TBS-0.1%Tween for 1 hour. The membrane was probed with a phosphotyrosine monoclonal antibody (detecting p-Tyr-BCR-ABL/p-Tyr-BCR) at a dilution of 1:1000 overnight rotating at 4øC, washed in TBST, and probed with a goat anti-mouse IgG-HRP secondary antibody (Product # 31430) at a dilution of 1:20,000 for 1 hour. Chemiluminescent detection was performed using SuperSignal West Pico (Product # 34080).

- Submitted by
- Invitrogen Antibodies (provider)
- Main image
- Experimental details
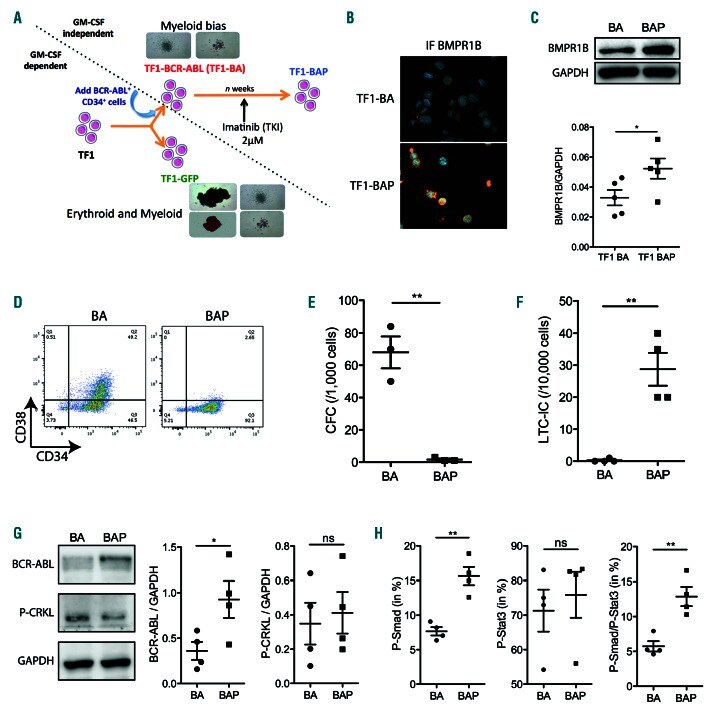
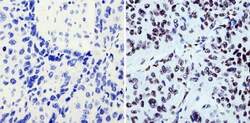
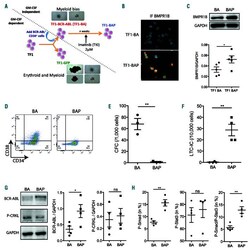
- Figure 2. The TF1-BAP model displays similar features as chronic myeloid leukemia (CML) persistent cells. (A) Strategy for generating TF1-BA and TF1-BAP cell lines. (B) Representative images of BMPR1B staining of TF1-BA and TF1-BAP cells. (C) Western blot analysis showing BMPR1B levels in TF1-BA and TF1-BAP cells; Scatter plot showing BMPR1B (GAPDH used as an internal control) n=5. (D) Representative FACS plots of TF1-BA and TF1-BAP cells analyzed for their CD34 and CD38 content. (E) Dot plot showing colony forming cell (CFC) activity from TF1-BA and TF1-BAP cells. (F) Dot plot showing long-term culture-initiating cell (LTC-IC) activity from TF1-BA and TF1-BAP cells. (G) Western blot analysis showing BCR-Abl and P-CRKL levels in TF1-BA and TF1-BAP cells. Bar graph showing BCR-Abl and P-CRKL (GAPDH used as an internal control); n=4. (H) TF1-BA and TF1-BAP cells were analyzed for their content in P-Smad1/5/8 and P-Stat3. Dot plots represent percentage of PSmad1/ 5/8 (left panel), P-Stat3 (middle panel) or double positive P-Smad1/5/8-P-Stat3 (right panel). (E-H) Unpaired t -test significant: * P