Explore
 Validate
 Learn
Learn Western blot
 Immunocytochemistry
Antibody data
- Antibody Data
- Antigen structure
- References [2]
- Comments [0]
- Validations
- Immunocytochemistry [2]
- Chromatin Immunoprecipitation [2]
- Other assay [3]
Submit
Validation data
Reference
Comment
Report error
- Product number
- MA1-196 - Provider product page

- Provider
- Invitrogen Antibodies
- Product name
- FLI1 Monoclonal Antibody (7.3)
- Antibody type
- Monoclonal
- Antigen
- Recombinant full-length protein
- Description
- MA1-196 detects FLI-1 in human and mouse samples. MA1-196 has been successfully used in western blot, immunofluorescence and ChIP assays.
- Reactivity
- Human, Mouse
- Host
- Mouse
- Isotype
- IgG
- Antibody clone number
- 7.3
- Vial size
- 100 μL
- Concentration
- 1 mg/mL
- Storage
- -20°C, Avoid Freeze/Thaw Cycles
Submitted references NKL Homeobox Genes NKX2-3 and NKX2-4 Deregulate Megakaryocytic-Erythroid Cell Differentiation in AML.
FLI1 mediates the selective expression of hypoxia-inducible factor 1 target genes in endothelial cells under hypoxic conditions.
Nagel S, Pommerenke C, Meyer C, MacLeod RAF
International journal of molecular sciences 2021 Oct 22;22(21)
International journal of molecular sciences 2021 Oct 22;22(21)
FLI1 mediates the selective expression of hypoxia-inducible factor 1 target genes in endothelial cells under hypoxic conditions.
Zeng G, Wang T, Zhang J, Kang YJ, Feng L
FEBS open bio 2021 Aug;11(8):2174-2185
FEBS open bio 2021 Aug;11(8):2174-2185
No comments: Submit comment
Supportive validation
- Submitted by
- Invitrogen Antibodies (provider)
- Main image
- Experimental details
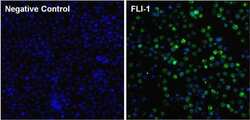
- Immunofluorescent analysis of FLI-1 (green) in Ramos cells. The cells were fixed with formalin for 15 minutes, permeabilized with 0.1% Triton X-100 in TBS for 10 minutes, and blocked with 5% Normal Goat Serum (Product # 31872) for 15 minutes at room temperature. Cells were stained with or without monoclonal antibody (Product # MA1-196), at a dilution of 1:100 overnight at 4°C, and then incubated with a DyLight 488 goat anti-mouse IgG secondary antibody (Product # 35503) at a dilution of 1:1000 for 30 minutes at room temperature (both panels, green). Nuclei (both panels, blue) were stained with Hoechst 33342 dye (Product # 62249). Images were taken on a Thermo Scientific ToxInsight at 20X magnification.
- Submitted by
- Invitrogen Antibodies (provider)
- Main image

- Experimental details
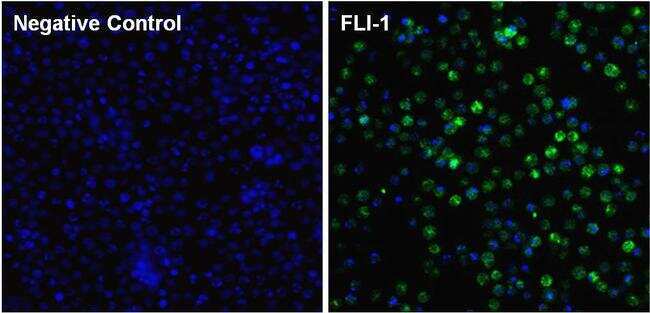
- Immunofluorescent analysis of FLI-1 (green) in Ramos cells. The cells were fixed with formalin for 15 minutes, permeabilized with 0.1% Triton X-100 in TBS for 10 minutes, and blocked with 5% Normal Goat Serum (Product # 31872) for 15 minutes at room temperature. Cells were stained with or without monoclonal antibody (Product # MA1-196), at a dilution of 1:100 overnight at 4°C, and then incubated with a DyLight 488 goat anti-mouse IgG secondary antibody (Product # 35503) at a dilution of 1:1000 for 30 minutes at room temperature (both panels, green). Nuclei (both panels, blue) were stained with Hoechst 33342 dye (Product # 62249). Images were taken on a Thermo Scientific ToxInsight at 20X magnification.
Supportive validation
- Submitted by
- Invitrogen Antibodies (provider)
- Main image
- Experimental details
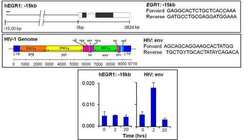
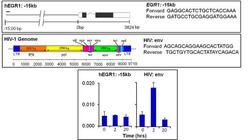
- Chromatin immunoprecipitation analysis of HIV1 FLI-1 was performed using cross-linked chromatin from Human 5A8 J-lat T lymphocytes culture latently infected with HIV1 and treated with 10 µg/mL PHA (phytohemaglutin) for 0, 2, and 20 hours. Immunoprecipitation was performed using a multiplex microplate Matrix ChIP assay with 1.0 µL/100 µL well volume of a FLI-1 monoclonal antibody (Product # MA1-196). Chromatin aliquots from 1 x 10⁵ cells were used per ChIP pull-down. Quantitative PCR data were done in quadruplicate using 1 µL of eluted DNA in 2 µL SYBR real-time PCR reactions containing primers shown to amplify exon-1 of the EGR1 gene or HIV ENV gene. PCR calibration curves were generated for each primer pair from a dilution series of sheared total genomic DNA. Quantitation of immunoprecipitated chromatin is presented as signal relative to the total amount of input chromatin. Results represent the mean +/- SEM for three experiments. Schematic representations of the EGR-1 and HIV1 ENV locus are shown above the data where boxes represent exons (black boxes equal translated regions, white boxes equal untranslated regions, the zigzag line represents an intron) and the straight line represents upstream sequence. Regions amplified by the primers are represented by black bars. Data courtesy of the Innovators Program.

- Submitted by
- Invitrogen Antibodies (provider)
- Main image
- Experimental details
- Chromatin immunoprecipitation analysis of HIV1 FLI-1 was performed using cross-linked chromatin from Human 5A8 J-lat T lymphocytes culture latently infected with HIV1 and treated with 10 µg/mL PHA (phytohemaglutin) for 0, 2, and 20 hours. Immunoprecipitation was performed using a multiplex microplate Matrix ChIP assay with 1.0 µL/100 µL well volume of a FLI-1 monoclonal antibody (Product # MA1-196). Chromatin aliquots from 1 x 10⁵ cells were used per ChIP pull-down. Quantitative PCR data were done in quadruplicate using 1 µL of eluted DNA in 2 µL SYBR real-time PCR reactions containing primers shown to amplify exon-1 of the EGR1 gene or HIV ENV gene. PCR calibration curves were generated for each primer pair from a dilution series of sheared total genomic DNA. Quantitation of immunoprecipitated chromatin is presented as signal relative to the total amount of input chromatin. Results represent the mean +/- SEM for three experiments. Schematic representations of the EGR-1 and HIV1 ENV locus are shown above the data where boxes represent exons (black boxes equal translated regions, white boxes equal untranslated regions, the zigzag line represents an intron) and the straight line represents upstream sequence. Regions amplified by the primers are represented by black bars. Data courtesy of the Innovators Program.

Supportive validation
- Submitted by
- Invitrogen Antibodies (provider)
- Main image

- Experimental details
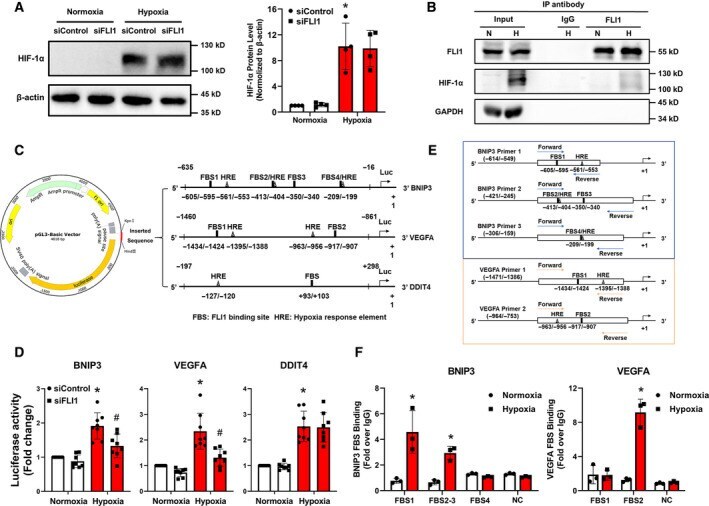
- Fig. 4 FLI1 interacts with HIF-1alpha and selectively regulates HIF-1 transcriptional. (A) HIF-1alpha protein level in the absence of FLI1 was detected. Cells treated as described in Fig. 3 . (B) Co-immunoprecipitation of proteins from EA.hy926 cells with or without exposure to 16 h of hypoxia was performed using an anti-IgG or anti-FLI1 antibody, and then, FLI1 and HIF-1alpha proteins were detected by western blotting. Anti-GAPDH antibody that served as a negative control. (C) Schematic diagram of the construction of the BNIP3 , VEGFA, and DDIT4 luciferase reporter vectors. The core promoter sequences of BNIP3 , VEGFA , or DDIT4 containing functional HREs and putative FBSs were inserted into individual pGL3-basic vectors. (D) HEK293T cells were transfected with either a mismatch control siRNA (siControl) or a FLI1-specific siRNA (siFLI1) for 24 h, following by a 48 h of transfection with the luciferase plasmids, with or without the final 16 h spent under hypoxic conditions. Luciferase reporter assay analysis of the luciferase activities of the BNIP3 , VEGFA, and DDIT4 promoters. (E) Schematic diagram of ChIP-qPCR specific primers for BNIP3 and VEGFA . (F) EA.hy926 cells were exposed or not to 16 h of hypoxia. Determination by ChIP-qPCR of the potential FLI1 binding sites of the BNIP3 promoter, and the VEGFA promoter. Data are presented as the mean +- SD, n = 3-8. * P < 0.05 compared with the normoxia siControl group (A, D) or normoxia group (F), # P < 0.05 compared with the
- Submitted by
- Invitrogen Antibodies (provider)
- Main image
- Experimental details
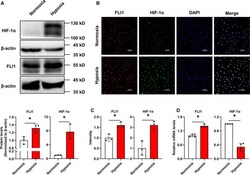
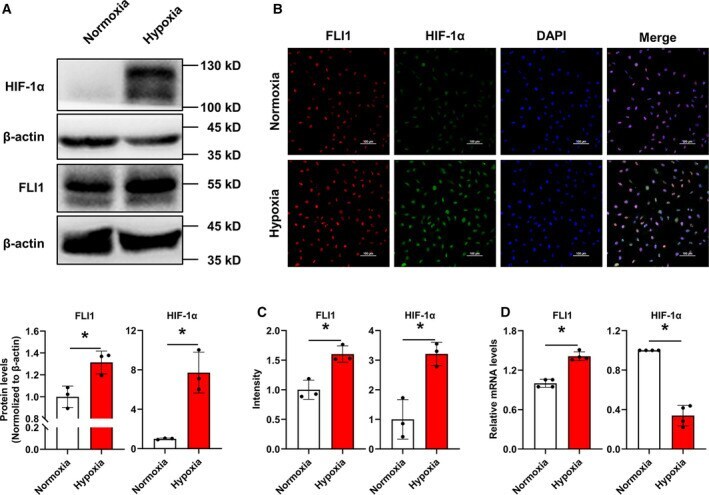
- Fig. 1 Hypoxia induces FLI1 and HIF-1alpha expression in EA.hy926 cells. EA.hy926 cells were exposed to 20% O 2 (normoxia) or 1% O 2 (hypoxia) for 8 h. (A) Changes in FLI1 and HIF-1alpha expression were evaluated by western blotting. The immunoblots are shown in the upper panel, and the quantitative data are shown in the lower panel. beta-actin served as a loading control. (B) The subcellular localization of FLI1 and HIF-1alpha was examined by immunofluorescence staining. Red, green, and blue staining indicates FLI1, HIF-1alpha, and the nuclear marker DAPI, respectively. Two to three visual fields were assessed for each slide. Scale bar, 100 mum. (C) The relative intensity of the FLI1 and HIF-1alpha fluorescence signals was quantified using imagej software. (D) Changes in FLI1 and HIF-1alpha mRNA expression levels were measured by RT-qPCR. Data are presented as mean +- SD, n = 3-4. * P < 0.05, as determined by Student's unpaired t -test against the normoxia group.
- Submitted by
- Invitrogen Antibodies (provider)
- Main image
- Experimental details
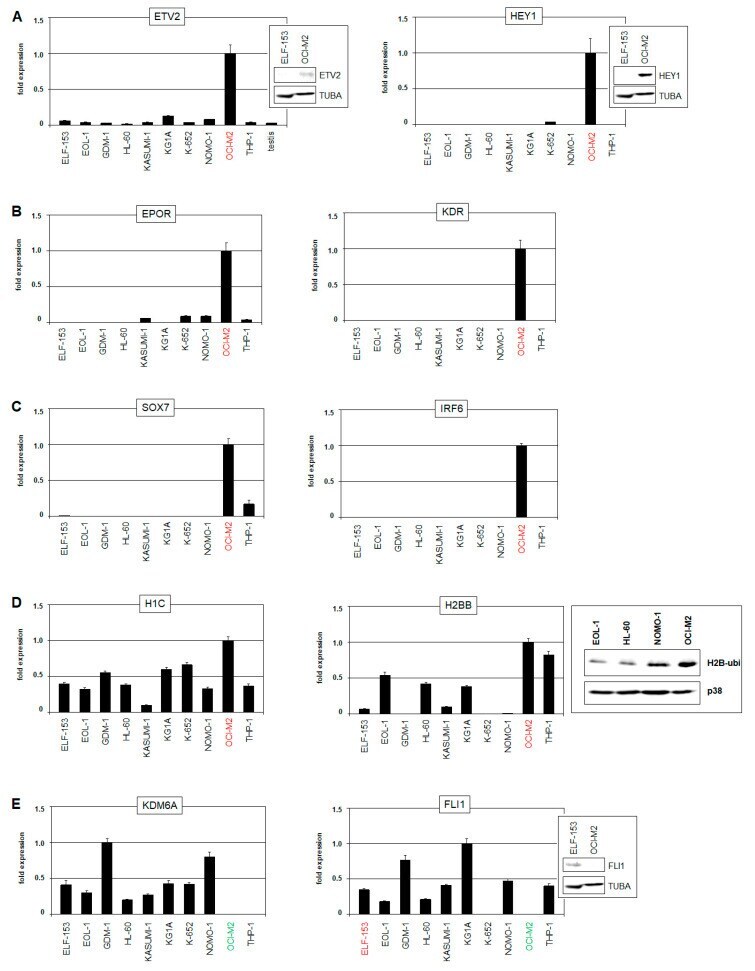
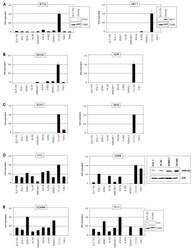
- Figure 3 RQ-PCR and Western blot analysis of selected genes in AML cell lines. ( A ) RQ-PCR and Western blot analyses of ETV2 ( left ) and HEY1 ( right ) demonstrate elevated expression levels in OCI-M2. ( B ) RQ-PCR analyses of EPOR ( left ) and KDR ( right ) demonstrate increased expression levels in OCI-M2. ( C ) RQ-PCR analyses of SOX7 ( left ) and IRF6 ( right ) demonstrate elevated expression levels in OCI-M2. ( D ) RQ-PCR analyses of H1C ( left ) and H2BB ( middle ) demonstrate high expression levels in OCI-M2. Raised levels of ubiquinated H2B are shown by Western blot analysis, using p38 as loading control ( right ). ( E ) RQ-PCR and Western blot analyses of KDM6A ( left ) and FLI1 ( right ) demonstrate reduced expression levels in OCI-M2. The cell lines OCI-M2 and ELF-153 are indicated in red and green. The expression levels of OCI-M2 were set as 1, except for analyses of KDM6A (GDM-1 was set as 1) and FLI1 (KG1A was set as 1).