Explore
 Validate
 Learn
Learn Western blot
 Immunocytochemistry
Antibody data
- Antibody Data
- Antigen structure
- References [6]
- Comments [0]
- Validations
- Immunocytochemistry [2]
- Immunohistochemistry [1]
- Other assay [9]
Submit
Validation data
Reference
Comment
Report error
- Product number
- PA5-20176 - Provider product page

- Provider
- Invitrogen Antibodies
- Product name
- CRMP1 Polyclonal Antibody
- Antibody type
- Polyclonal
- Antigen
- Synthetic peptide
- Description
- A suggested positive control is Caco-2 cell lysate. PA5-20176 can be used with blocking peptide PEP-0293.
- Reactivity
- Human, Mouse, Rat
- Host
- Rabbit
- Isotype
- IgG
- Vial size
- 100 μg
- Concentration
- 1 mg/mL
- Storage
- Maintain refrigerated at 2-8°C for up to 3 months. For long term storage store at -20°C
Submitted references Apelin-13 Pretreatment Promotes the Cardioprotective Effect of Mesenchymal Stem Cells against Myocardial Infarction by Improving Their Survival.
Cardiac-Specific Deletion of Orai3 Leads to Severe Dilated Cardiomyopathy and Heart Failure in Mice.
Haemin pre-treatment augments the cardiac protection of mesenchymal stem cells by inhibiting mitochondrial fission and improving survival.
FGF21 Mediates Mesenchymal Stem Cell Senescence via Regulation of Mitochondrial Dynamics.
Adipose-Derived Mesenchymal Stem Cells Isolated from Patients with Abdominal Aortic Aneurysm Exhibit Senescence Phenomena.
Vascular progenitor cell senescence in patients with Marfan syndrome.
Chen G, Liang X, Han Q, Mai C, Shi L, Shao Z, Hong Y, Lin F, Li M, Hu B, Li X, Zhang Y
Stem cells international 2022;2022:3742678
Stem cells international 2022;2022:3742678
Cardiac-Specific Deletion of Orai3 Leads to Severe Dilated Cardiomyopathy and Heart Failure in Mice.
Gammons J, Trebak M, Mancarella S
Journal of the American Heart Association 2021 Apr 20;10(8):e019486
Journal of the American Heart Association 2021 Apr 20;10(8):e019486
Haemin pre-treatment augments the cardiac protection of mesenchymal stem cells by inhibiting mitochondrial fission and improving survival.
Deng R, Liu Y, He H, Zhang H, Zhao C, Cui Z, Hong Y, Li X, Lin F, Yuan D, Liang X, Zhang Y
Journal of cellular and molecular medicine 2020 Jan;24(1):431-440
Journal of cellular and molecular medicine 2020 Jan;24(1):431-440
FGF21 Mediates Mesenchymal Stem Cell Senescence via Regulation of Mitochondrial Dynamics.
Li X, Hong Y, He H, Jiang G, You W, Liang X, Fu Q, Han S, Lian Q, Zhang Y
Oxidative medicine and cellular longevity 2019;2019:4915149
Oxidative medicine and cellular longevity 2019;2019:4915149
Adipose-Derived Mesenchymal Stem Cells Isolated from Patients with Abdominal Aortic Aneurysm Exhibit Senescence Phenomena.
Huang X, Zhang H, Liang X, Hong Y, Mao M, Han Q, He H, Tao W, Jiang G, Zhang Y, Li X
Oxidative medicine and cellular longevity 2019;2019:1305049
Oxidative medicine and cellular longevity 2019;2019:1305049
Vascular progenitor cell senescence in patients with Marfan syndrome.
He H, Yu B, Liu Z, Ye G, You W, Hong Y, Lian Q, Zhang Y, Li X
Journal of cellular and molecular medicine 2019 Jun;23(6):4139-4152
Journal of cellular and molecular medicine 2019 Jun;23(6):4139-4152
No comments: Submit comment
Supportive validation
- Submitted by
- Invitrogen Antibodies (provider)
- Main image
- Experimental details
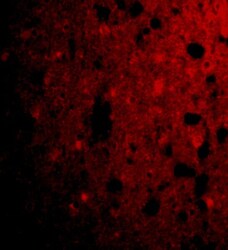
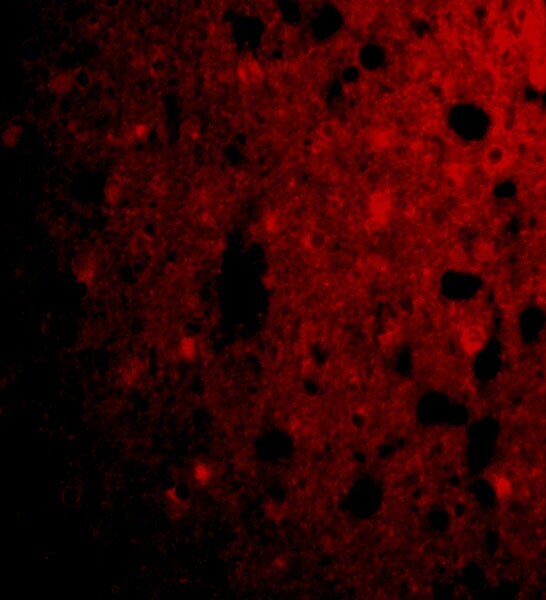
- Immunofluorescence of CRMP1 in Human Brain cells with CRMP1 Polyclonal Antibody (Product # PA5-20176) at 20 µg/mL.

- Submitted by
- Invitrogen Antibodies (provider)
- Main image

- Experimental details
- Immunofluorescence of CRMP1 in Human Brain cells with CRMP1 Polyclonal Antibody (Product # PA5-20176) at 20 µg/mL.
Supportive validation
- Submitted by
- Invitrogen Antibodies (provider)
- Main image
- Experimental details
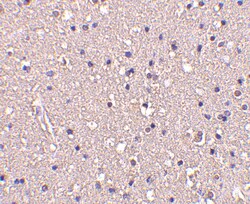
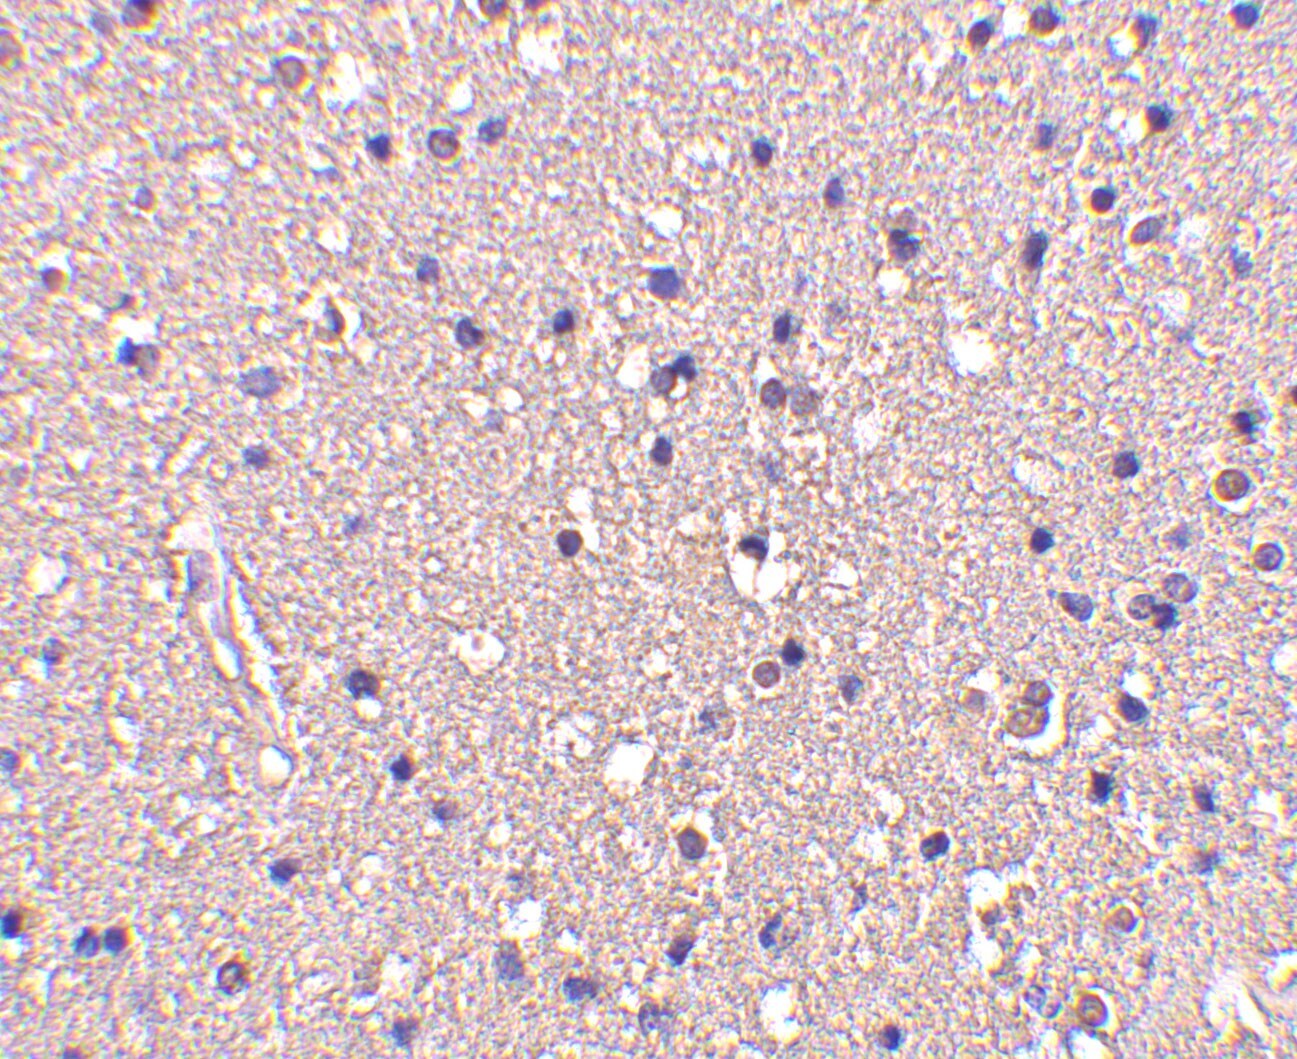
- Immunohistochemistry of CRMP1 in human brain tissue with CRMP1 Polyclonal Antibody (Product # PA5-20176) at 10 µg/mL.
Supportive validation
- Submitted by
- Invitrogen Antibodies (provider)
- Main image
- Experimental details
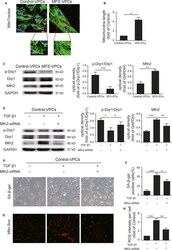
- Figure 6 TGF-beta1 induces mitochondrial fusion in vascular progenitor cells (VPCs). A, Representative images of mitochondrial morphology determined by MitoTracker staining in control-VPCs and Marfan syndrome (MFS)-VPCs. B, The mitochondrial length in control-VPCs and MFS-VPCs was analysed. C, Western blotting and quantitative analysis of the level of p-Drp1 and Mfn2 protein in control-VPCs and MFS-VPCs. D, Western blotting and quantitative analysis of the level of p-Drp1 and Mfn2 protein in control-VPCs that received TGF-beta1 or TGF-beta1 + Mfn2-siRNA treatment. E, Representative images of SA-beta-gal staining in control-VPCs that received TGF-beta1 or TGF-beta1 + Mfn2-siRNA treatment. F, The SA-beta-gal positive cells in control-VPCs that received TGF-beta1 or TGF-beta1 + Mfn2-siRNA treatment were calculated and are presented as a percentage of total cells. G, Representative images of Mito-Sox staining in control-VPCs that received TGF-beta1 or TGF-beta1 + Mfn2-siRNA treatment. H, Quantitative analysis of ROS generation in control-VPCs that received TGF-beta1 or TGF-beta1 + Mfn2-siRNA treatment. Data are expressed as mean +- SEM (n = 3). * P < 0.05, ** P < 0.01, *** P < 0.001. Scale bar = 100 mum

- Submitted by
- Invitrogen Antibodies (provider)
- Main image

- Experimental details
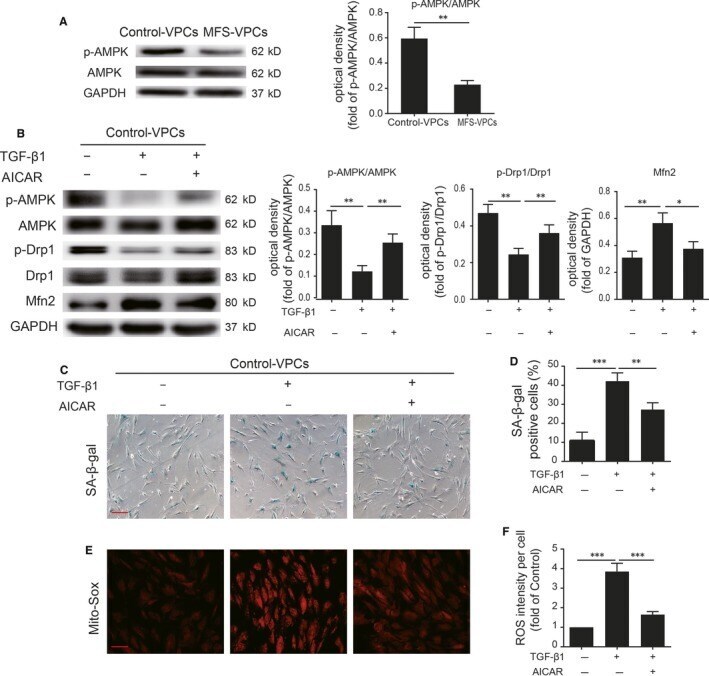
- Figure 7 Adenosine monophosphate-activated protein kinase (AMPK) signalling is involved in TGF-beta1 mediation of mitochondrial dynamics in vascular progenitor cells. A, Western blotting and quantitative analysis of the level of p-AMPK protein in control-vascular progenitor cells (VPCs) and Marfan syndrome (MFS)-VPCs. B, Western blotting and quantitative analysis of the level of p-AMPK, p-Drp1 and Mfn2 protein in control-VPCs that received TGF-beta1 or TGF-beta1 + AICAR treatment. C, Representative images of SA-beta-gal staining in control-VPCs that received TGF-beta1 or TGF-beta1 + AICAR treatment. D, The SA-beta-gal positive cells in control-VPCs that received TGF-beta1 or TGF-beta1 + AICAR treatment were calculated and are presented as a percentage of the total cells. E, Representative images of Mito-Sox staining in control-VPCs that received TGF-beta1 or TGF-beta1 + AICAR treatment. F, Quantitative analysis of ROS generation in control-VPCs that received TGF-beta1 or TGF-beta1 + AICAR treatment. Data are expressed as mean +- SEM (n = 3). * P < 0.05, ** P < 0.01, *** P < 0.001. Scale bar = 100 mum
- Submitted by
- Invitrogen Antibodies (provider)
- Main image

- Experimental details
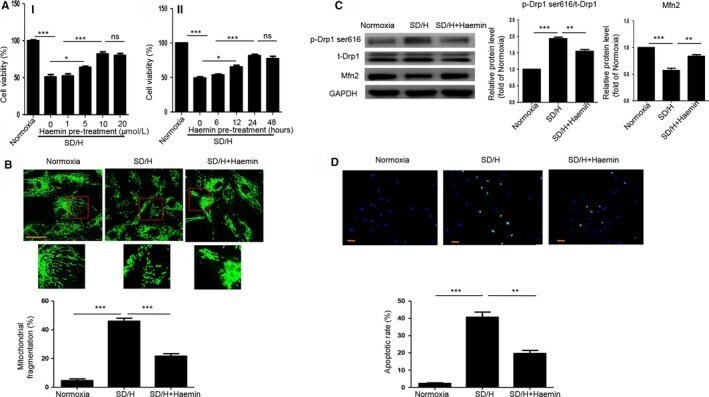
- Figure 1 Haemin pre-treatment suppresses serum deprivation and hypoxia (SD/H)-induced mitochondrial fission and apoptosis of bone marrow-mesenchymal stem cell (BM-MSCs). A, The cell viability of BM-MSCs with or without haemin (1, 5, 10, 20 mumol/L) pre-treatment for 24 hours under normoxia or SD/H was determined by CCK-8 assay (i). The cell viability of BM-MSCs with or without 10 mumol/L haemin pre-treatment for 6, 12, 24 or 48 hours under normoxia or SD/H was determined by CCK-8 assay (ii). B, Representative images of the fragmented mitochondria (magnification of 20x) and quantitative analysis of fragmented mitochondria in BM-MSCs and haemin-pretreated BM-MSCs under normoxia or SD/H. C, Western blotting and quantitative analysis for the expression of Mfn2 and p-Drp1 ser616 in BM-MSCs and haemin-pretreated BM-MSCs under normoxia or SD/H exposure. D, Representative images of TUNEL staining (magnification of 20x) and quantitative analysis of the apoptosis of BM-MSCs or haemin-pretreated BM-MSCs under normoxia or SD/H. Data are expressed as the mean +- SEM. n = 3. Scale bar = 50 mum. *P < . 05, **P < . 01, ***P < . 001. ns, not significant
- Submitted by
- Invitrogen Antibodies (provider)
- Main image
- Experimental details
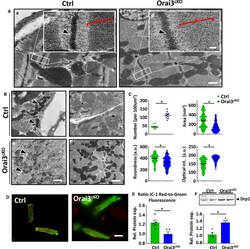
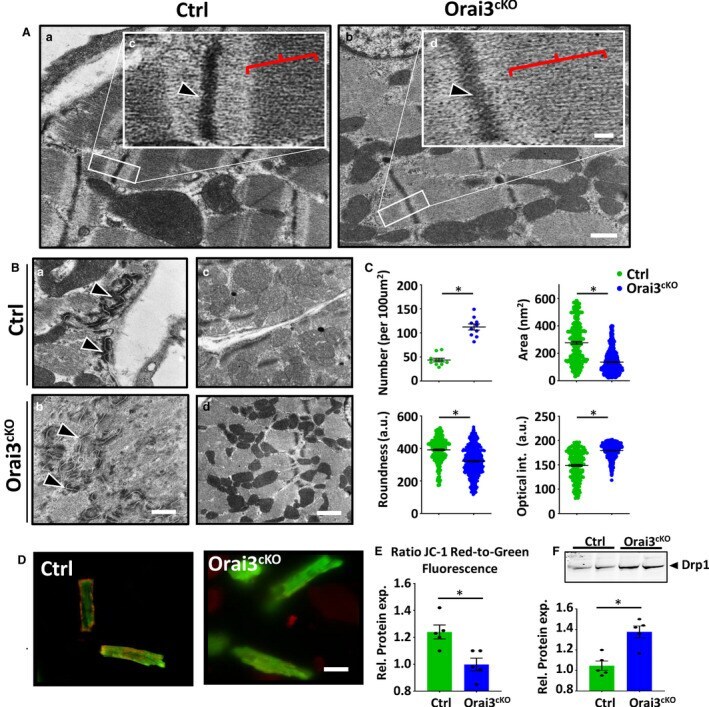
- Figure 3 Sarcomere and mitochondrial dysfunction in Orai3 cKO mice. A , a and b showing representative transmission electron microscopy pictures of the sarcomere structure of cardiac muscle from 1-month-old male mice. Scale bar=500 nm. High magnification images (inset, c-d) depicting normal Z-line (arrowhead) and M-band (red parenthesis) in the control and disorganized Z-line and shallow M-band in Orai3 cKO sections. Scale bar=10 nm. B , Cross-sections through intercalated disc showing large mixed-type junction (area composita) surrounded by two dense desmosome structures (a and b, black arrows). Representative ultrastructural images of left ventricle from control and Orai3 cKO hearts showing normal (control) and altered (Orai3 cKO ) mitochondrial morphology and density (c and d). C , Graphs summarizing mitochondria number, mitochondrial size, mean cross-sectional area, and optical. Data are expressed as mean+-SEM t-test, * P
- Submitted by
- Invitrogen Antibodies (provider)
- Main image
- Experimental details
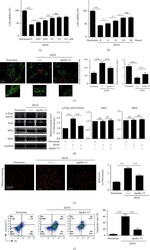
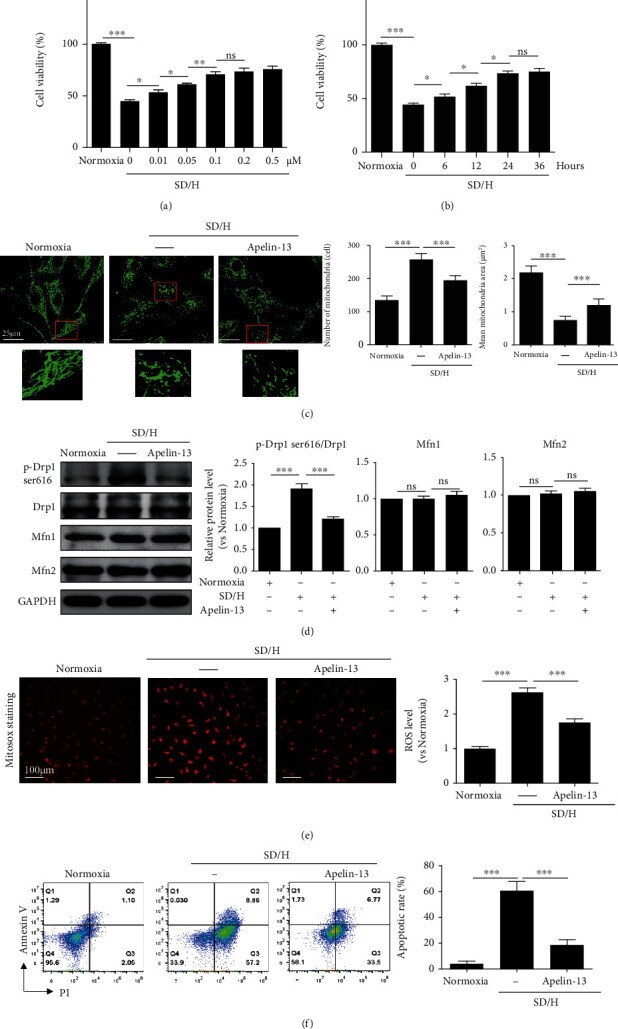
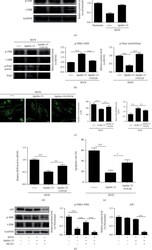
- Apelin-13 pretreatment inhibits SD/H-induced mitochondrial fragmentation and apoptosis of MSCs. (a) CCK-8 assay showed the cell viability of MSCs with or without Apelin-13 (0.01, 0.05, 0.1, 0.5, and 1 nM) pretreatment for 24 hours under normoxic or SD/H conditions. (b) CCK-8 assay showed the cell viability of MSCs with or without 0.1 nM Apelin-13 pretreatment for 6, 12, 24, or 36 hours under normoxic or SD/H conditions. (c) Representative images of MitoTracker staining and quantitative analysis of the mitochondrial number and mean mitochondrial area in MSCs and Apelin-13-pretreated MSCs under normoxic or SD/H conditions. (d) Western blotting and quantitative analysis of the protein level of Mfn1/2 and p-Drp1 ser616 in MSCs and Apelin-13-pretreated MSCs under normoxia or SD/H challenge. (e) Representative images of Mito-Sox staining and quantitative analysis of ROS generation in MSCs and Apelin-13-pretreated MSCs under normoxic or SD/H conditions. (f) Representative images of Annexin V/PI staining and quantitative analysis of the apoptotic rate in MSCs and Apelin-13-pretreated MSCs under normoxic or SD/H conditions. n = 3 biological replicates for each group. Data are expressed as mean +- SD. * p < 0.05, ** p < 0.01, *** p < 0.001. ns, not significant.
- Submitted by
- Invitrogen Antibodies (provider)
- Main image
- Experimental details
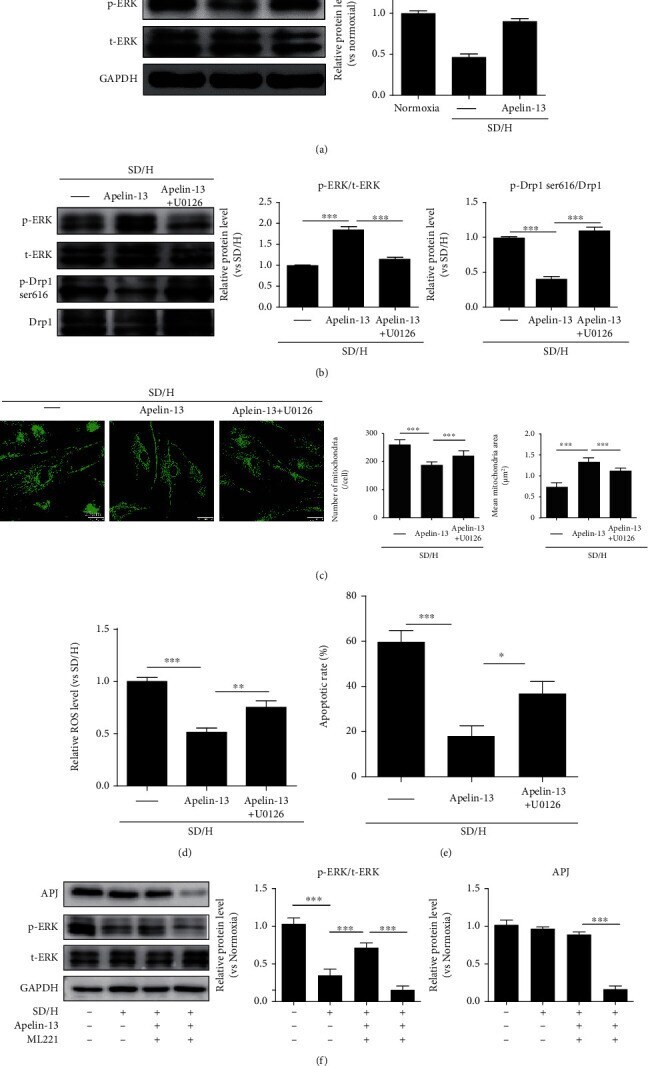
- Apelin-13 pretreatment inhibits SD/H-induced mitochondrial fragmentation in MSCs via regulation of the ERK signaling pathway. (a) Western blotting and quantitative analysis for p-ERK and t-ERK protein level in MSCs and Apelin-13-pretreated MSCs under normoxic or SD/H conditions. (b) Western blotting and quantitative analysis for p-ERK, t-ERK, p-Drp1 ser616, and Drp1 protein level in MSCs, Apelin-13-pretreated MSCs, or Apelin-13-pretreated MSCs with U0126 under SD/H condition. (c) Representative images of MitoTracker staining and quantitative analysis of the number of mitochondria and mean mitochondrial area in MSCs, Apelin-13-pretreated MSCs or Apelin-13-pretreated MSCs with U0126 under SD/H condition. (d) Quantitative analysis of ROS generation in MSCs, Apelin-13-pretreated MSCs, or Apelin-13-pretreated MSCs with U0126 under SD/H condition. (e) Quantitative analysis of the apoptotic rate of MSCs, Apelin-13-pretreated MSCs, or Apelin-13-pretreated MSCs with U0126 under SD/H condition. (f) Western blotting and quantitative analysis for APJ, p-ERK, and t-ERK protein level in MSCs, Apelin-13-pretreated MSCs, or Apelin-13-pretreated MSCs with ML221 under normoxic or SD/H conditions. n = 3 biological replicates for each group. Data are expressed as mean +- SD. ** p < 0.01, *** p < 0.001.
- Submitted by
- Invitrogen Antibodies (provider)
- Main image
- Experimental details
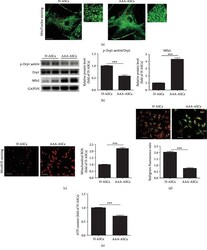
- Figure 4 Mitochondrial function was decreased in AAA-ASCs. (a) Representative images of mitochondrial morphology determined by MitoTracker staining in H-ASCs and AAA-ASCs. Scale bar = 25 mu m. (b) Western blotting and quantitative analysis of the expression level of p-Drp1 ser616/Drp1 and Mfn2 in H-ASCs and AAA-ASCs. (c) Representative images of ROS determined by MitoSOX staining and quantitative analysis of ROS generation in H-ASCs and AAA-ASCs. Scale bar = 100 mu m. (d) Representative images of MMP determined by JC-1 staining and quantitative analysis of MMP in H-ASCs and AAA-ASCs. (e) The intracellular ATP level in H-ASCs and AAA-ASCs. Data are expressed as mean +- SEM. n = 3. *** p < 0.001.

- Submitted by
- Invitrogen Antibodies (provider)
- Main image

- Experimental details
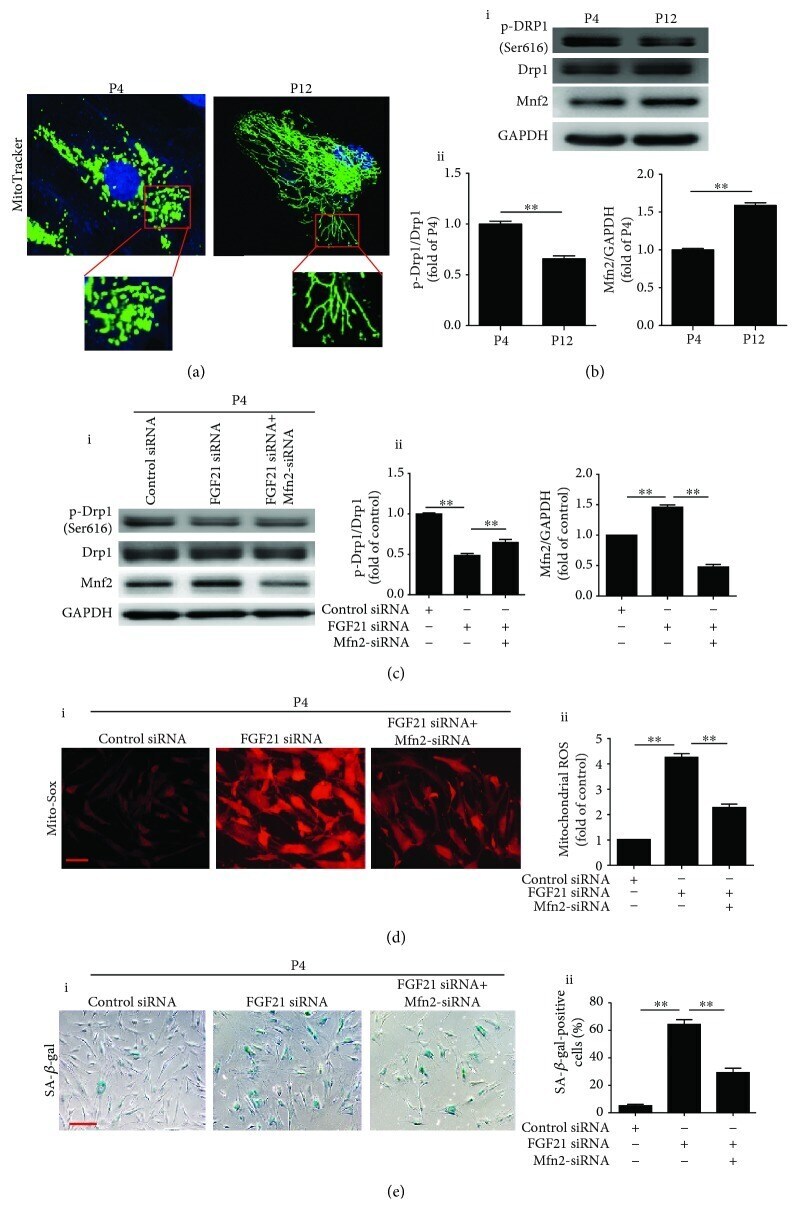
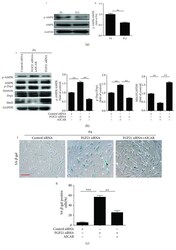
- Figure 4 Silencing FGF21 induces ROS generation via regulation of mitochondrial dynamics. (a) Representative images of MitoTracker staining in BM-MSCs at P4 and P12. (b) Western blotting and quantitative analysis of the levels of p-Drp1/Drp1 and Mfn2 proteins in BM-MSCs at P4 and P12 (i, ii). (c) Western blotting and quantitative analysis of the level of p-Drp1/Drp1 and Mfn2 proteins in control siRNA or FGF21 siRNA or FGF21 siRNA+Mfn2 siRNA-treated BM-MSCs at P4 (i, ii). (d) Representative images of Mito-Sox staining in BM-MSCs at P4 from the control siRNA or FGF21 siRNA or FGF21 siRNA+Mfn2 siRNA-treated group (i). Quantitative analysis of the ROS generation in control siRNA or FGF21 siRNA or FGF21 siRNA+Mfn2 siRNA-treated BM-MSCs at P4 (ii). (e) Representative images of SA- beta -gal staining in BM-MSCs at P4 from the control siRNA or FGF21 siRNA or FGF21 siRNA+Mfn2 siRNA-treated group (i). Percentage of SA- beta -gal-positive senescent cells in control siRNA or FGF21 siRNA or FGF21 siRNA+Mfn2 siRNA-treated BM-MSCs at P4 (ii). Data are expressed as mean +- SEM with n = 3 per group. ** p < 0.01. Scale bar = 100 mu m.
- Submitted by
- Invitrogen Antibodies (provider)
- Main image
- Experimental details
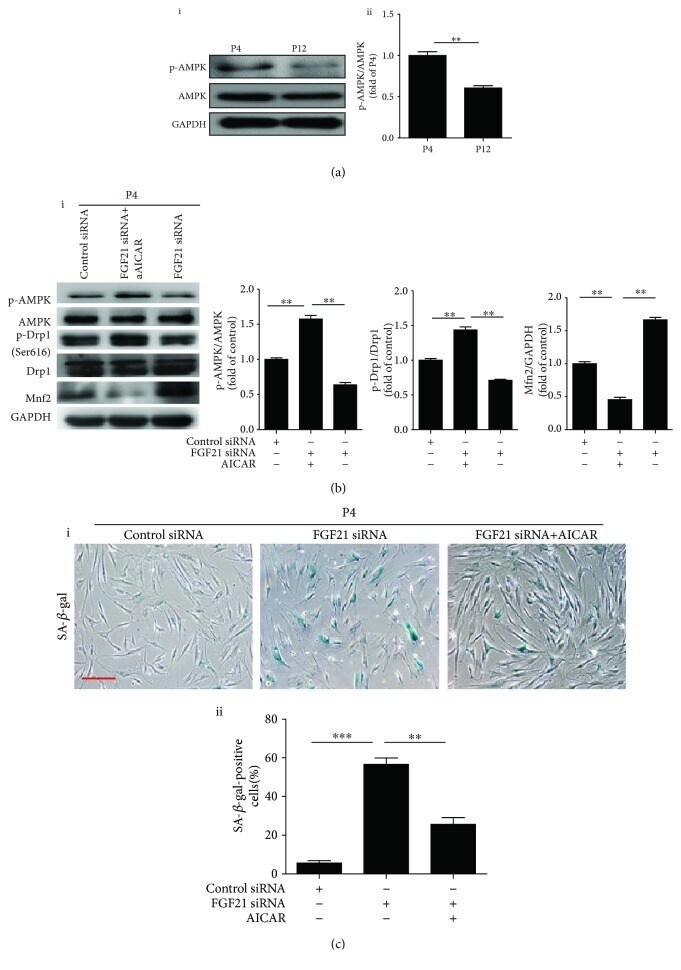
- Figure 5 FGF21 regulates mitochondrial dynamics via mediation of AMPK activation. (a) Western blotting and quantitative analysis of the level of p-AMPK in BM-MSCs at P4 and P12 (i, ii). (b) Western blotting and quantitative analysis of the level of p-AMPK, p-Drp1, and Mfn2 in BM-MSCs at P4 from the control siRNA or FGF21 siRNA or FGF21 siRNA+AICAR-treated group (i, ii). (c) Representative images of SA- beta -gal staining in BM-MSCs at P4 from the control siRNA or FGF21 siRNA or FGF21 siRNA+AICAR-treated group (i). Percentage of SA- beta -gal-positive senescent cells in control siRNA or FGF21 siRNA or FGF21 siRNA+AICAR-treated BM-MSCs at P4 (ii). Data are expressed as mean +- SEM with n = 3 per group. * p < 0.05, ** p < 0.01. Scale bar = 100 mu m.