 Explore
 Validate
 Learn
Learn Western blot
Antibody data
- Antibody Data
- Antigen structure
- References [8]
- Comments [0]
- Validations
- Western blot [3]
- Immunocytochemistry [10]
- Other assay [4]
Submit
Validation data
Reference
Comment
Report error
- Product number
- PA1-10003 - Provider product page

- Provider
- Invitrogen Antibodies
- Product name
- Vimentin Polyclonal Antibody
- Antibody type
- Polyclonal
- Antigen
- Recombinant full-length protein
- Description
- PA1-10003 can be used to study stem cells and generally to reveal the intermediate filament cytoskeleton. The immunogen used to generate this antibody was full length recombinant human vimentin. The antibody works well on all mammals tested to date, and it was generated in chicken by standard procedures and immunoglobulin was extracted from egg yolk.
- Reactivity
- Human, Mouse, Rat, Bovine, Chicken/Avian, Porcine
- Host
- Chicken/Avian
- Isotype
- IgY
- Vial size
- 100 μL
- Concentration
- Conc. Not Determined
- Storage
- 4°C
Submitted references Functional microvascularization of human myocardium in vitro.
Stimulated emission depletion microscopy with a single depletion laser using five fluorochromes and fluorescence lifetime phasor separation.
Cardiac Fibroblasts Mediate a Sexually Dimorphic Fibrotic Response to β-Adrenergic Stimulation.
Defining the Cardiac Fibroblast Secretome in a Fibrotic Microenvironment.
FDPS promotes glioma growth and macrophage recruitment by regulating CCL20 via Wnt/β-catenin signalling pathway.
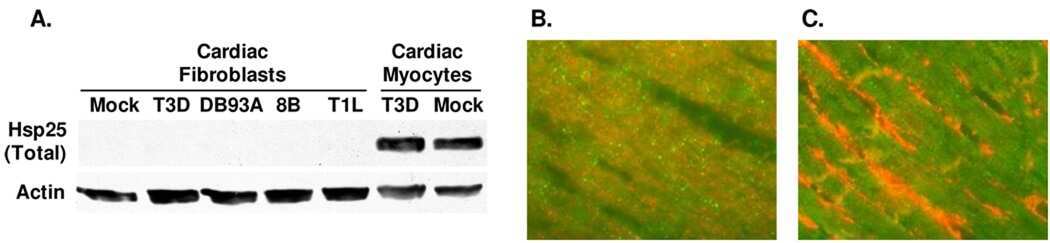
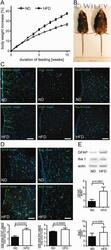
Tanycytes and a differential fatty acid metabolism in the hypothalamus.
Identification of interstitial Cajal-like cells in the human thoracic duct.
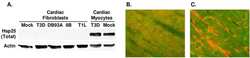
Proteomic analysis reveals virus-specific Hsp25 modulation in cardiac myocytes.
King O, Cruz-Moreira D, Sayed A, Kermani F, Kit-Anan W, Sunyovszki I, Wang BX, Downing B, Fourre J, Hachim D, Randi AM, Stevens MM, Rasponi M, Terracciano CM
Cell reports methods 2022 Sep 19;2(9):100280
Cell reports methods 2022 Sep 19;2(9):100280
Stimulated emission depletion microscopy with a single depletion laser using five fluorochromes and fluorescence lifetime phasor separation.
Gonzalez Pisfil M, Nadelson I, Bergner B, Rottmeier S, Thomae AW, Dietzel S
Scientific reports 2022 Aug 18;12(1):14027
Scientific reports 2022 Aug 18;12(1):14027
Cardiac Fibroblasts Mediate a Sexually Dimorphic Fibrotic Response to β-Adrenergic Stimulation.
Peter AK, Walker CJ, Ceccato T, Trexler CL, Ozeroff CD, Lugo KR, Perry AR, Anseth KS, Leinwand LA
Journal of the American Heart Association 2021 Jun;10(11):e018876
Journal of the American Heart Association 2021 Jun;10(11):e018876
Defining the Cardiac Fibroblast Secretome in a Fibrotic Microenvironment.
Ceccato TL, Starbuck RB, Hall JK, Walker CJ, Brown TE, Killgore JP, Anseth KS, Leinwand LA
Journal of the American Heart Association 2020 Oct 20;9(19):e017025
Journal of the American Heart Association 2020 Oct 20;9(19):e017025
FDPS promotes glioma growth and macrophage recruitment by regulating CCL20 via Wnt/β-catenin signalling pathway.
Chen Z, Chen G, Zhao H
Journal of cellular and molecular medicine 2020 Aug;24(16):9055-9066
Journal of cellular and molecular medicine 2020 Aug;24(16):9055-9066
Tanycytes and a differential fatty acid metabolism in the hypothalamus.
Hofmann K, Lamberz C, Piotrowitz K, Offermann N, But D, Scheller A, Al-Amoudi A, Kuerschner L
Glia 2017 Feb;65(2):231-249
Glia 2017 Feb;65(2):231-249
Identification of interstitial Cajal-like cells in the human thoracic duct.
Briggs Boedtkjer D, Rumessen J, Baandrup U, Skov Mikkelsen M, Telinius N, Pilegaard H, Aalkjaer C, Hjortdal V
Cells, tissues, organs 2013;197(2):145-58
Cells, tissues, organs 2013;197(2):145-58
Proteomic analysis reveals virus-specific Hsp25 modulation in cardiac myocytes.
Li L, Sevinsky JR, Rowland MD, Bundy JL, Stephenson JL, Sherry B
Journal of proteome research 2010 May 7;9(5):2460-71
Journal of proteome research 2010 May 7;9(5):2460-71
No comments: Submit comment
Supportive validation
- Submitted by
- Invitrogen Antibodies (provider)
- Main image

- Experimental details
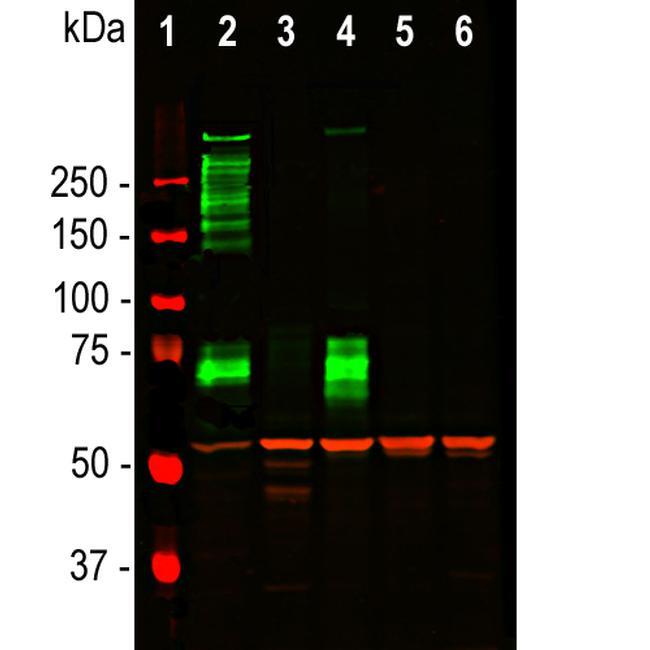
- Western blot analysis of a Vimentin in tissue and cell lysates using a Vimentin polyclonal antibody (Product # PA1-10003) at a dilution 1:5,000 as seen in red, and costained using a MAP2C/D monoclonal antibody at a dilution 1:5,000 as seen in green. 1) protein standard (red), 2) rat whole brain lysate, 3) HeLa, 4) SH-SY5Y, 5) HEK293, and 6) NIH-3T3 cell lysates. Vimentin protein is bound showing a single band at ~50 kDa., Full length MAP2A/2B is depicted by multiple bands around 280 kDa, and MAP2C/D isotypes ~70 kDa bands. MAP2 isotypes are seen only in extracts containing neuronal lineage cells.
- Submitted by
- Invitrogen Antibodies (provider)
- Main image

- Experimental details
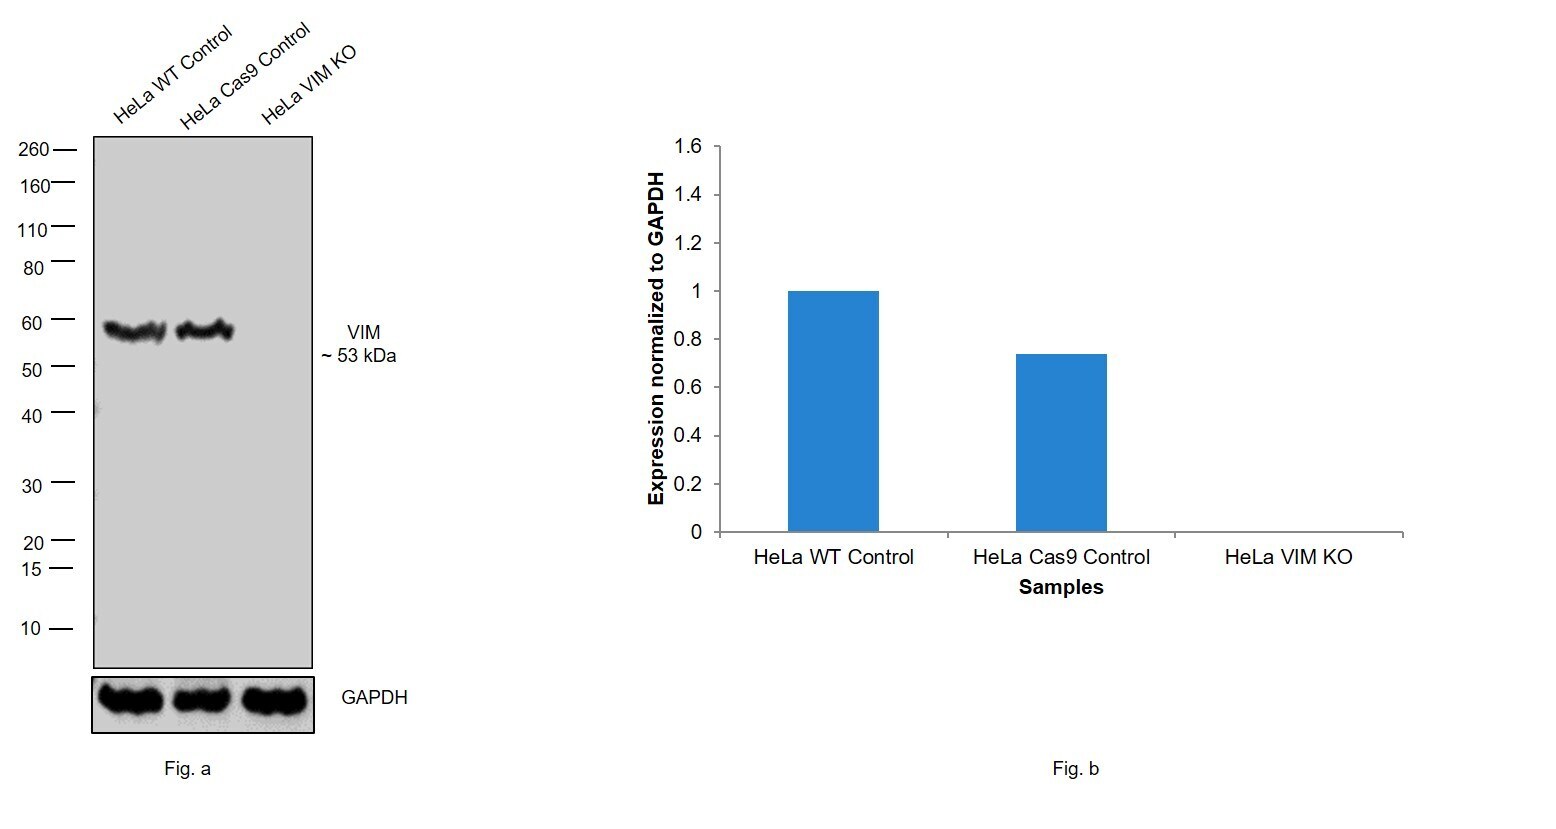
- Knockout of Vimentin was achieved by CRISPR-Cas9 genome editing using LentiArray™ Lentiviral sgRNA (Product # A32042) and LentiArray Cas9 Lentivirus (Product # A32064). Western blot analysis of Vimentin was performed by loading 30 µg of HeLa wild type (Lane 1), HeLa CAS9 (Lane 2) and HeLa Vimentin KO (Lane 3) whole cell extracts. The samples were electrophoresed using Novex® NuPAGE® 4-12% Bis-Tris Protein Gel (Product # NP0321BOX). Resolved proteins were then transferred onto a nitrocellulose membrane (Product # IB23001) by iBlot® 2 Dry Blotting System (Product # IB21001). The blot was probed with Anti-Vimentin Polyclonal Antibody (Product # PA1-10003) using 1:2,000 dilution and Goat anti-Chicken IgY (H+L) Secondary Antibody, HRP (Product # A16054, 1:4,000 dilution) using the iBright FL 1000 (Product # A32752). Chemiluminescent detection was performed using Novex® ECL Chemiluminescent Substrate Reagent Kit (Product # WP20005). Loss of signal upon CRISPR mediated knockout (KO) using the LentiArray™ CRISPR product line confirms that antibody is specific to Vimentin.
- Submitted by
- Invitrogen Antibodies (provider)
- Main image

- Experimental details
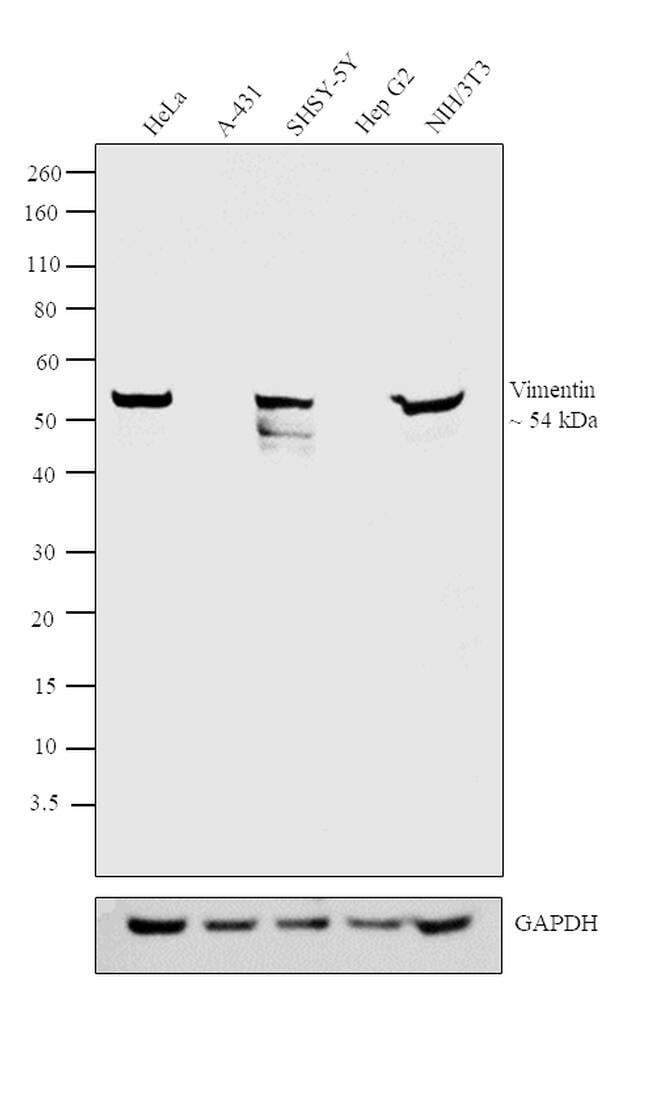
- Western blot analysis was performed on Whole cell extracts (30 µg lysate) of HeLa (Lane 1), A-431 (Lane 2), SHSY-5Y (Lane 3), Hep G2 (Lane 4) and NIH/3T3 (Lane 5). The blot was probed with Anti-Vimentin Polyclonal Antibody (Product # PA1-10003, 1:2000 dilution) and detected by chemiluminescence using Goat anti-Chicken IgY (H+L) Secondary Antibody, HRP (Product # A16054, 0.25 µg/ml, 1:4000 dilution). A 54 kDa band corresponding to Vimentin was observed across all the cell lines positive for Vimentin (Lanes 1, 3 and 5), while this band was absent in the cell lines which do not express Vimentin protein (Lanes 2 and 4).
Supportive validation
- Submitted by
- Invitrogen Antibodies (provider)
- Main image
- Experimental details
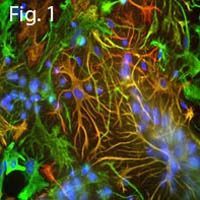
- Immunofluorescent analysis of Vimentin using a polyclonal antibody (Product # PA1-10003).
- Submitted by
- Invitrogen Antibodies (provider)
- Main image

- Experimental details
- Immunofluorescent analysis of Vimentin using a polyclonal antibody (Product # PA1-10003).
- Submitted by
- Invitrogen Antibodies (provider)
- Main image

- Experimental details
- Immunofluorescent analysis of Vimentin using a polyclonal antibody (Product # PA1-10003).
- Submitted by
- Invitrogen Antibodies (provider)
- Main image

- Experimental details
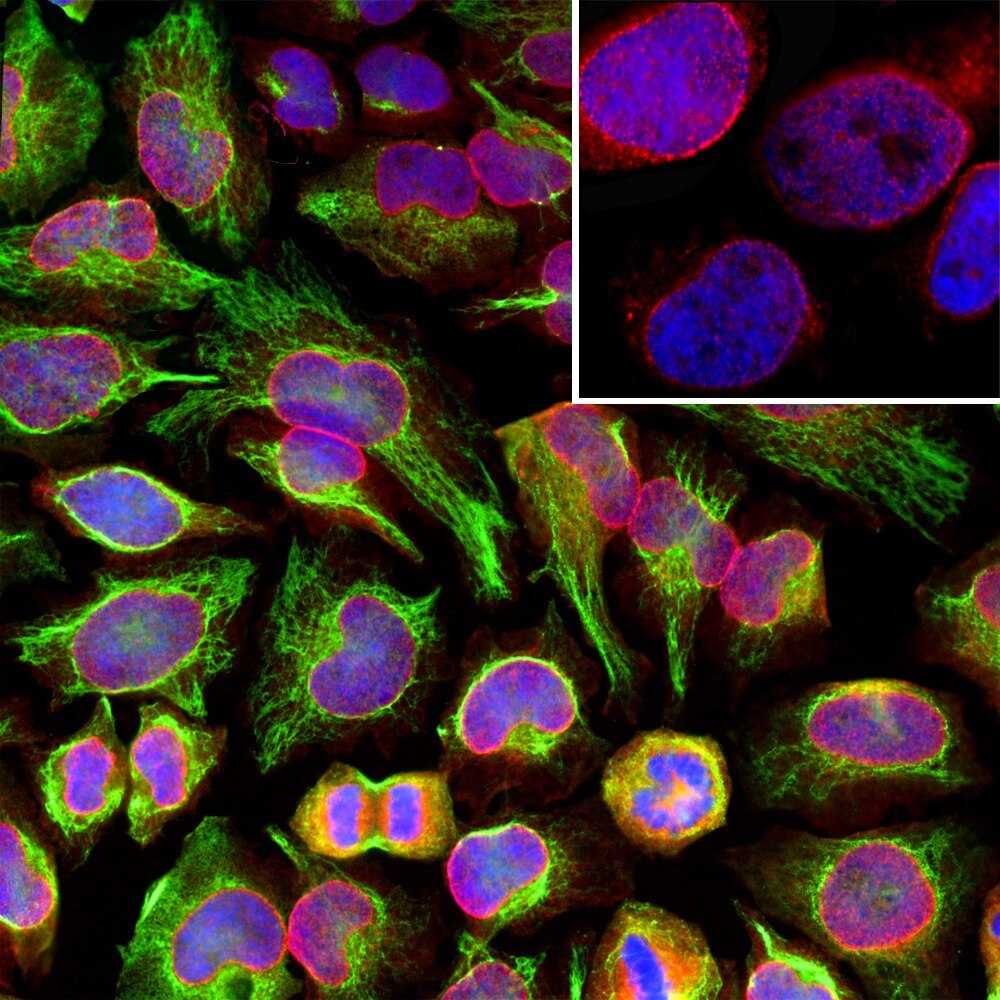
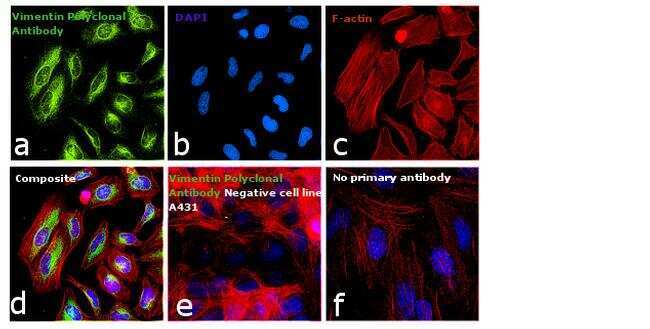
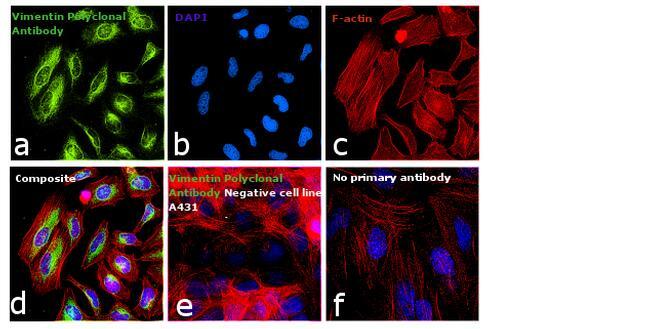
- Immunofluorescent analysis of Vimentin in HeLa cells. Cells were stained red using a NUP107 monoclonal antibody (Product # MA1-10031) at a dilution of 1:1,000, stained green with a Vimentin polyclonal antibody (Product # PA1-10003) at a dilution of 1:10,000, and nuclear DNA was stained blue with DAPI.
- Submitted by
- Invitrogen Antibodies (provider)
- Main image

- Experimental details
- Immunofluorescence analysis of Vimentin was performed using 70% confluent log phase HeLa cells. The cells were fixed with 4% paraformaldehyde for 10 minutes, permeabilized with 0.1% Triton™ X-100 for 10 minutes, and blocked with 1% BSA for 1 hour at room temperature. The cells were labeled with Vimentin Chicken Polyclonal Antibody (Product # PA1-10003) at 1:200 dilution in 0.1% BSA and incubated overnight at 4 degree Celsius and then labeled with Goat anti-Chicken IgG (H+L) Superclonal™ Secondary Antibody, Alexa Fluor® 488 conjugate (Product # A-11039) at a dilution of 1:2000 for 45 minutes at room temperature (Panel a: green). Nuclei (Panel b: blue) were stained with SlowFade® Gold Antifade Mountant with DAPI (Product # S36938). F-actin (Panel c: red) was stained with Rhodamine Phalloidin (Product # R415, 1:300). Panel d represents the merged image showing cytoplasmic, cytoskeletal and nuclear localization. Panel e represents negative control, A-431 cells. Panel f represents control cells with no primary antibody to assess background. The images were captured at 60X magnification.
- Submitted by
- Invitrogen Antibodies (provider)
- Main image

- Experimental details
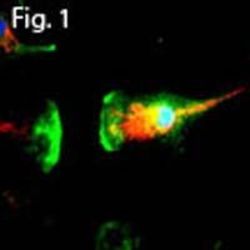
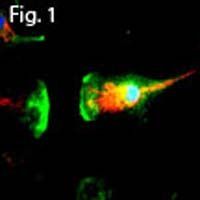
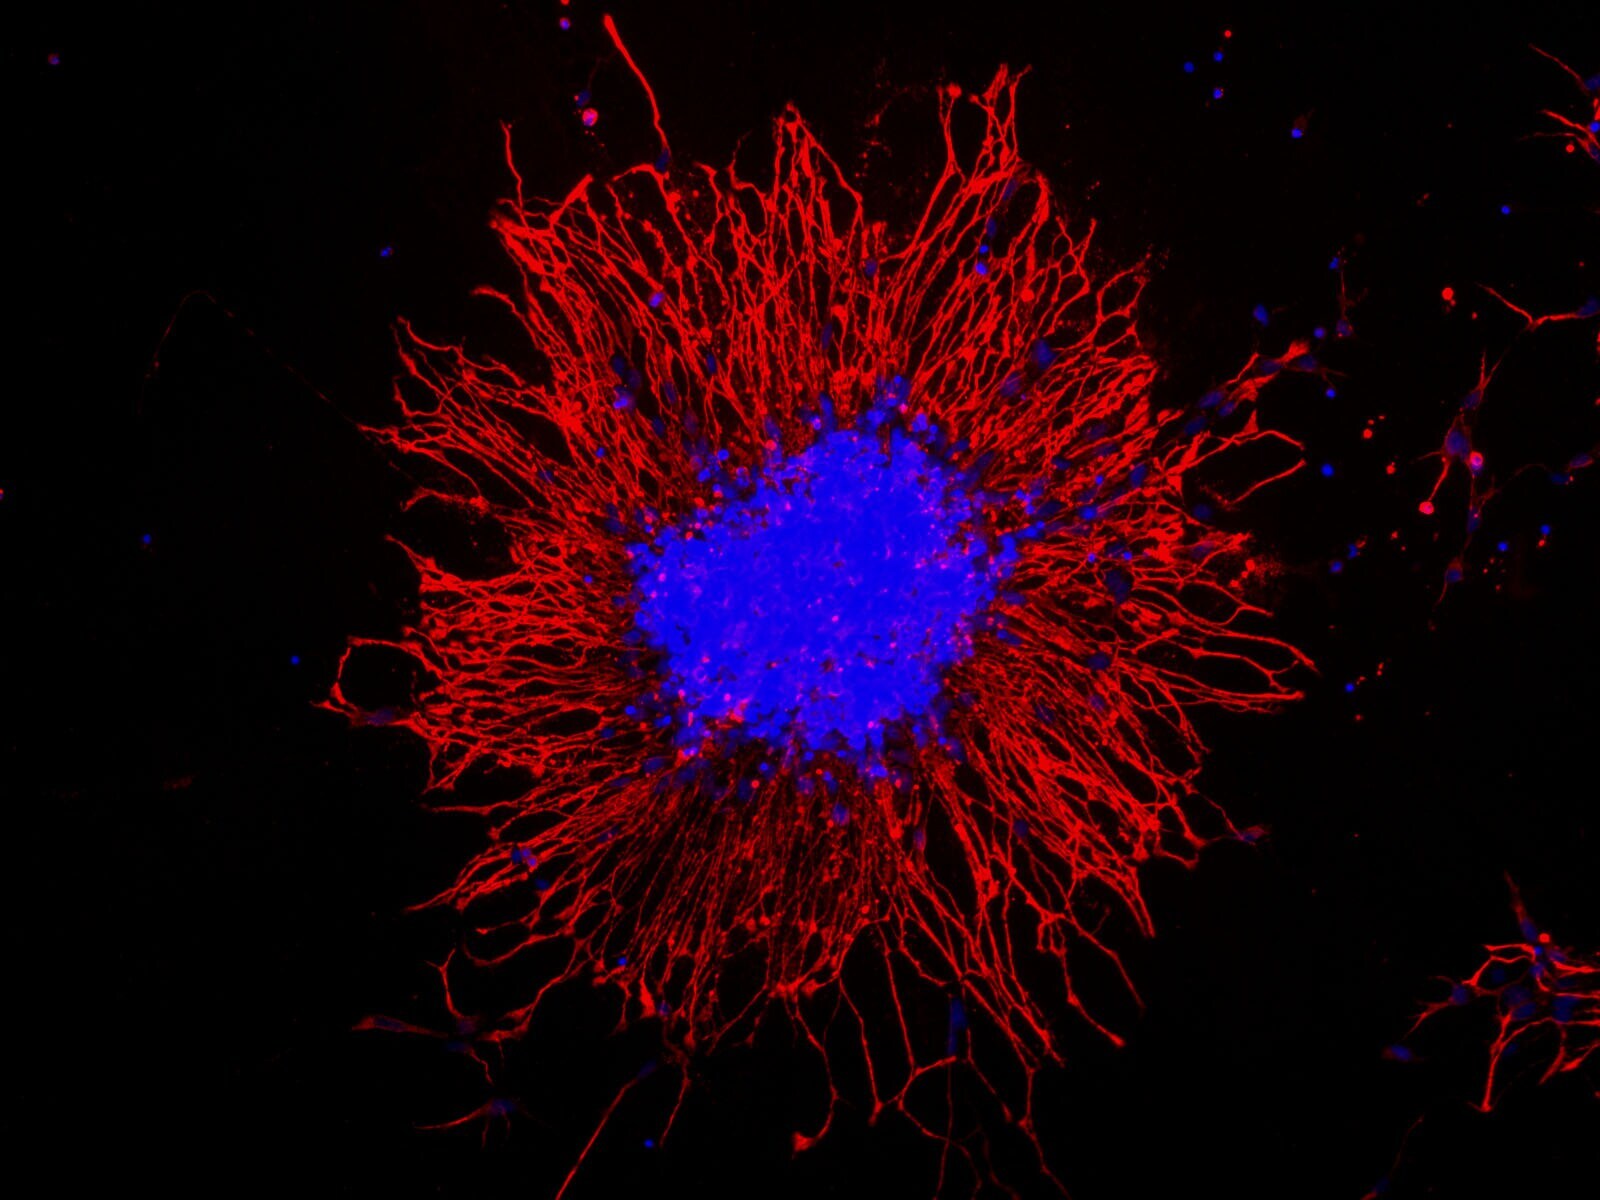
- Immunofluorescent analysis of Vimentin in hN2 cell culture. After 4 days islands of hN2 cells form. Samples were then fixed and stained with a Vimentin polyclonal antibody (Product # PA1-10003) as seen in red, and with DAPI staining the nuclear DNA in blue. The final image was merged from several images taken with a 10X objective lens.
- Submitted by
- Invitrogen Antibodies (provider)
- Main image

- Experimental details
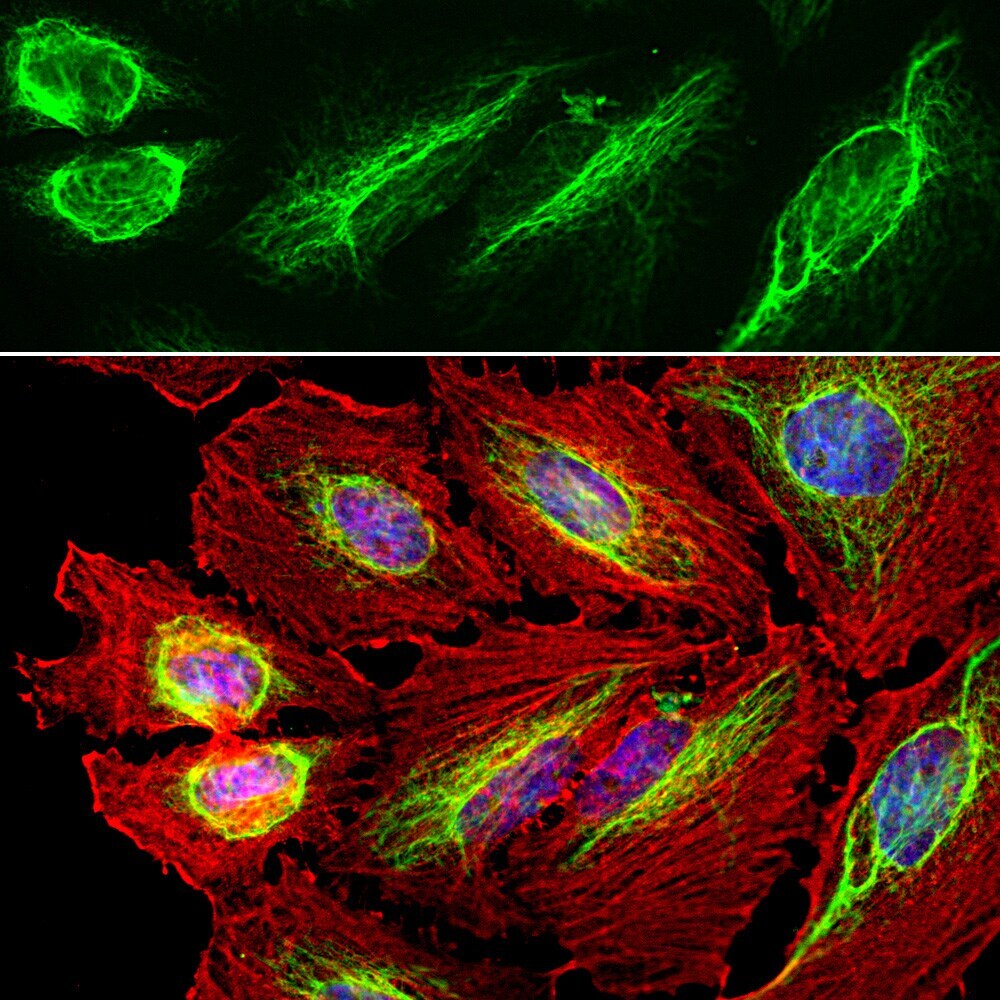
- Immunofluorescent analysis of Vimentin in HeLa cell culture stained a Vimentin polyclonal antibody (Product # PA1-10003) at a dilution of 1:10,000 as seen in green, and costained with an Actin monoclonal antibody at a dilution of 1:500 in red, and with DAPI staining the nuclear DNA in blue. The vimentin antibody stains the intermediate filament network while the actin antibody labels the submembranous cytoskeleton, stress fibers, and bundles of actin associated with cell adhesion sites.

- Submitted by
- Invitrogen Antibodies (provider)
- Main image

- Experimental details
- Immunofluorescent analysis of Vimentin in HeLa cell culture stained a Vimentin polyclonal antibody (Product # PA1-10003) at a dilution of 1:10,000 as seen in green, and costained with an Actin monoclonal antibody at a dilution of 1:500 in red, and with DAPI staining the nuclear DNA in blue. The vimentin antibody stains the intermediate filament network while the actin antibody labels the submembranous cytoskeleton, stress fibers, and bundles of actin associated with cell adhesion sites.
- Submitted by
- Invitrogen Antibodies (provider)
- Main image

- Experimental details
- Immunofluorescent analysis of Vimentin in hN2 cell culture. After 4 days islands of hN2 cells form. Samples were then fixed and stained with a Vimentin polyclonal antibody (Product # PA1-10003) as seen in red, and with DAPI staining the nuclear DNA in blue. The final image was merged from several images taken with a 10X objective lens.

- Submitted by
- Invitrogen Antibodies (provider)
- Main image

- Experimental details
- Immunofluorescence analysis of Vimentin was performed using 70% confluent log phase HeLa cells. The cells were fixed with 4% paraformaldehyde for 10 minutes, permeabilized with 0.1% Triton™ X-100 for 10 minutes, and blocked with 1% BSA for 1 hour at room temperature. The cells were labeled with Vimentin Chicken Polyclonal Antibody (Product # PA1-10003) at 1:200 dilution in 0.1% BSA and incubated overnight at 4 degree Celsius and then labeled with Goat anti-Chicken IgG (H+L) Superclonal™ Secondary Antibody, Alexa Fluor® 488 conjugate (Product # A-11039) at a dilution of 1:2000 for 45 minutes at room temperature (Panel a: green). Nuclei (Panel b: blue) were stained with SlowFade® Gold Antifade Mountant with DAPI (Product # S36938). F-actin (Panel c: red) was stained with Rhodamine Phalloidin (Product # R415, 1:300). Panel d represents the merged image showing cytoplasmic, cytoskeletal and nuclear localization. Panel e represents negative control, A-431 cells. Panel f represents control cells with no primary antibody to assess background. The images were captured at 60X magnification.
Supportive validation
- Submitted by
- Invitrogen Antibodies (provider)
- Main image
- Experimental details
- NULL
- Submitted by
- Invitrogen Antibodies (provider)
- Main image
- Experimental details
- NULL
- Submitted by
- Invitrogen Antibodies (provider)
- Main image

- Experimental details
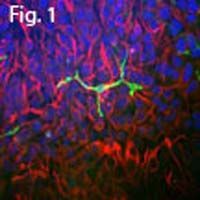
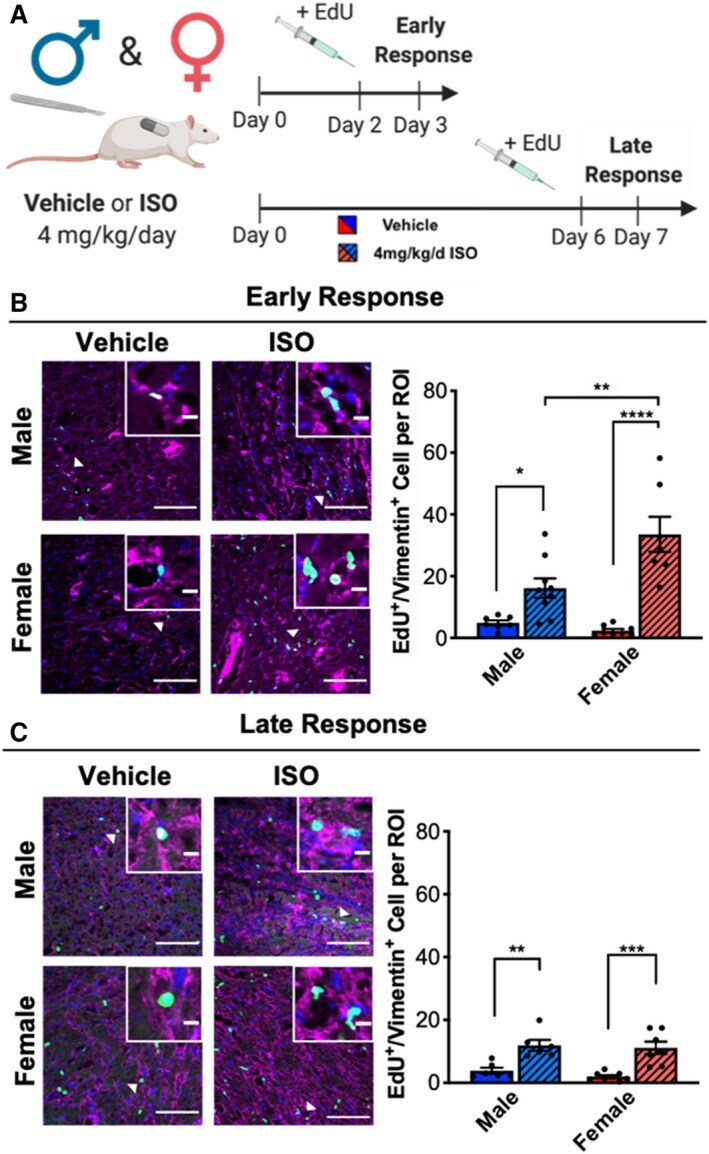
- Figure 3 Female CFs are more proliferative than male CFs in response to ISO treatment. ( A ) Illustration of experimental design testing ISO treatment on CF proliferation in male and female rats during the early (3 day) or late (7 day) response. ( B ) Proliferation of CFs after 3 days of ISO treatment measured by EdU staining. Representative images and quantification. White arrows indicate cells shown in insets. DAPI = blue, EdU positive cells = Green, vimentin = pink. Large image scale bar = 100 um, inset scale bar = 10 um. Male vehicle n=7, Male ISO n=9, Female vehicle n=8, Female ISO n=7. Two-way ANOVA with Bonferroni post hoc applied. ( C ) Proliferation of CFs after 7 days of ISO treatment measured by EdU staining. Representative images and quantification. White arrows indicate cells shown in insets. DAPI = blue, EdU positive cells = Green, vimentin = pink. Large image scale bar = 100 um, inset scale bar = 10 um. Male vehicle n=6, Male ISO n=6, Female vehicle n=8, Female ISO n=7. Two-way ANOVA with Bonferroni post hoc applied. * P
- Submitted by
- Invitrogen Antibodies (provider)
- Main image
- Experimental details
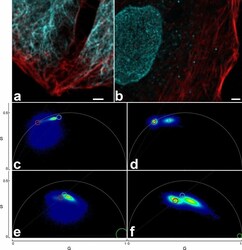
- Fluorochromes have different lifetimes when coupled to antibodies or to phalloidin. ( a ) Confocal image of Abberior STAR 635P coupled to an antibody delineating vimentin (cyan) and to phalloidin (actin staining; red) and subjected to phasor based lifetime separation. ( b ) Confocal image of ATTO 647N coupled to phalloidin (actin staining, red) and an antibody (nuclear pores, cyan. Both confocal images show good separation of the two stained structures. Scale bars 2 um. ( c , d ) Phasor plots for the complete raw images of ( a , b ). The actin coupled dyes have longer lifetimes (left cloud, red circle) compared to their antibody-conjugated versions (right cloud, cyan circle). ( e , f ) Phasor plots of respective STED images show that the lifetime differences are much reduced, due to the depletion effect causing a shorter average lifetime. Therefore, despite inclusion of a background component (green circle at G = 1, S = 0), separation of STED images was not satisfying and resulting images are not shown. Cyan and red circles indicate the best possible positions for separation of the two species. In ( e , f ) the right-hand clouds contain the pixels with antibody label derived photons, but they also contain substantial amounts of actin label derived photons. To compensate for this the circles were positioned next to the clouds.
