Explore
 Validate
 Learn
Learn14-6644-82
antibody from Invitrogen Antibodies
Targeting: TNFRSF10A
Apo2, CD261, DR4, TRAILR-1, TRAILR1
 Immunohistochemistry
 Flow cytometry
Antibody data
- Antibody Data
- Antigen structure
- References [8]
- Comments [0]
- Validations
- Flow cytometry [1]
- Other assay [6]
Submit
Validation data
Reference
Comment
Report error
- Product number
- 14-6644-82 - Provider product page

- Provider
- Invitrogen Antibodies
- Product name
- CD261 (DR4) Monoclonal Antibody (DJR1), eBioscience™
- Antibody type
- Monoclonal
- Antigen
- Other
- Description
- Description: The DJR1 monoclonal antibody reacts with human DR4, also known as TRAIL-R1. DR4 binds to TRAIL, activates NF-kappaB, and induces TRAIL-mediated apoptosis. DR4 is expressed by a variety of human tumor cells and at very low level on human leukocytes. Expression has also been found inside the cell on some cell lines (Zhang et al). This has been confirmed with intracellular staining of Jurkat cell line. Please contact tech@ebioscience.com for more information. Applications Reported: This DJR1 antibody has been reported for use in flow cytometric analysis, and immunohistology staining of frozen tissue sections. Applications Tested: The DJR1 antibody has been tested by flow cytometric analysis of human DR4-transfected cells. This can be used at less than or equal to 1 µg per test. A test is defined as the amount (µg) of antibody that will stain a cell sample in a final volume of 100 µL. Cell number should be determined empirically but can range from 10^5 to 10^8 cells/test. It is recommended that the antibody be carefully titrated for optimal performance in the assay of interest. Purity: Greater than 90%, as determined by SDS-PAGE. Aggregation: Less than 10%, as determined by HPLC. Filtration: 0.2 µm post-manufacturing filtered.
- Reactivity
- Human
- Host
- Mouse
- Isotype
- IgG
- Antibody clone number
- DJR1
- Vial size
- 100 µg
- Concentration
- 0.5 mg/mL
- Storage
- 4° C
Submitted references Systematic genetic mapping of necroptosis identifies SLC39A7 as modulator of death receptor trafficking.
Targeting the metabolic pathway of human colon cancer overcomes resistance to TRAIL-induced apoptosis.
TRAIL-mediated apoptosis in breast cancer cells cultured as 3D spheroids.
A whole-genome RNAi screen identifies an 8q22 gene cluster that inhibits death receptor-mediated apoptosis.
ABT-737 induces expression of the death receptor 5 and sensitizes human cancer cells to TRAIL-induced apoptosis.
The proteasome inhibitor PS-341 (bortezomib) up-regulates DR5 expression leading to induction of apoptosis and enhancement of TRAIL-induced apoptosis despite up-regulation of c-FLIP and survivin expression in human NSCLC cells.
The farnesyltransferase inhibitor lonafarnib induces CCAAT/enhancer-binding protein homologous protein-dependent expression of death receptor 5, leading to induction of apoptosis in human cancer cells.
Difference in cytotoxicity against hepatocellular carcinoma between liver and periphery natural killer cells in humans.
Fauster A, Rebsamen M, Willmann KL, César-Razquin A, Girardi E, Bigenzahn JW, Schischlik F, Scorzoni S, Bruckner M, Konecka J, Hörmann K, Heinz LX, Boztug K, Superti-Furga G
Cell death and differentiation 2019 Jun;26(6):1138-1155
Cell death and differentiation 2019 Jun;26(6):1138-1155
Targeting the metabolic pathway of human colon cancer overcomes resistance to TRAIL-induced apoptosis.
Carr RM, Qiao G, Qin J, Jayaraman S, Prabhakar BS, Maker AV
Cell death discovery 2016;2:16067
Cell death discovery 2016;2:16067
TRAIL-mediated apoptosis in breast cancer cells cultured as 3D spheroids.
Chandrasekaran S, Marshall JR, Messing JA, Hsu JW, King MR
PloS one 2014;9(10):e111487
PloS one 2014;9(10):e111487
A whole-genome RNAi screen identifies an 8q22 gene cluster that inhibits death receptor-mediated apoptosis.
Dompe N, Rivers CS, Li L, Cordes S, Schwickart M, Punnoose EA, Amler L, Seshagiri S, Tang J, Modrusan Z, Davis DP
Proceedings of the National Academy of Sciences of the United States of America 2011 Oct 25;108(43):E943-51
Proceedings of the National Academy of Sciences of the United States of America 2011 Oct 25;108(43):E943-51
ABT-737 induces expression of the death receptor 5 and sensitizes human cancer cells to TRAIL-induced apoptosis.
Song JH, Kandasamy K, Kraft AS
The Journal of biological chemistry 2008 Sep 5;283(36):25003-13
The Journal of biological chemistry 2008 Sep 5;283(36):25003-13
The proteasome inhibitor PS-341 (bortezomib) up-regulates DR5 expression leading to induction of apoptosis and enhancement of TRAIL-induced apoptosis despite up-regulation of c-FLIP and survivin expression in human NSCLC cells.
Liu X, Yue P, Chen S, Hu L, Lonial S, Khuri FR, Sun SY
Cancer research 2007 May 15;67(10):4981-8
Cancer research 2007 May 15;67(10):4981-8
The farnesyltransferase inhibitor lonafarnib induces CCAAT/enhancer-binding protein homologous protein-dependent expression of death receptor 5, leading to induction of apoptosis in human cancer cells.
Sun SY, Liu X, Zou W, Yue P, Marcus AI, Khuri FR
The Journal of biological chemistry 2007 Jun 29;282(26):18800-9
The Journal of biological chemistry 2007 Jun 29;282(26):18800-9
Difference in cytotoxicity against hepatocellular carcinoma between liver and periphery natural killer cells in humans.
Ishiyama K, Ohdan H, Ohira M, Mitsuta H, Arihiro K, Asahara T
Hepatology (Baltimore, Md.) 2006 Feb;43(2):362-72
Hepatology (Baltimore, Md.) 2006 Feb;43(2):362-72
No comments: Submit comment
Supportive validation
- Submitted by
- Invitrogen Antibodies (provider)
- Main image

- Experimental details
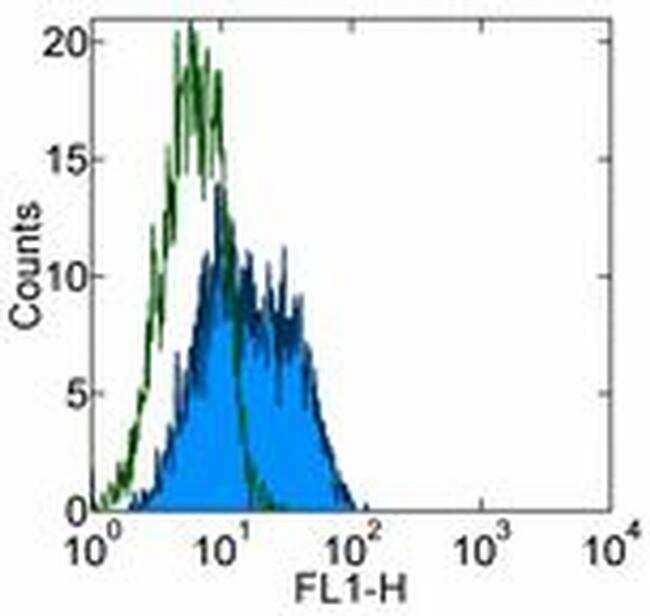
- Staining of human DR4-transfected cells withMouse IgG1 kappa Isotype Control Purified (Product # 14-4714-82) (open histogram) or Anti-Human CD261 (DR4) Purified (filled histogram) followed by Anti-Mouse IgG FITC (Product # 11-4011-85). Total viable cells were used for analysis.
Supportive validation
- Submitted by
- Invitrogen Antibodies (provider)
- Main image
- Experimental details
- NULL
- Submitted by
- Invitrogen Antibodies (provider)
- Main image
- Experimental details
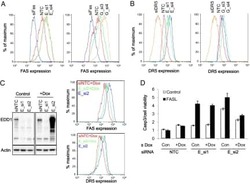
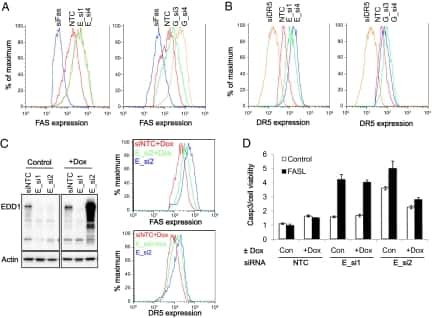
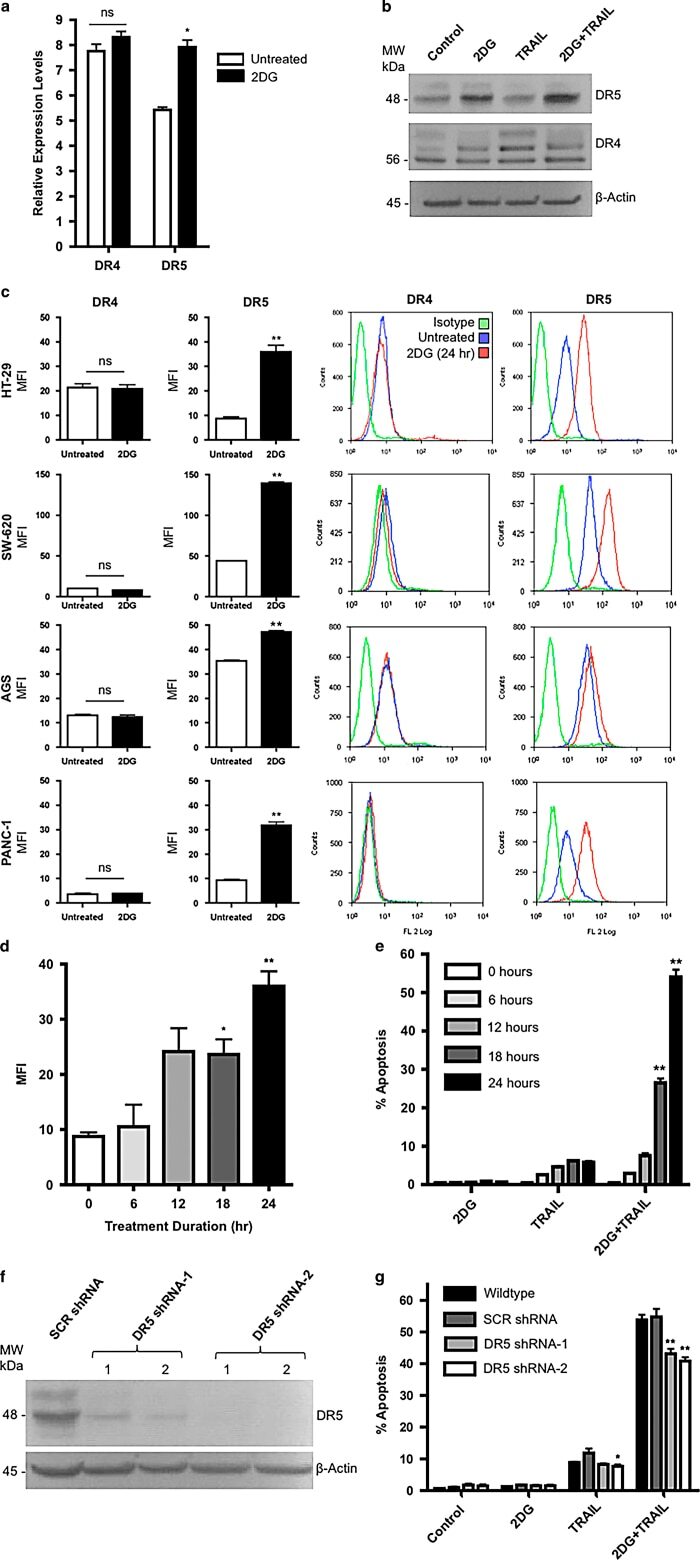
- Figure 3 2DG increases DR5 expression levels with no effect on DR4, however, the increase in TRAIL-induced apoptosis requires additional mechanisms. ( a ) QRT-PCR of DR4 and DR5 transcripts in HT29 cells with and without 2DG treatment. ( b ) Immunoblotting for DR4 and DR5 indicated increased DR5 protein expression with 2DG treatment. ( c ) DR surface expression in various TRAIL resistant colon, gastric and pancreatic adenocarcinoma cells. ( d ) DR5 surface expression increases with 2DG treatment over time in HT-29 cells. ( e ) Apoptosis, as assessed by capsase-3 activation, in the same group of HT-29 cells increased over a 24 h time course upon treatment with 2DG+TRAIL, corresponding temporally with the increase in DR5 expression. ( f ) To knock down DR5 expression, HT-29 cells were transduced with the indicated lentiviral constructs and allowed to grow for 48 h. A lentivirus expressing a scrambled sequence was used as a control. ( g ) Cell death was significantly decreased with DR5 knockdown in 2DG+TRAIL-treated cells, however, remained significantly higher than wild-type cells treated with 2DG or TRAIL alone. n =3, ** indicates P 0.05.
- Submitted by
- Invitrogen Antibodies (provider)
- Main image

- Experimental details
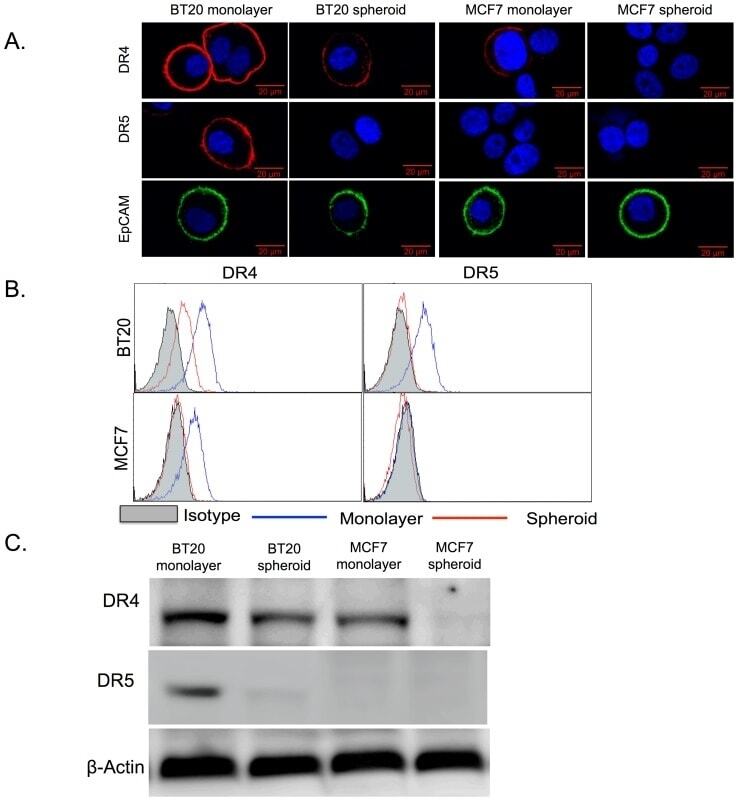
- Figure 1 BT20 and MCF7 spheroids have a lower expression of death receptors. (A) Confocal micrographs of BT20 and MCF7 cells cultured as 3D spheroids and 2D monolayer stained with antibodies against DR4 (red), DR5 (red) and EpCAM (green). (Scale bar = 20 um) (B) Flow cytometry histograms comparing DR4 and DR5 expression in BT20 and MCF7 spheroids and monolayer. (C) Western blot analysis of total DR4 and DR5 expression in cell lysates from BT20 and MCF7 spheroids and monolayer.
- Submitted by
- Invitrogen Antibodies (provider)
- Main image
- Experimental details
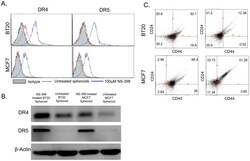
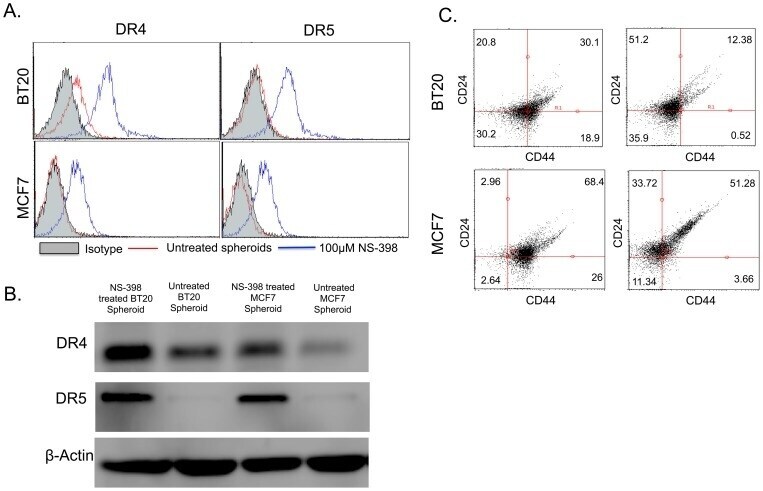
- Figure 6 COX-2 inhibitor treatment upregulates the expression of DR4 and DR5 in BT20 and MCF7 spheroids. (A) Flow cytometry histograms showing the effect of 100 uM NS-398 treatment on death receptor expression in BT20 and MCF7 cells cultured as spheroids. (B) Western blot analysis of whole cell lysates from untreated and NS-398 treated BT20 and MCF7 spheroids for DR4 and DR5 expression. (C) Flow cytometry scatter plots showing the effect of NS-398 treatment on the prevalence of CD44 hi CD24 lo population in BT20 and MCF7 cells cultured as spheroids.
- Submitted by
- Invitrogen Antibodies (provider)
- Main image
- Experimental details
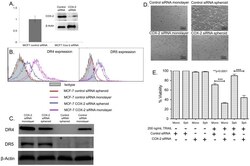
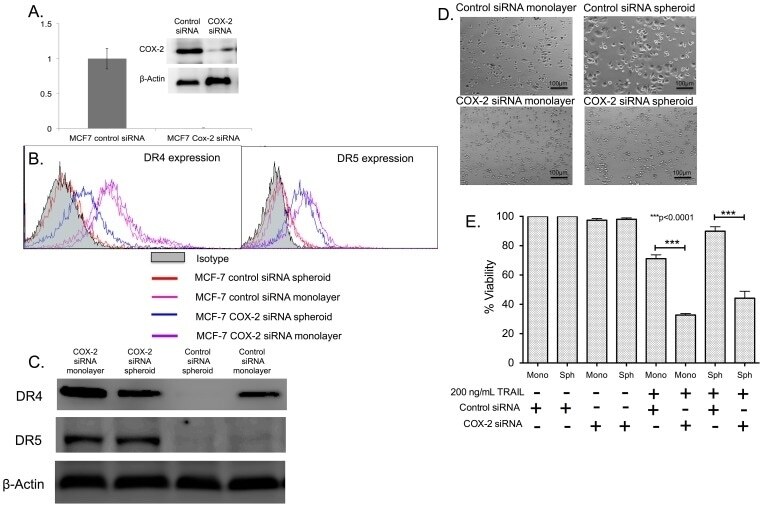
- Figure 8 COX-2 knockdown reverses TRAIL-resistance in MCF7 spheroid and monolayer cells. (A) qPCR and western blot data showing the relative expression of COX-2 gene (n = 3) and COX-2 protein in control siRNA and COX-2 siRNA transfected MCF7 cells. (B) Flow cytometry histograms and (C) western blot analysis comparing the expression of DR4 in MCF7 cells transfected with control siRNA and COX-2 siRNA cultured as monolayer and spheroids. (D) Bright field images and (E) MTT assay results (n = 5) quantifying the effect of 200 ng/mL of TRAIL in control siRNA and COX-2 siRNA transfected cells cultured as monolayer and spheroids.
- Submitted by
- Invitrogen Antibodies (provider)
- Main image
- Experimental details
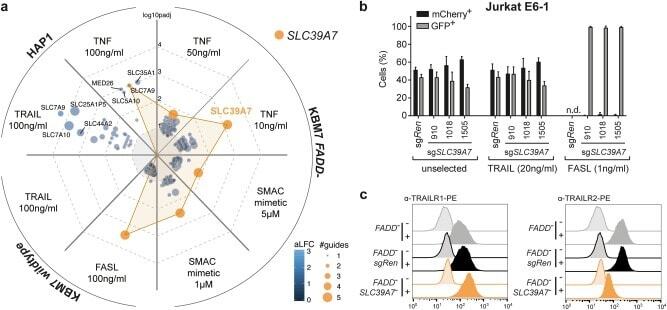
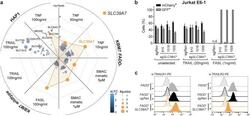
- Fig. 4 Orthogonal genetic screens and surface marker analysis specify SLC39A7 loss-of-function phenotype on receptor trafficking. a Spider plot summarizing the results of 8 independent CRISPR/ Cas9 screens in KBM7 wildtype, KBM7 FADD - , or HAP1 cells using an SLC-specific gRNA library. Each plot section represents one screen with the indicated stimuli. Screen analysis was performed by identifying differentially enriched sgRNAs using DESeq2 and then aggregating sgRNAs to genes using Gene Set Enrichment Analysis. Identified hits are ranked according to the adjusted p -value of enrichment (-log10(p adj )), bubble size indicates the number of significantly enriched sgRNAs and color the average log2 fold-change (aLFC) of the enriched sgRNAs. Screens were performed in duplicate. SLC39A7 is highlighted in orange. No gene was identified in KBM7 wildtype cells upon TRAIL treatment. b MCA of Jurkat E6.1 SpCas9 cells transduced with a GFP marker (GFP + ) and sgRNAs targeting either SLC39A7 or Renilla luciferase (sg Ren ) as control, against cells transduced with sg Ren and an mCherry marker (mCherry + ). The cell populations were mixed at 1:1 ratio, treated with TRAIL (20 ng/ml) or FASL (1 ng/ml), and analyzed after 14 days by flow cytometry. Data represent mean value +- s.d. of two independent experiments performed in duplicates, n.d. (not determined) indicates wells with no outgrowth. c Flow cytometry analysis for TRAILR1 (left) and TRAILR2 (right) surface expression in KBM7 FADD - ,