Explore
 Validate
 Learn
Learn Western blot
 Immunohistochemistry
Antibody data
- Antibody Data
- Antigen structure
- References [1]
- Comments [0]
- Validations
- Immunohistochemistry [2]
- Other assay [2]
Submit
Validation data
Reference
Comment
Report error
- Product number
- PA5-34375 - Provider product page

- Provider
- Invitrogen Antibodies
- Product name
- GZF1 Polyclonal Antibody
- Antibody type
- Polyclonal
- Antigen
- Synthetic peptide
- Description
- A suggested positive control is human heart tissue lysate. PA5-34375 can be used with blocking peptide PEP-1418.
- Reactivity
- Human
- Host
- Rabbit
- Isotype
- IgG
- Vial size
- 100 μg
- Concentration
- 1 mg/mL
- Storage
- Maintain refrigerated at 2-8°C for up to 3 months. For long term storage store at -20°C
Submitted references Thalidomide promotes degradation of SALL4, a transcription factor implicated in Duane Radial Ray syndrome.
Donovan KA, An J, Nowak RP, Yuan JC, Fink EC, Berry BC, Ebert BL, Fischer ES
eLife 2018 Aug 1;7
eLife 2018 Aug 1;7
No comments: Submit comment
Supportive validation
- Submitted by
- Invitrogen Antibodies (provider)
- Main image
- Experimental details
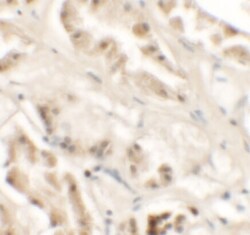
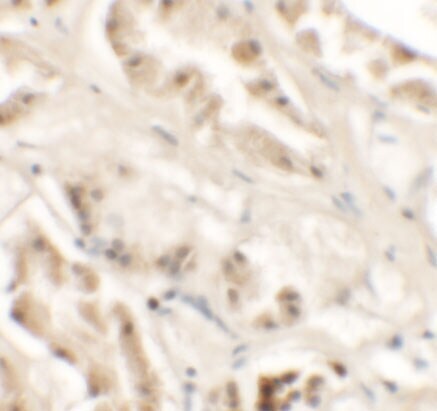
- Immunohistochemistry of GZF1 in human kidney tissue with GZF1 Polyclonal Antibody (Product # PA5-34375) at 2.5 µg/mL.
- Submitted by
- Invitrogen Antibodies (provider)
- Main image
- Experimental details
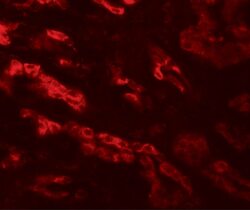
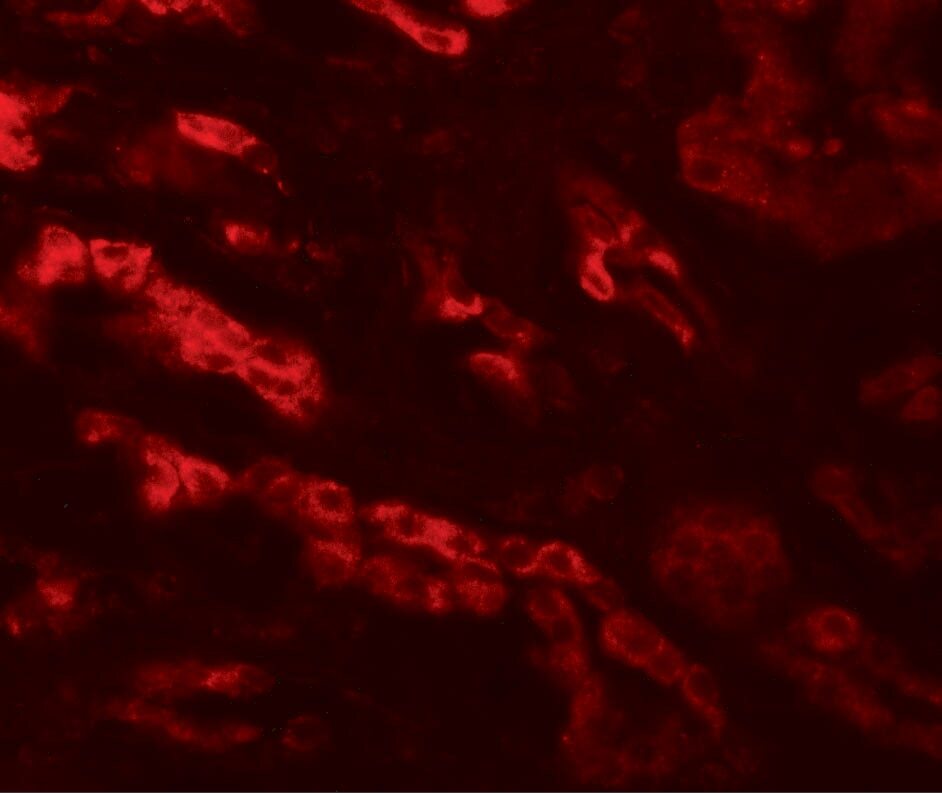
- Immunofluorescence of GZF1 in human kidney tissue with GZF1 Polyclonal Antibody (Product # PA5-34375) at 20 µg/mL.
Supportive validation
- Submitted by
- Invitrogen Antibodies (provider)
- Main image

- Experimental details
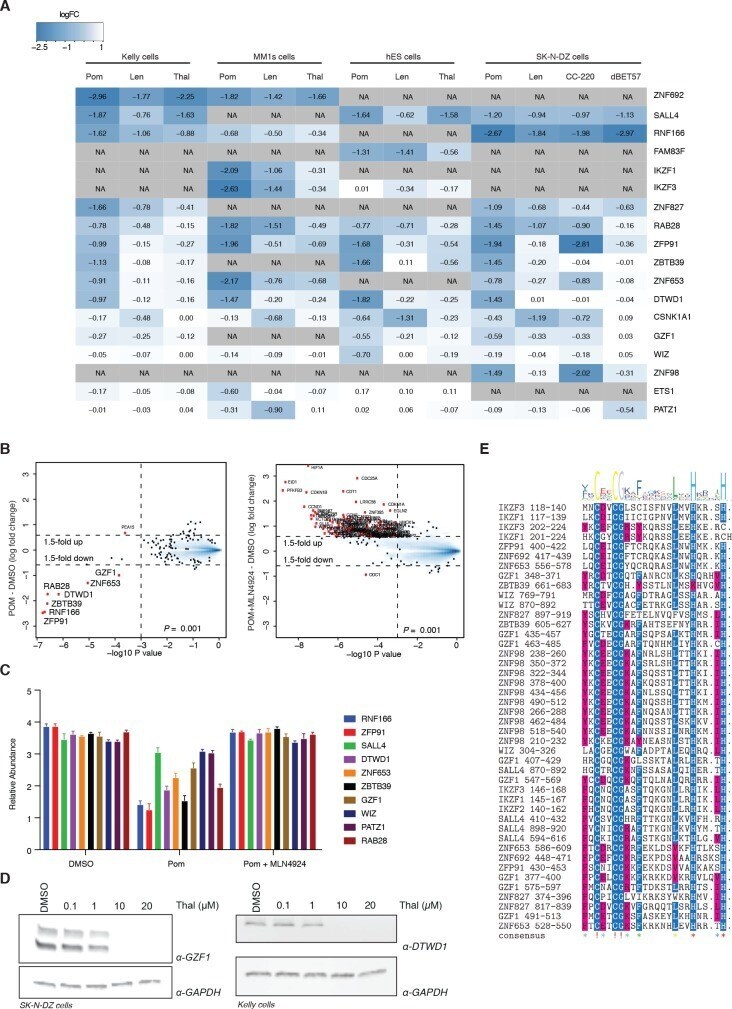
- Figure 1--figure supplement 2. Extended validation of IMiD-dependent targets. ( A ) Heatmap summarizing the protein abundance of IMiD-dependent targets identified from proteomics data across four different cell lines (Kelly, MM1s, hES, and SK-N-DZ cells) and five different compounds (thalidomide, lenalidomide, pomalidomide, CC-220, and dBET57). The color scale displays a 2.5-fold decrease in protein abundance in blue and no change is displayed in white. NA indicates that the protein was not identified/quantified in the experiment. ( B ) Mass spectrometry scatter plot validation of IMiD-dependent targets. SK-N-DZ cells were treated with 1 uM pomalidomide to induce degradation of IMiD-dependent targets (left), degradation was rescued by co-treatment with 1 uM pomalidomide +5 uM MLN4924 (right), or treated with DMSO as a control for 5 h. Protein abundance from each experiment was analyzed using TMT quantification mass spectrometry (see Materials and methods for details). Significant changes were assessed by a moderated t-test as implemented in the limma package ( Ritchie et al., 2015 ), with the log2 FC shown on the y-axis, and -log 10 p values on the x-axis (for three biological replicates). Hits that met the significance threshold (fold-change greater 1.5 and log 10 p value below 0.001) are displayed with a red point (*). ( C ) Reporter ion ratios from ( B ) were normalized and scaled (see Materials and methods) and are depicted as a bar graph for the IMiD-dependent tar
- Submitted by
- Invitrogen Antibodies (provider)
- Main image
- Experimental details
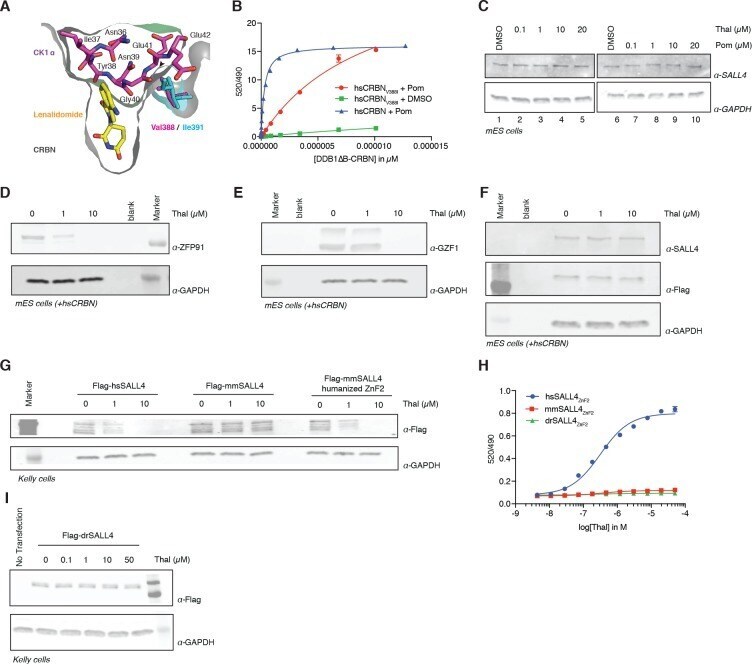
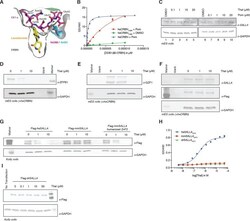
- Figure 4. Identification of the sequence differences in the IMiD-dependent binding region of both CRBN and SALL4 in specific species. ( A ) Close-up view of the beta-hairpin loop region of Ck1a (CSNK1A1) interacting with CRBN and lenalidomide (PDB: 5fqd) highlighting the additional bulkiness of the V388I mutation (PDB: 4ci1) present in mouse and rat CRBN. CSNK1A1 and lenalidomide are depicted as stick representations in magenta and yellow, respectively, the Ile391 of mouse CRBN corresponding to human Val388 is depicted as a stick representation in cyan, and CRBN is depicted as a surface representation. ( B ) TR-FRET: titration of DDB1[delta]B-hsCRBN Spy-BodipyFL , or DDB1[delta]B-hsCRBN V388I Spy-BodipyFL to biotinylated hsSALL4 ZnF1-2 at 100 nM, and terbium-streptavidin at 4 nM in the presence of 50 uM pomalidomide or DMSO. ( C ) mES cells were treated with increasing concentrations of thalidomide and pomalidomide or DMSO as a control. Following 24 h of incubation, SALL4 and GAPDH protein levels were assessed by western blot analysis. ( D ) mES cells constitutively expressing Flag-hsCRBN were treated with increasing concentrations of thalidomide. Following 24 h of incubation, ZFP91 and GAPDH protein levels were assessed by western blot analysis. ( E ) As in ( C ), but measuring GZF1 and GAPDH protein levels. ( F ) As in ( C ), but measuring SALL4, hsCRBN (alpha-Flag), and GAPDH protein levels. ( G ) Kelly cells were transiently transfected with Flag-hsSALL4, Flag-mmSALL4, or Flag-mm