Explore
 Validate
 Learn
Learn Western blot
 Immunocytochemistry
 Immunohistochemistry
Antibody data
- Antibody Data
- Antigen structure
- References [1]
- Comments [0]
- Validations
- Immunocytochemistry [2]
- Other assay [2]
Submit
Validation data
Reference
Comment
Report error
- Product number
- PA5-102432 - Provider product page

- Provider
- Invitrogen Antibodies
- Product name
- Renin Polyclonal Antibody
- Antibody type
- Polyclonal
- Antigen
- Synthetic peptide
- Description
- Antibody detects endogenous levels of total Renin.
- Reactivity
- Human, Mouse, Rat
- Host
- Rabbit
- Isotype
- IgG
- Vial size
- 100 μL
- Concentration
- 1 mg/mL
- Storage
- -20°C
Submitted references Cell differentiation and aging accompanied by depletion of the ACE2 protein.
Bártová E, Legartová S, Krejčí J, Arcidiacono OA
Aging 2020 Nov 17;12(22):22495-22508
Aging 2020 Nov 17;12(22):22495-22508
No comments: Submit comment
Supportive validation
- Submitted by
- Invitrogen Antibodies (provider)
- Main image

- Experimental details
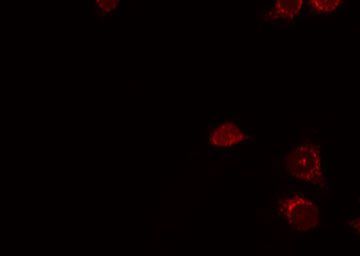
- Immunofluorescent analysis of Renin in HeLa cells. Samples were fixed with paraformaldehyde, permeabilized with 0.1% Triton X-100, blocked with 10% serum (45 min at 25°C) incubated with Renin polyclonal antibody (Product # PA5-102432) using a dilution of 1:200 (1 hr, 37°C), and followed by goat anti-rabbit IgG Alexa Fluor 594 at a dilution of 1:600.
- Submitted by
- Invitrogen Antibodies (provider)
- Main image

- Experimental details
- Immunofluorescent analysis of Renin in HeLa cells. Samples were fixed with paraformaldehyde, permeabilized with 0.1% Triton X-100, blocked with 10% serum (45 min at 25°C) incubated with Renin polyclonal antibody (Product # PA5-102432) using a dilution of 1:200 (1 hr, 37°C), and followed by goat anti-rabbit IgG Alexa Fluor 594 at a dilution of 1:600.

Supportive validation
- Submitted by
- Invitrogen Antibodies (provider)
- Main image
- Experimental details
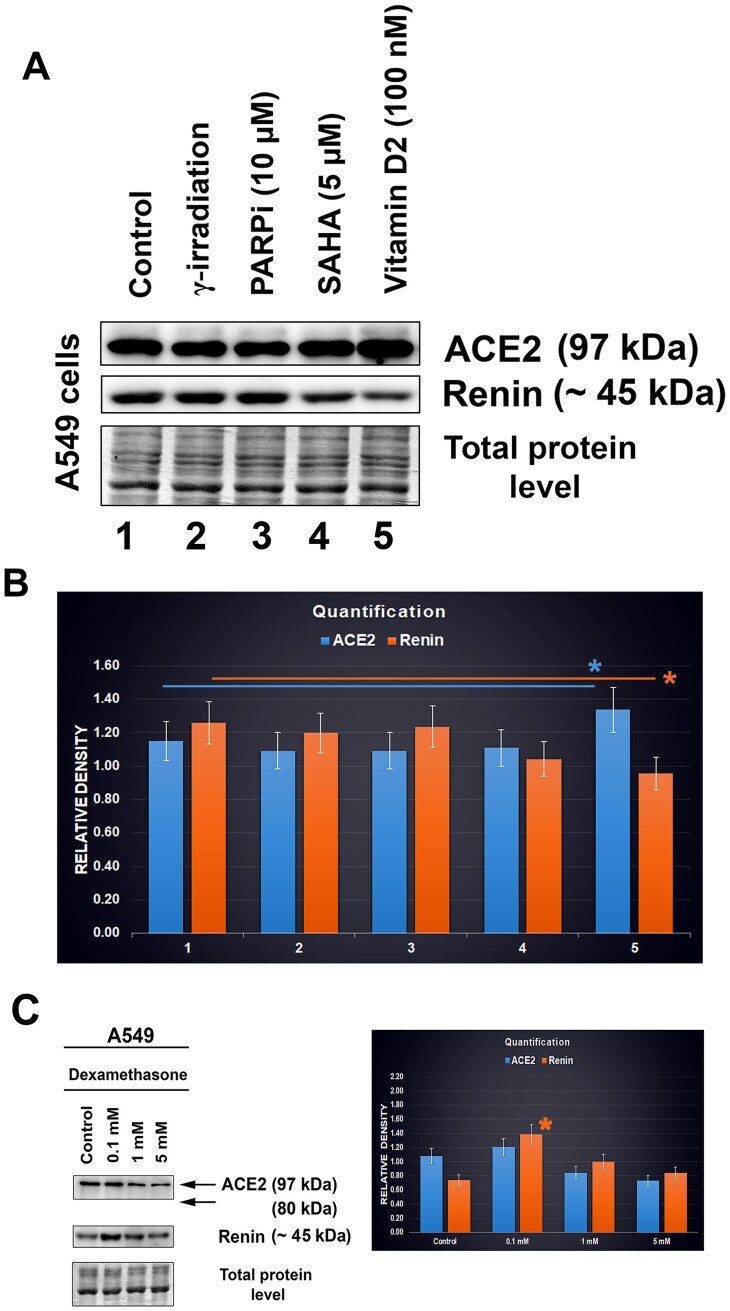
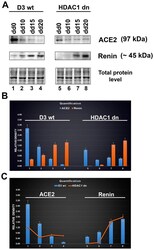
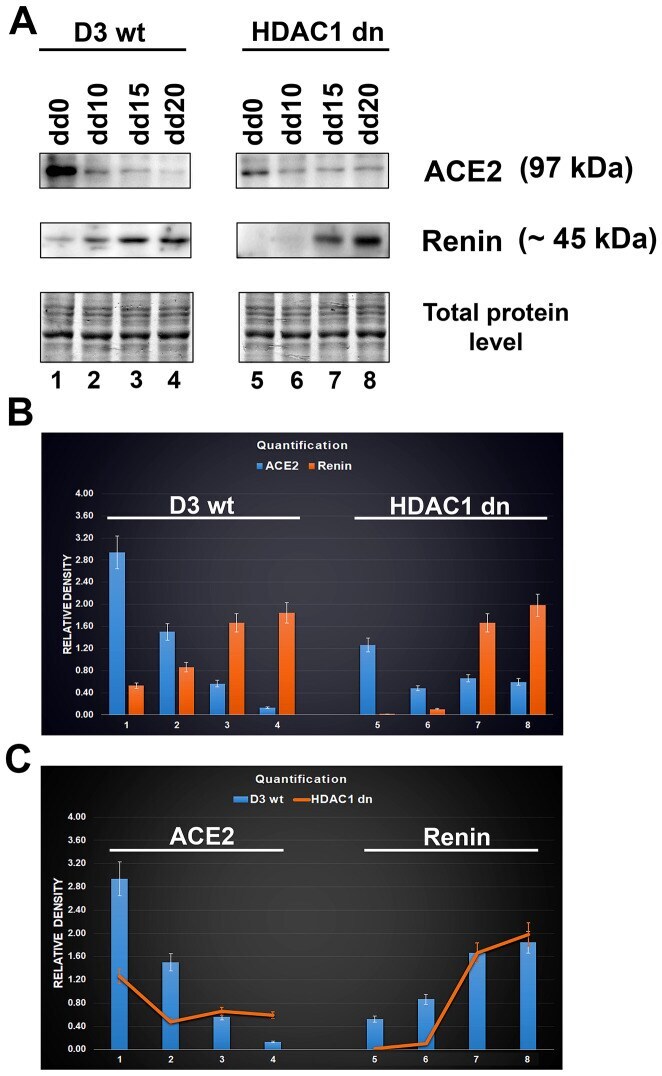
- Figure 3 Downregulation of ACE2 in mESCs undergoing differentiation into cardiomyocytes. ( A ) western blot analyses were performed in HDAC1 wt (D3 wt) and HDAC1-depleted (dn) mES cells, non-differentiated and differentiated into cardiomyocytes. The data show the levels of the ACE2 protein and renin normalized to the total protein levels. ( B ) Quantification of the protein levels, as assessed by western blotting, was performed using ImageJ software; the bar chart shows the comparison of protein levels in differentiated wt mESCs and differentiated HDAC1 dn mESCs. ( C ) The graphical illustration shows the comparison of ACE2 and renin (separately) in differentiated wt mESCs and differentiated HDAC1 dn mESCs.
- Submitted by
- Invitrogen Antibodies (provider)
- Main image
- Experimental details
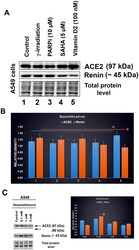
- Figure 7 ACE2 and renin levels after distinct treatments of A549 cells. ( A , B ) The effect of the following drugs was analyzed: gamma-irradiation, PARP inhibitor (olaparib), HDAC inhibitor (SAHA), and vitamin D2. (c) Level of ACE2 in dexamethasone-treated A549 cells. The data were normalized to the total protein levels, as shown in the bar chart. Quantification of the protein levels, as assessed by western blotting, was performed using ImageJ software. The blue asterisk indicates a slight increase in the ACE2 level, and orange asterisk shows the renin level decrease, in cells treated with vitamin D2 (panel B). The orange asterisk in panel C indicates renin upregulation caused by dexamethasone treatment. The data were analyzed by the nonparametric Mann-Whitney test.