Explore
 Validate
 Learn
LearnPA5-78690
antibody from Invitrogen Antibodies
Targeting: ABCB11
ABC16, BSEP, PFIC-2, PFIC2, PGY4, SPGP
 Western blot
 Immunohistochemistry
Antibody data
- Antibody Data
- Antigen structure
- References [2]
- Comments [0]
- Validations
- Immunohistochemistry [5]
- Flow cytometry [1]
- Other assay [2]
Submit
Validation data
Reference
Comment
Report error
- Product number
- PA5-78690 - Provider product page

- Provider
- Invitrogen Antibodies
- Product name
- BSEP Polyclonal Antibody
- Antibody type
- Polyclonal
- Antigen
- Synthetic peptide
- Description
- Reconstitute with 0.2 mL of distilled water to yield a concentration of 500 µg/mL. Positive Control - WB: human HCCT tissue, rat liver tissue, mouse liver tissue. IHC: Mouse Liver tissue, Rat Liver tissue, Human Liver Cancer tissue.
- Reactivity
- Human, Mouse, Rat
- Host
- Rabbit
- Isotype
- IgG
- Vial size
- 100 μg
- Concentration
- 500 μg/mL
- Storage
- -20°C
Submitted references Liver sphingomyelin synthase 1 deficiency causes steatosis, steatohepatitis, fibrosis, and tumorigenesis: An effect of glucosylceramide accumulation.
Gypenosides regulate farnesoid X receptor-mediated bile acid and lipid metabolism in a mouse model of non-alcoholic steatohepatitis.
Li Z, Chiang YP, He M, Worgall TS, Zhou H, Jiang XC
iScience 2021 Dec 17;24(12):103449
iScience 2021 Dec 17;24(12):103449
Gypenosides regulate farnesoid X receptor-mediated bile acid and lipid metabolism in a mouse model of non-alcoholic steatohepatitis.
Li H, Xi Y, Xin X, Tian H, Hu Y
Nutrition & metabolism 2020;17:34
Nutrition & metabolism 2020;17:34
No comments: Submit comment
Supportive validation
- Submitted by
- Invitrogen Antibodies (provider)
- Main image
- Experimental details
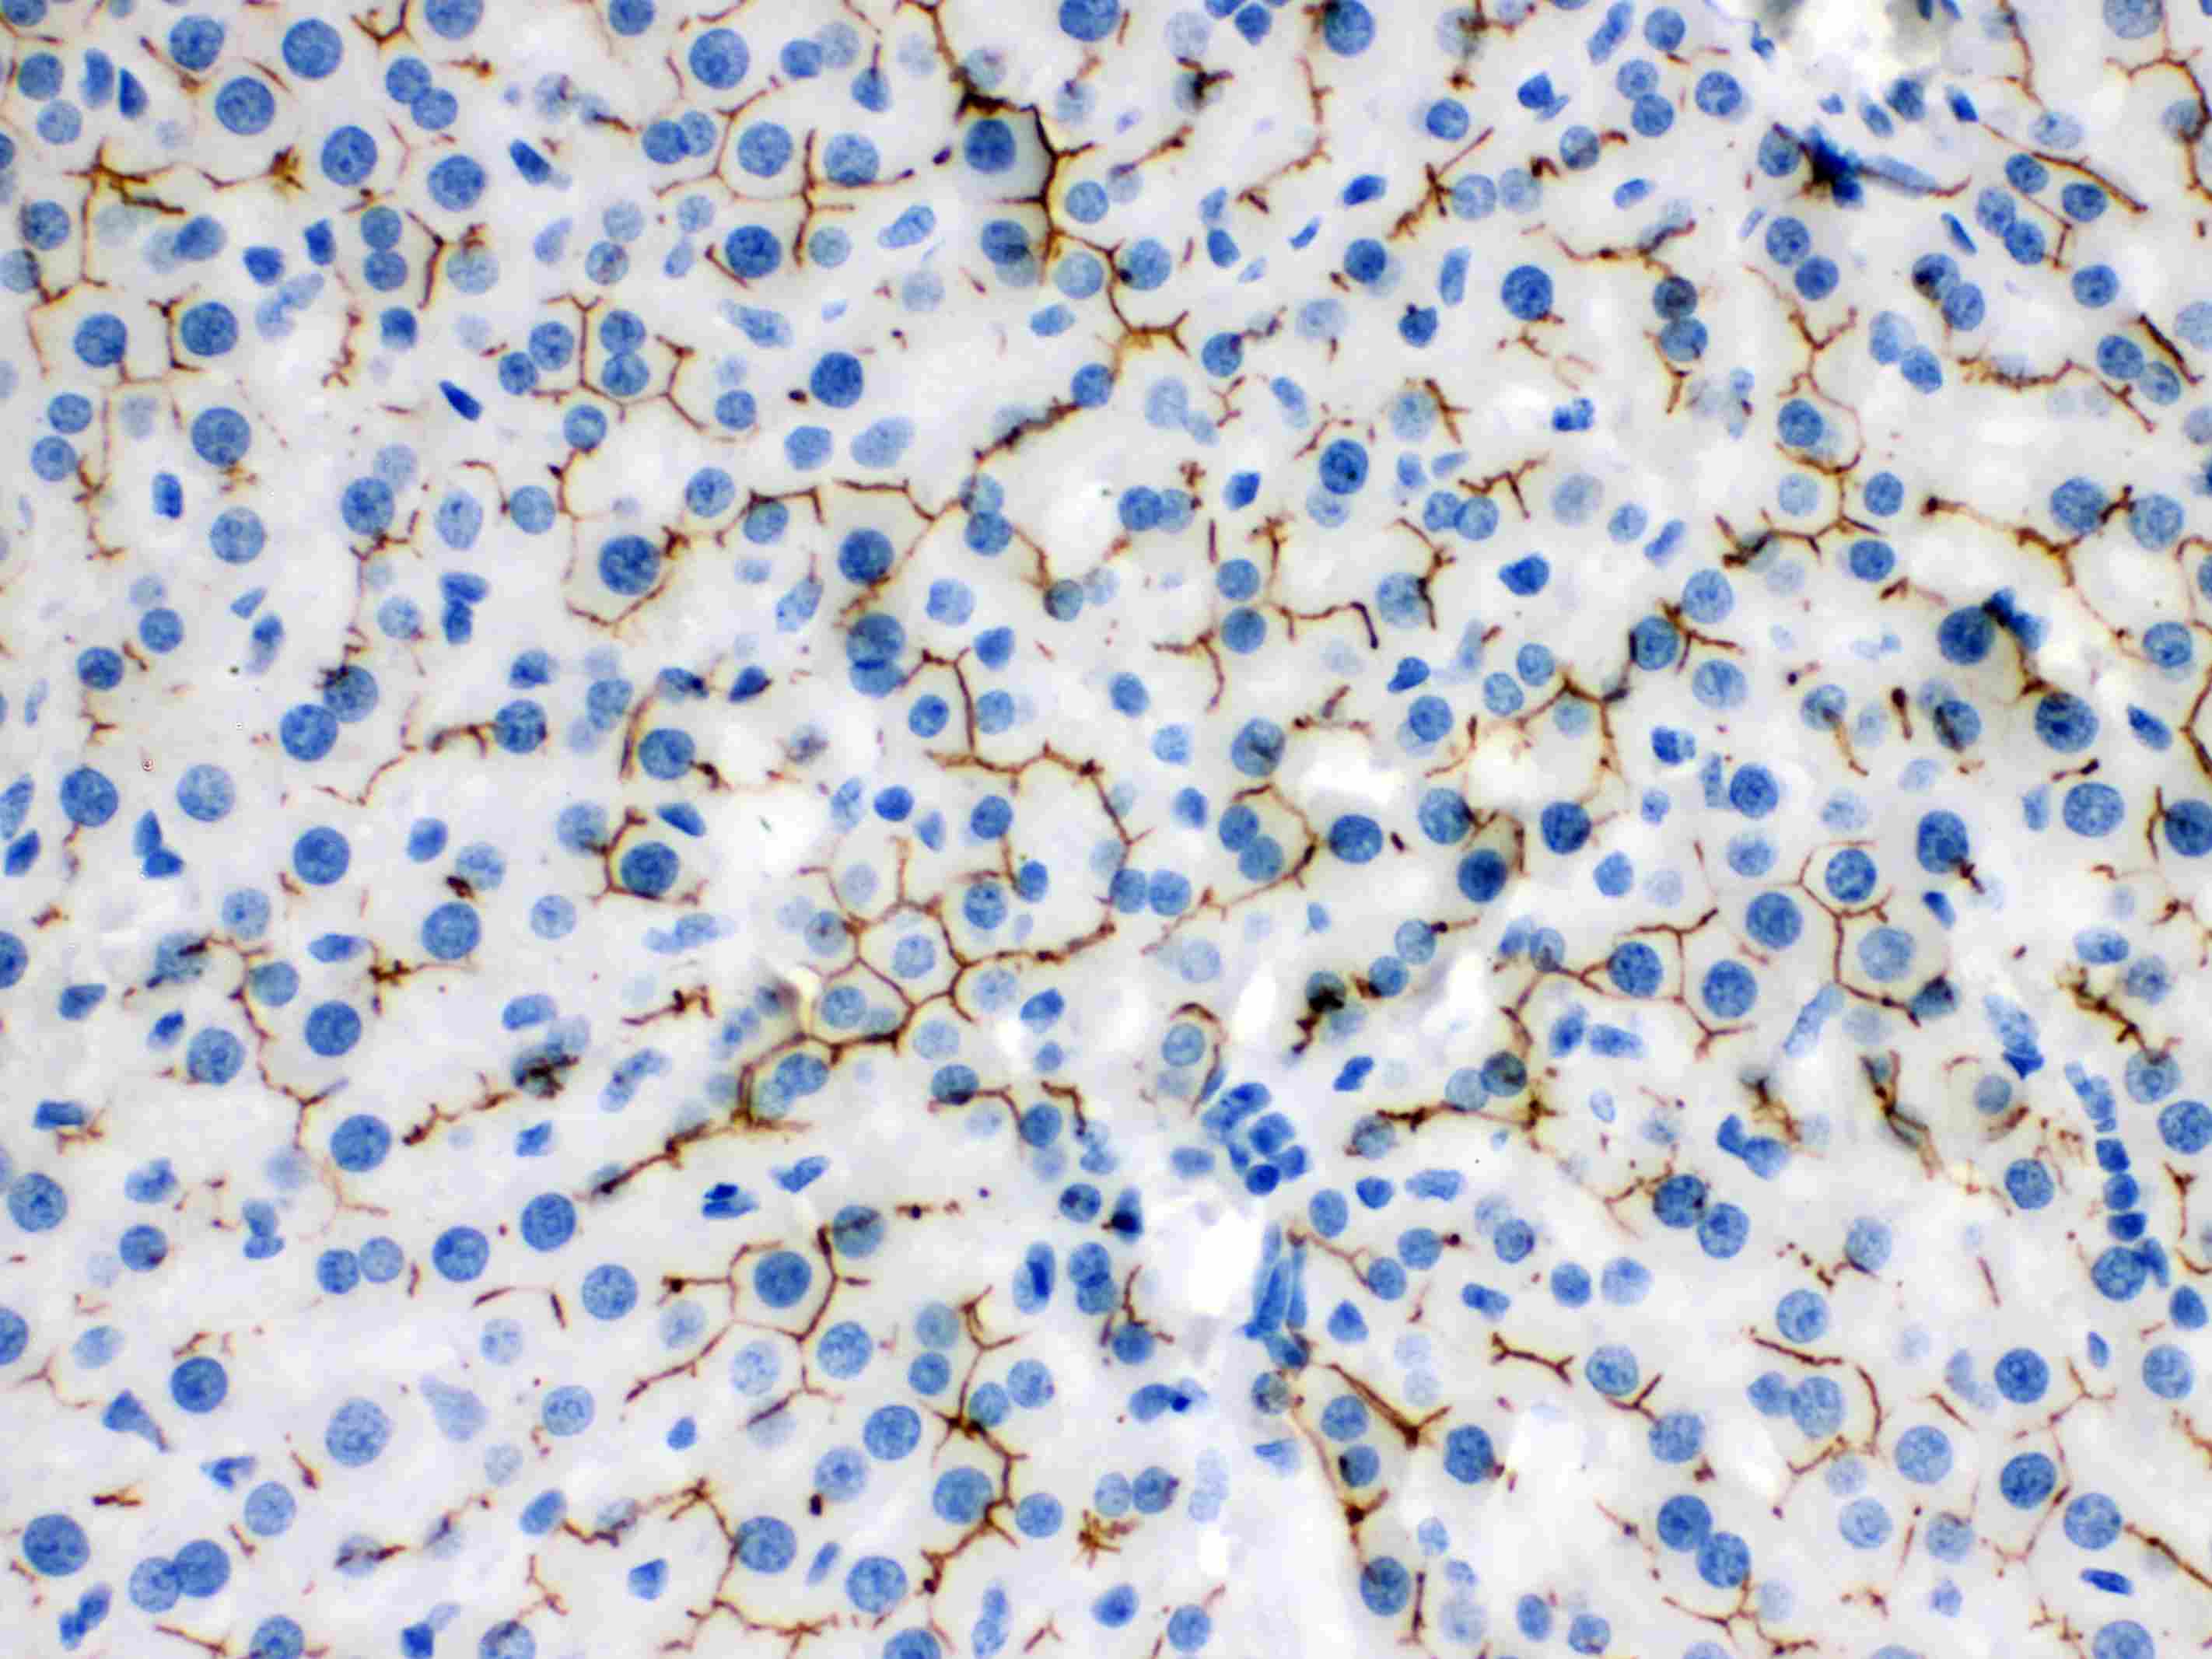
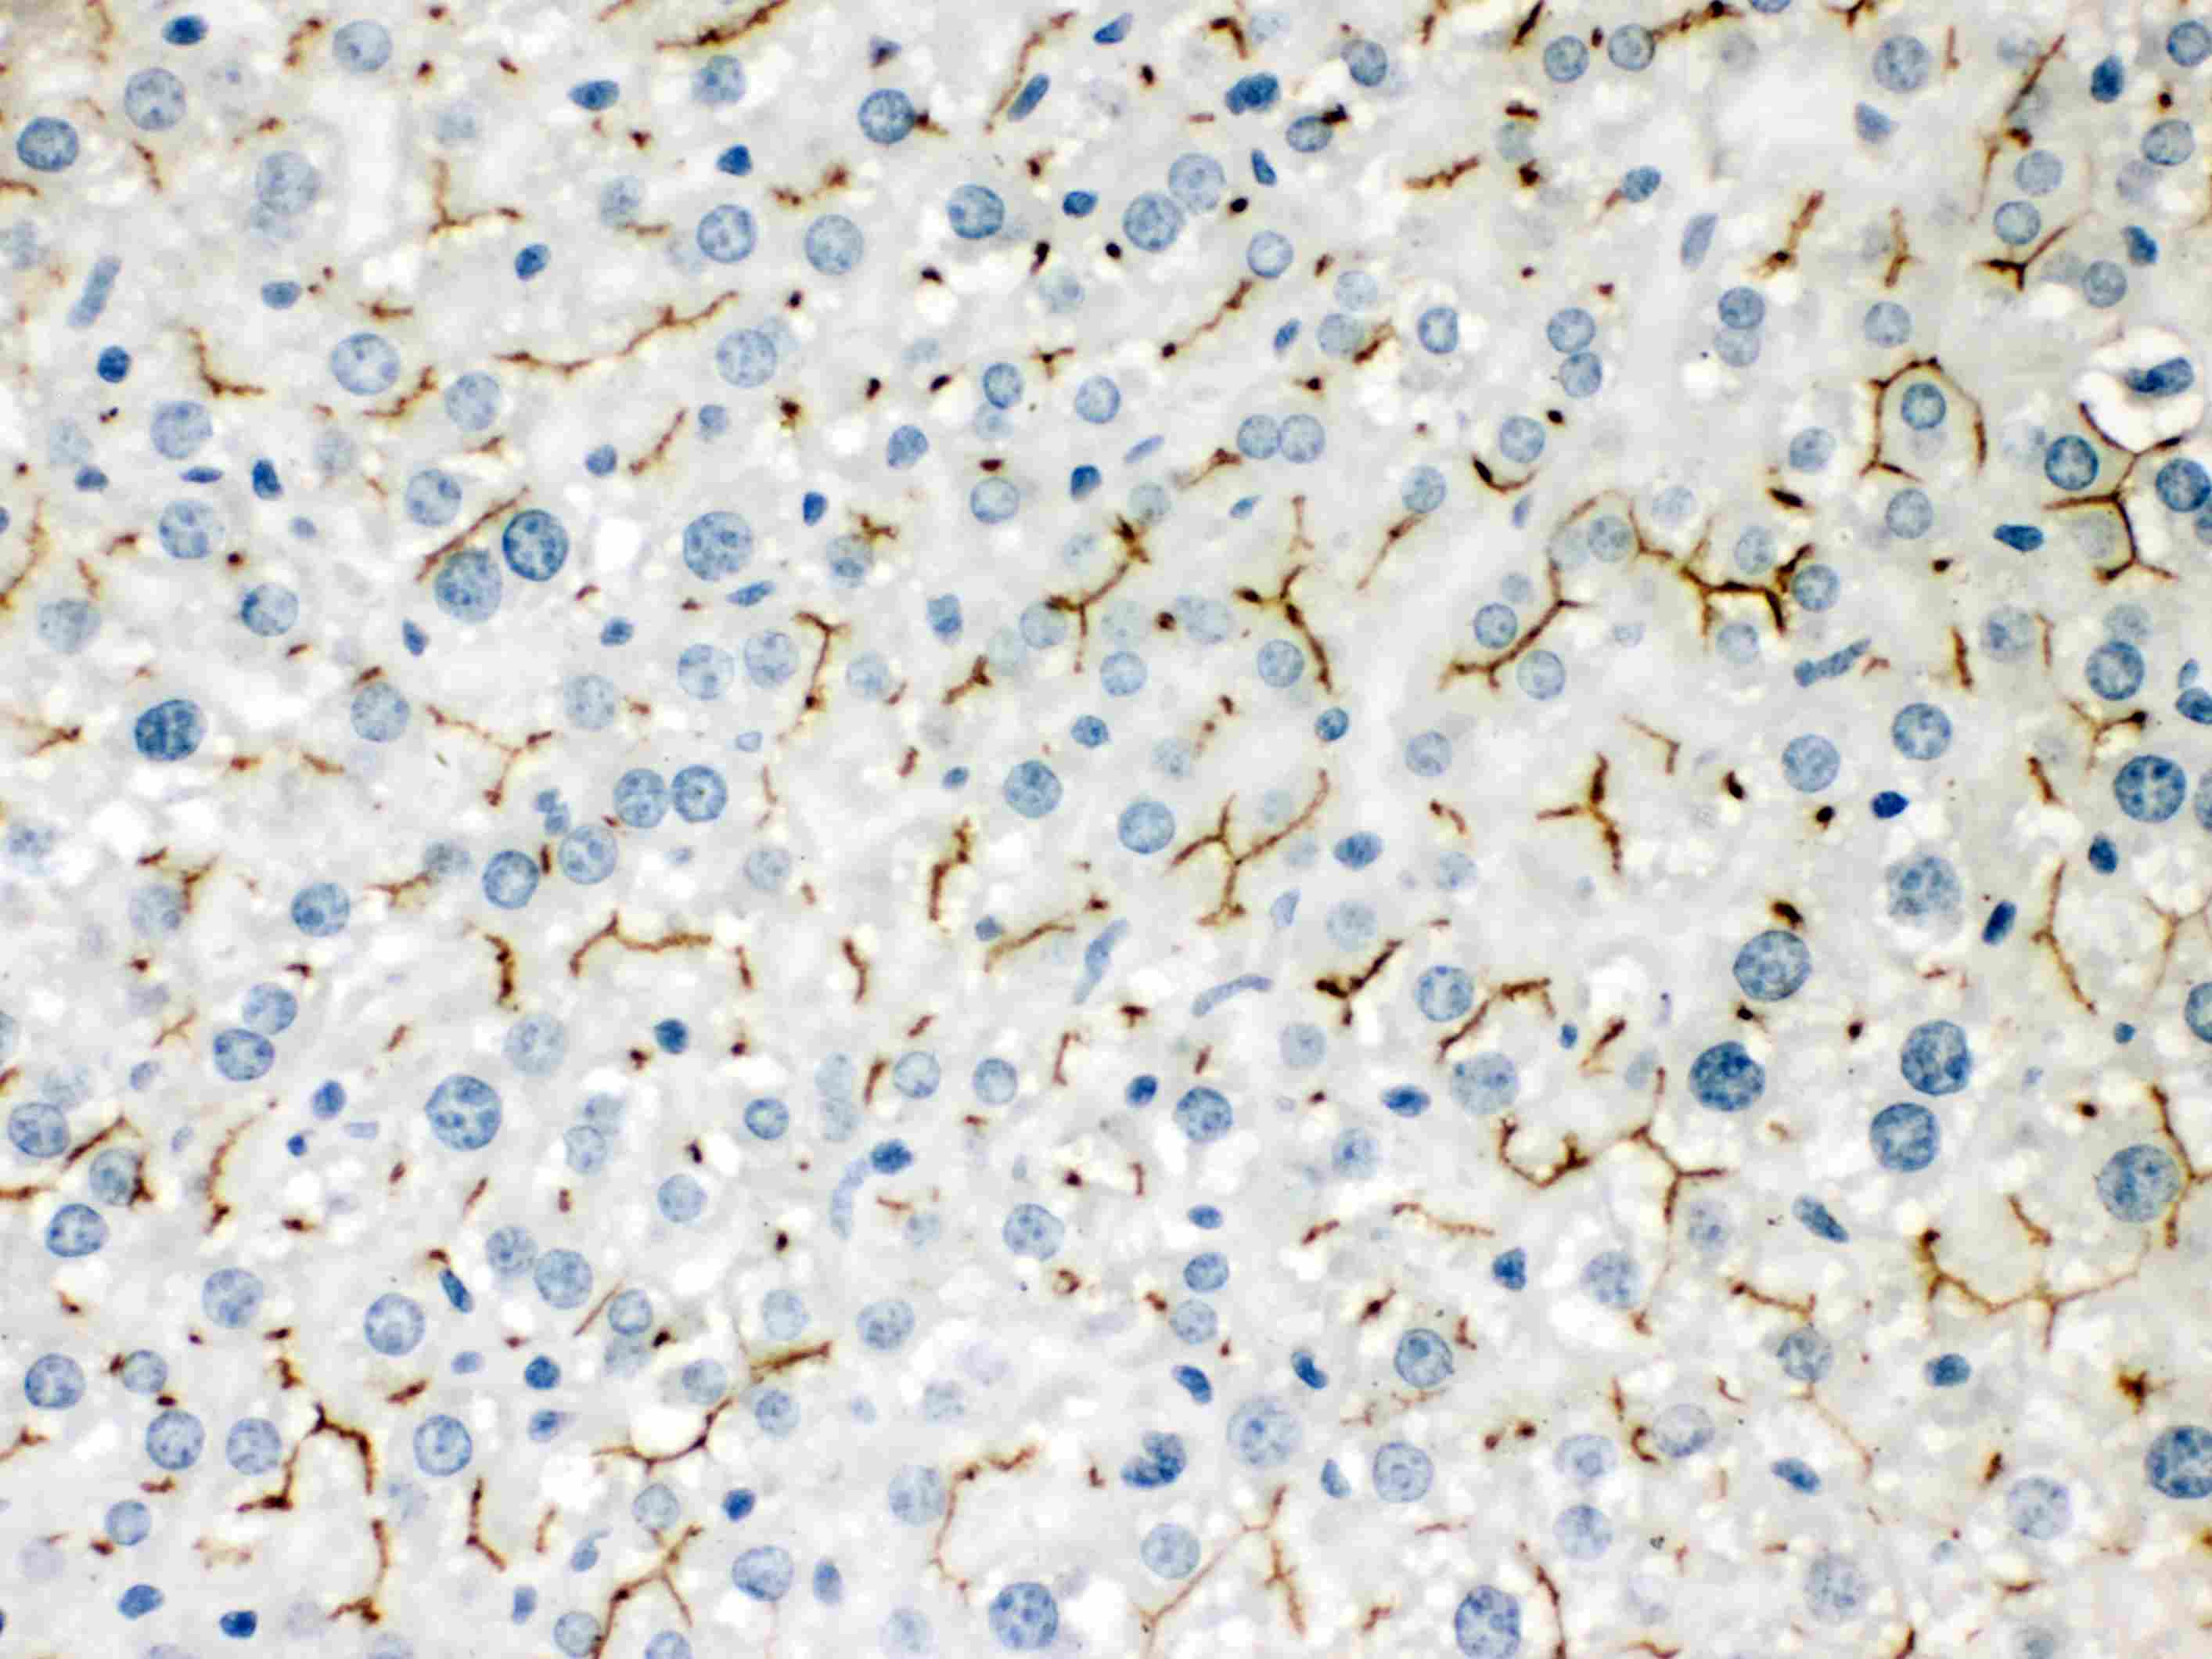
- Immunohistochemistry analysis of BSEP on paraffin-embedded rat liver tissue. Antigen retrieval was performed using citrate buffer (pH6, epitope retrieval solution) for 20 mins. Sample was blocked using 10% goat serum, incubated with BSEP polyclonal antibody (Product# PA5-78690) with a dilution of 1 µg/mL (overnight at 4°C), and followed by biotinylated goat anti-rabbit IgG (30 minutes at 37°C). Development was performed using Streptavidin-Biotin-Complex (SABC) with DAB chromogen method.
- Submitted by
- Invitrogen Antibodies (provider)
- Main image

- Experimental details
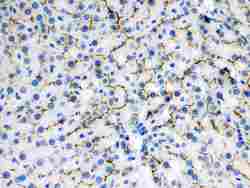
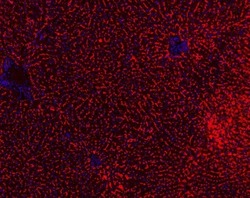
- Immunohistochemical analysis of ABCB11 in paraffin-embedded section of mouse liver tissues. Heat mediated antigen retrieval was performed in citrate buffer (pH6, epitope retrieval solution ) for 20 mins. The tissue section was blocked with 10% goat serum. The tissue section was then incubated with 1μg/mL rabbit anti-ABCB11 antibody (Product # PA5-78690) overnight at 4°C. Cy3 Conjugated Goat Anti-Rabbit IgG was used as secondary antibody at 1:100 dilution and incubated for 30 minutes at 37°C. The section was counterstained with DAPI. Visualize using a fluorescence microscope and filter sets appropriate for the label used.

- Submitted by
- Invitrogen Antibodies (provider)
- Main image
- Experimental details
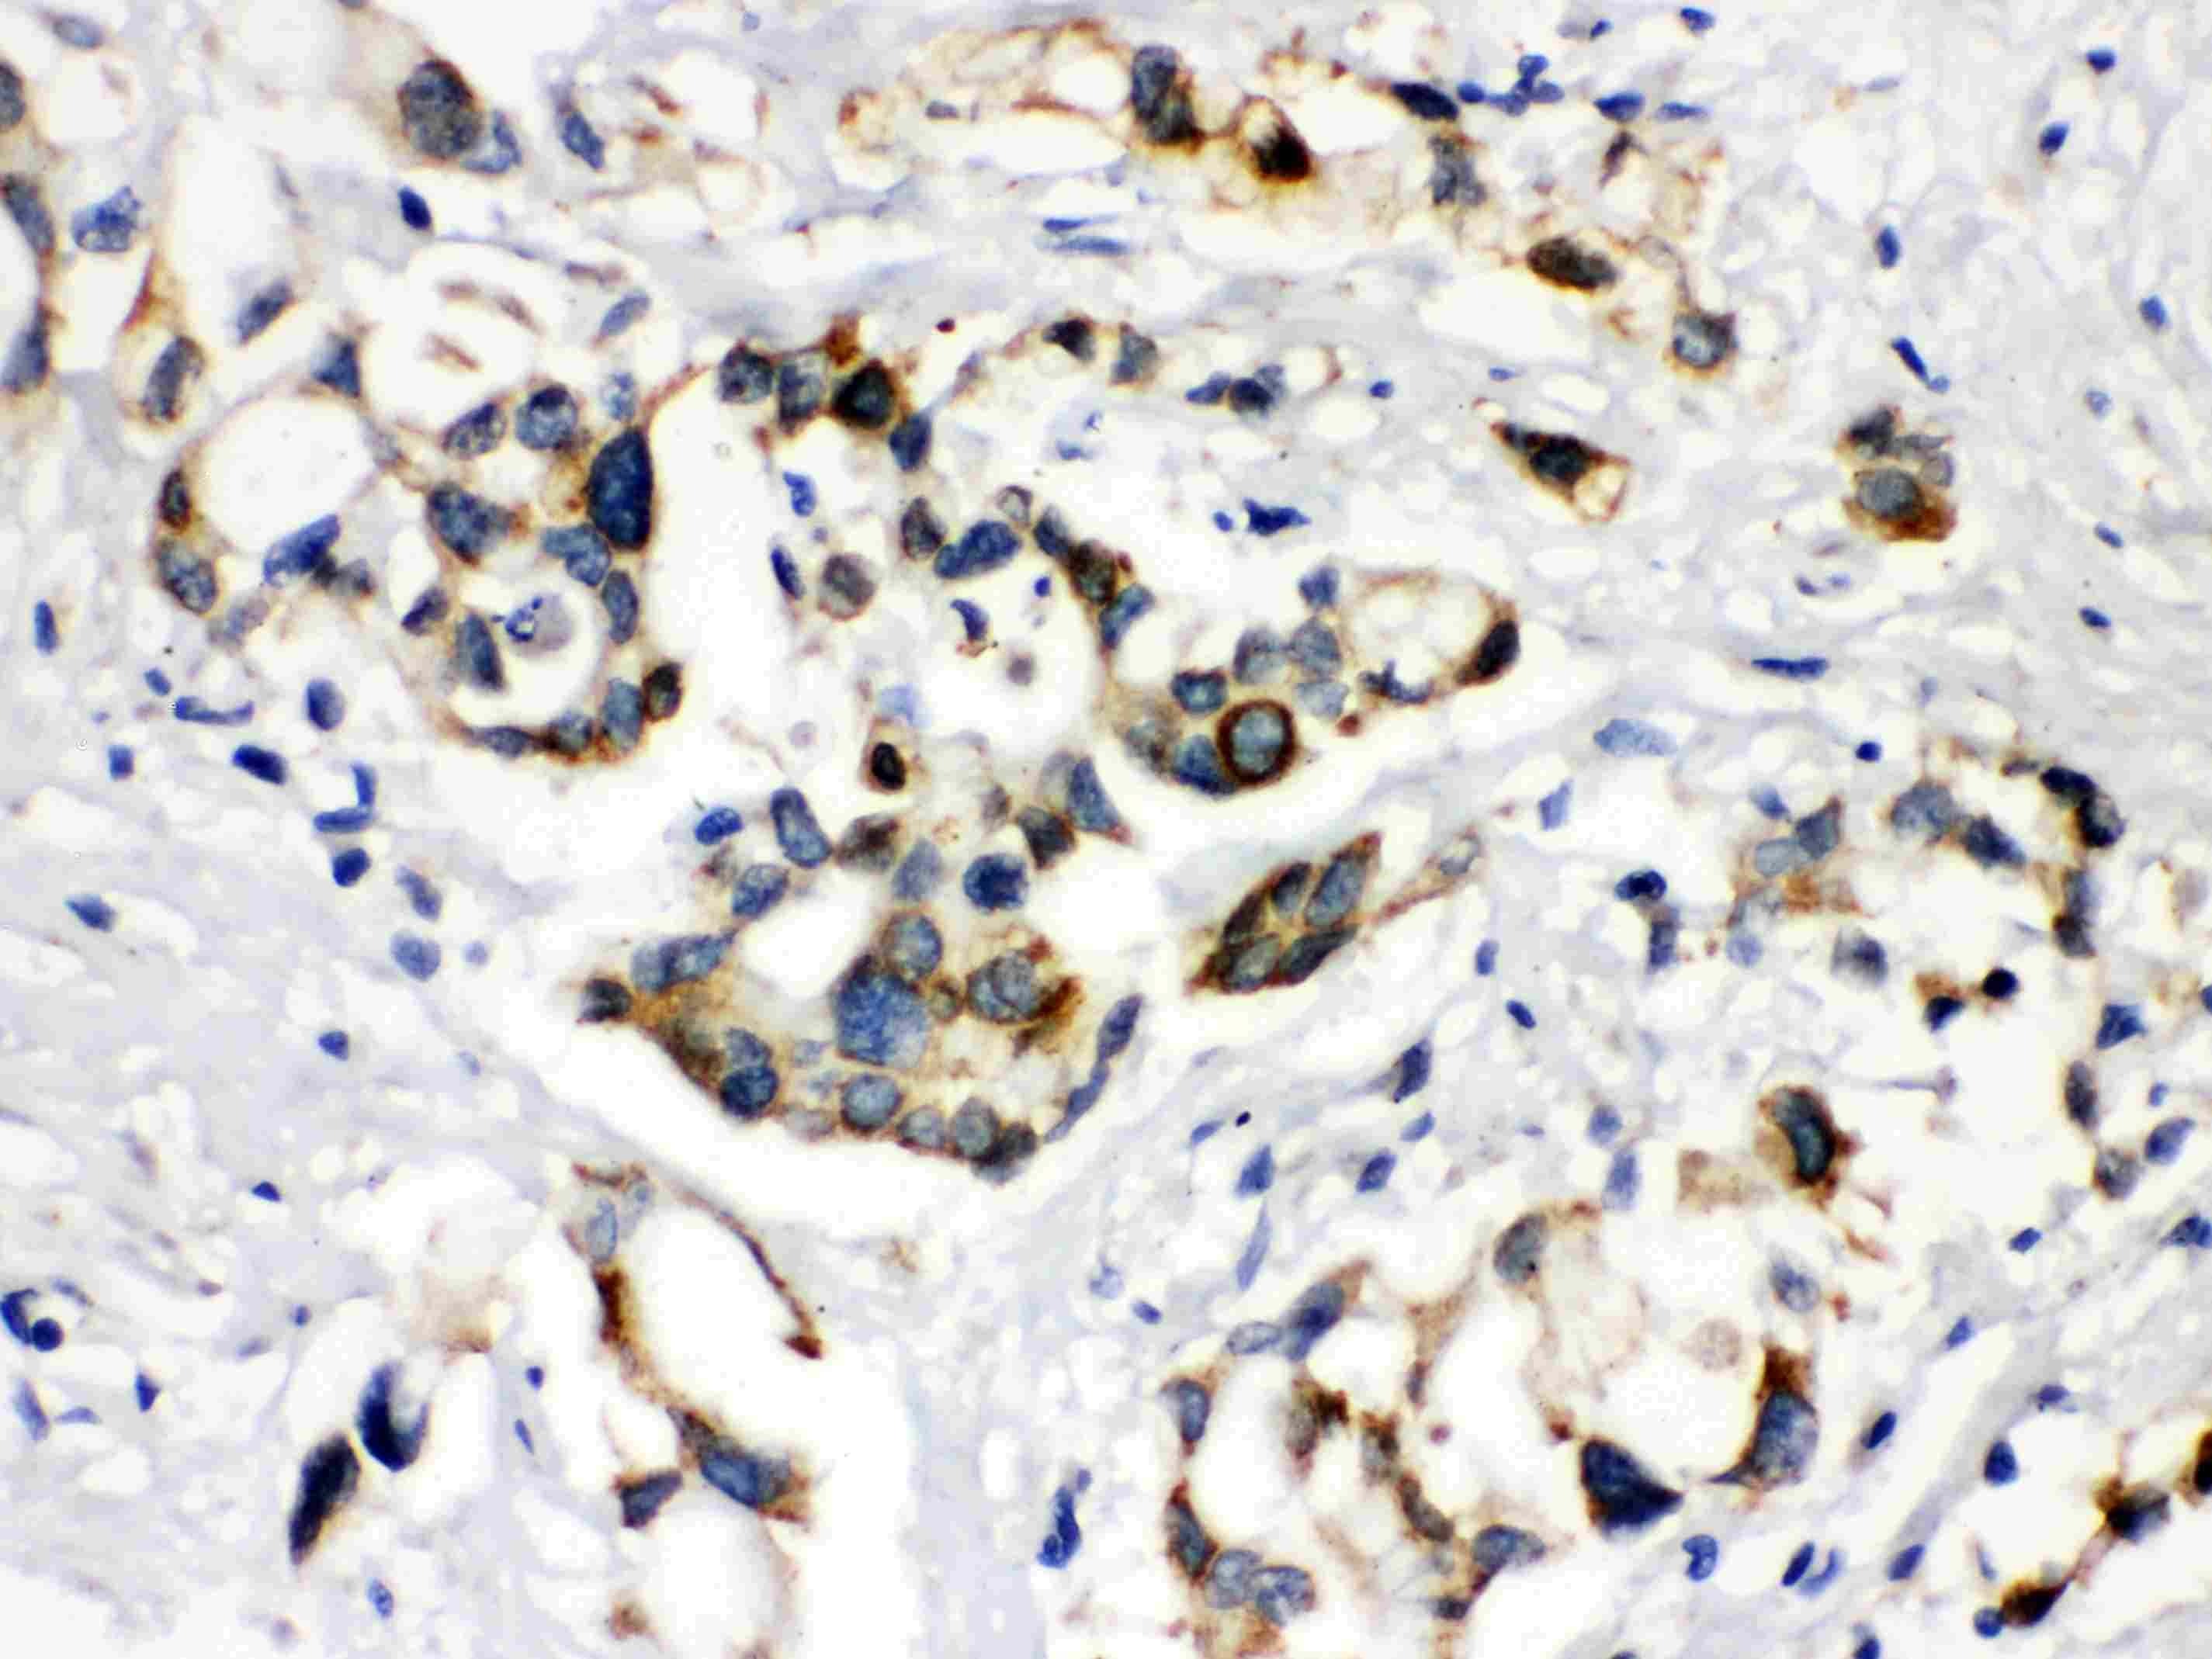
- Immunohistochemistry analysis of BSEP on paraffin-embedded mouse liver tissue. Antigen retrieval was performed using citrate buffer (pH6, epitope retrieval solution) for 20 mins. Sample was blocked using 10% goat serum, incubated with BSEP polyclonal antibody (Product# PA5-78690) with a dilution of 1 µg/mL (overnight at 4°C), and followed by biotinylated goat anti-rabbit IgG (30 minutes at 37°C). Development was performed using Streptavidin-Biotin-Complex (SABC) with DAB chromogen method.
- Submitted by
- Invitrogen Antibodies (provider)
- Main image
- Experimental details
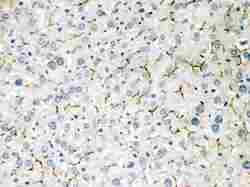
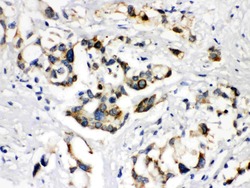
- Immunohistochemistry analysis of BSEP on paraffin-embedded human liver cancer tissue. Antigen retrieval was performed using citrate buffer (pH6, epitope retrieval solution) for 20 mins. Sample was blocked using 10% goat serum, incubated with BSEP polyclonal antibody (Product# PA5-78690) with a dilution of 1 µg/mL (overnight at 4°C), and followed by biotinylated goat anti-rabbit IgG (30 minutes at 37°C). Development was performed using Streptavidin-Biotin-Complex (SABC) with DAB chromogen method.
- Submitted by
- Invitrogen Antibodies (provider)
- Main image
- Experimental details
- Immunohistochemistry (Paraffin) analysis of BSEP in paraffin-embedded section of mouse liver tissues using BSEP Polyclonal Antibody (Product # PA5-78690). Heat mediated antigen retrieval was performed in citrate buffer (pH6, epitope retrieval solution ) for 20 mins. The tissue section was blocked with 10% goat serum. The tissue section was then incubated with the primary antibody at a 1 µg/mL dilution overnight at 4°C. Cy3 conjugated goat anti-rabbit IgG was used as secondary antibody at 1:100 dilution and incubated for 30 minutes at 37°C. The section was counterstained with DAPI. Visualize using a fluorescence microscope and filter sets appropriate for the label used.

Supportive validation
- Submitted by
- Invitrogen Antibodies (provider)
- Main image
- Experimental details
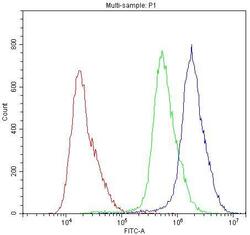
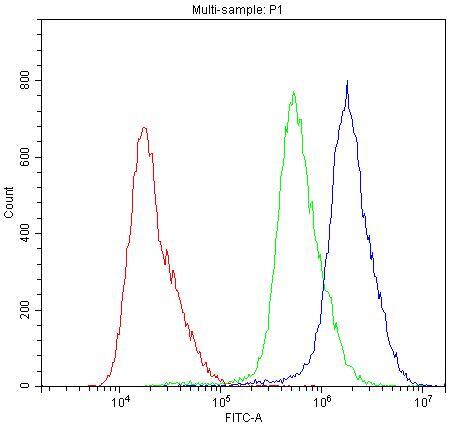
- Flow Cytometry of BSEP in A431 cells (blue line), isotype control rabbit IgG (green line) and unlabeled (red line). Samples were blocked with 10% goat serum, incubated with BSEP Polyclonal Antibody (Product # PA5-78690) at a dilution of 1 μg (per 1x10^6 cells), followed by DyLight®488 conjugated goat anti-rabbit IgG (for 30 minutes at 20°C) using 5-10 μg (per 1x10^6 cells) dilution.
Supportive validation
- Submitted by
- Invitrogen Antibodies (provider)
- Main image

- Experimental details
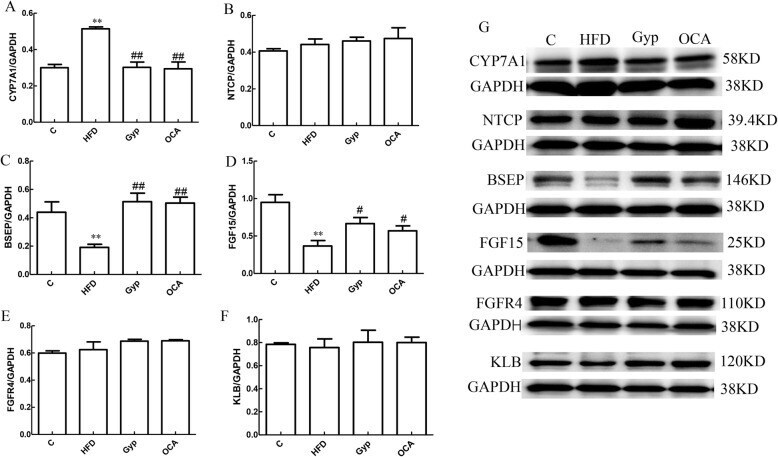
- Fig. 11 Changes in FGF15, FGFR4, KLB, CYP7A1, NTCP, and BSEP protein content in liver tissues among the different experimental groups. a Bar chart representing the relative CYP7A1 protein expression level in liver tissue, b relative NTCP protein expression level, c relative BSEP protein expression level, d relative FGF15 protein expression level, e relative FGFR4 protein expression level, and f relative KLB protein expression level in liver tissue. g Representative autoradiograph image of western blotting with the different antibodies. ** P < 0.01, vs control group; ## P < 0.01, # P < 0.05, vs HFD group. Data are presented as mean +- standard deviation, n = 3. C, control; HFD, high-fat diet; Gyp, gypenosides; OCA, obeticholic acid
- Submitted by
- Invitrogen Antibodies (provider)
- Main image
- Experimental details
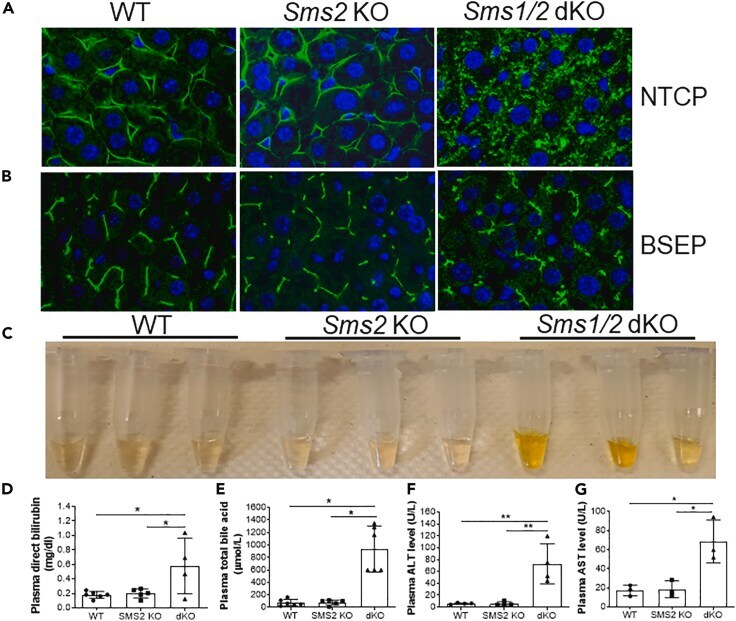
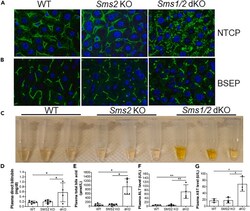
- Figure 2 SMS1 deficiency-mediated hepatocyte impairment Liver sections from 6-month-old WT, Sms2 KO, and Sms1 / Sms2 KO female mice were utilized. (A) Na + -taurocholate co-transporting polypeptide (NTCP) immunostaining for hepatocyte basal membrane. (B) Bile salt export pump (BSEP) immunostaining for hepatocyte apical membrane. The pictures are the representatives of four mice/group. (C) Plasma was collected from WT, Sms2 KO, and Sms1 / Sms2 KO mice, and jaundice was observed. (D) Fluorogram of plasma bilirubin (conjugated) levels. (E) Fluorogram of plasma total bile acid levels. (F and G) Fluorogram of plasma alanine aminotransferase (ALT) and aspartate aminotransferase (AST) levels. Data are represented as mean +- SD, n = 4-6, *p < 0.01.