Explore
 Validate
 Learn
Learn Other assay
Antibody data
- Antibody Data
- Antigen structure
- References [5]
- Comments [0]
- Validations
- Other assay [2]
Submit
Validation data
Reference
Comment
Report error
- Product number
- PA5-22901 - Provider product page

- Provider
- Invitrogen Antibodies
- Product name
- Laminin Polyclonal Antibody, DyLight™ 488
- Antibody type
- Polyclonal
- Antigen
- Other
- Description
- This antibody is pan-specific and reacts well with all Laminin isoforms tested: Laminin-1 (alpha-1, beta-1, and gamma-1) and Laminin-2 (alpha-2, beta-1, and gamma-1).
- Conjugate
- Green dye
- Concentration
- 0.67 mg/mL
Submitted references Environmental Enrichment Induces Meningeal Niche Remodeling through TrkB-Mediated Signaling.
Impaired Skeletal Muscle Development and Regeneration in Transglutaminase 2 Knockout Mice.
TAM kinase signaling is indispensable for proper skeletal muscle regeneration in mice.
Dissecting the immunosuppressive tumor microenvironments in Glioblastoma-on-a-Chip for optimized PD-1 immunotherapy.
Investigation of Postnatal Craniofacial Bone Development with Tissue Clearing-Based Three-Dimensional Imaging.
Zorzin S, Corsi A, Ciarpella F, Bottani E, Dolci S, Malpeli G, Pino A, Amenta A, Fumagalli GF, Chiamulera C, Bifari F, Decimo I
International journal of molecular sciences 2021 Oct 1;22(19)
International journal of molecular sciences 2021 Oct 1;22(19)
Impaired Skeletal Muscle Development and Regeneration in Transglutaminase 2 Knockout Mice.
Budai Z, Al-Zaeed N, Szentesi P, Halász H, Csernoch L, Szondy Z, Sarang Z
Cells 2021 Nov 9;10(11)
Cells 2021 Nov 9;10(11)
TAM kinase signaling is indispensable for proper skeletal muscle regeneration in mice.
Al-Zaeed N, Budai Z, Szondy Z, Sarang Z
Cell death & disease 2021 Jun 12;12(6):611
Cell death & disease 2021 Jun 12;12(6):611
Dissecting the immunosuppressive tumor microenvironments in Glioblastoma-on-a-Chip for optimized PD-1 immunotherapy.
Cui X, Ma C, Vasudevaraja V, Serrano J, Tong J, Peng Y, Delorenzo M, Shen G, Frenster J, Morales RT, Qian W, Tsirigos A, Chi AS, Jain R, Kurz SC, Sulman EP, Placantonakis DG, Snuderl M, Chen W
eLife 2020 Sep 10;9
eLife 2020 Sep 10;9
Investigation of Postnatal Craniofacial Bone Development with Tissue Clearing-Based Three-Dimensional Imaging.
Luo W, Yi Y, Jing D, Zhang S, Men Y, Ge WP, Zhao H
Stem cells and development 2019 Oct 1;28(19):1310-1321
Stem cells and development 2019 Oct 1;28(19):1310-1321
No comments: Submit comment
Supportive validation
- Submitted by
- Invitrogen Antibodies (provider)
- Main image

- Experimental details
- Figure 5 The meningeal niche responds to fluoxetine treatment. ( A ) Schematic representation of the experimental design used for fluoxetine administration. ( B ) Schematic representation of behavioral testing for OCD-like behavior via the marble burying test (MBT). ( C ) Graph showing the percentage of marbles buried by treated (FLUOX) and non-treated (CTRL) animals. ( D , E ) Sagittal brain sections of the CD1 mice, showing the presence of Ki67 + cells (green) and DCX + cells (red) in the hippocampal dentate gyri (DGs) in the CTRL and FLUOX animals. A white box highlights a DG zone reported as a magnification on the right panel. ( F ) Graph showing the number of Ki67 + cells per mm 2 of DG in the CTRL and FLUOX animals. ( G ) Graph showing the number of DCX + cells per mm 2 of DG in the CTRL and FLUOX animals. ( H ) Sagittal brain section of the CD1 mice, showing the brain meningeal nuclei and meningeal basal laminin (green) in a FLUOX animal. ( I ) Sagittal brain section of CD1 mice, showing a brain meningeal Ki67 + (green) cell in a FLUOX animal. The meninges are delineated via white dashes. ( J ) Sagittal brain sections of CD1 mice, showing brain meningeal GLAST + cells in the CTRL and FLUOX mice. The meninges are delineated via white dashes. ( K ) Sagittal brain sections of CD1 mice, showing brain meningeal beta3-Tubulin + (red) cells in the CTRL and FLUOX mice. The meninges are delineated via white dashes. ( L ) Sagittal brain sections of CD1 mice, showing fractones (*
- Conjugate
- Green dye

- Submitted by
- Invitrogen Antibodies (provider)
- Main image

- Experimental details
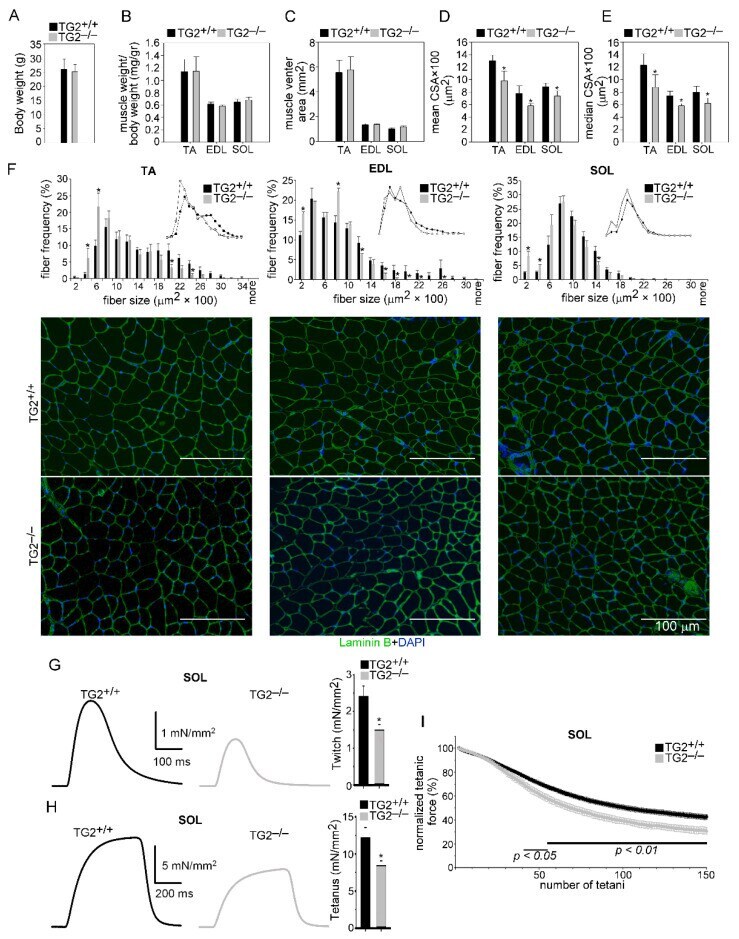
- Figure 1 Loss of TG2 impairs muscle development and function. ( A ) Body weights of TG2 +/+ and TG2 -/- mice. ( B ) The ratio of muscle weight/body weight, ( C ) muscle venter area, ( D ) mean myofiber cross-sectional area, and ( E ) median myofiber cross-sectional area (CSA) of TA, EDL, and SOL muscles in TG2 +/+ and TG2 -/- mice. Data are expressed as mean or median +- SD. ( F ) Distribution of myofiber sizes in control TA, EDL, and SOL muscles of TG2 +/+ and TG2 -/- mice with their representative immunofluorescence images of laminin (green) and DAPI (blue) nuclear staining. Data are expressed as mean +- SEM ( n = 6). In total, 500 or more myofibers were analyzed in each sample using ImageJ software. Scale bars, 100 um. ( G ) Representative and averaged peak ex vivo twitch and ( H ) tetanic force in soleus muscle from TG2 +/+ and TG2 -/- mice stimulated at 0.5 or 100 Hz, respectively, at room temperature (23-25 degC). The force was normalized to the cross-sectional area of the muscle. ( I ) Fatigue of SOL muscle was evoked with 150 tetani at a frequency of 0.5 Hz, and the amplitude of consecutive tetani was normalized to first tetanus developed. Solid horizontal lines below the data points represent the interval where data are significantly different from TG2 +/+ . The number of animals and muscles investigated is given in Table 1 . Asterisks indicate statistically significant difference (* p < 0.05, Student's t -test).
- Conjugate
- Green dye