Explore
 Validate
 Learn
Learn Western blot
 Immunocytochemistry
 Flow cytometry
Antibody data
- Antibody Data
- Antigen structure
- References [0]
- Comments [0]
- Validations
- Immunocytochemistry [2]
- Immunohistochemistry [3]
- Other assay [6]
Submit
Validation data
Reference
Comment
Report error
- Product number
- PA1-16730 - Provider product page

- Provider
- Invitrogen Antibodies
- Product name
- Laminin Polyclonal Antibody
- Antibody type
- Polyclonal
- Antigen
- Other
- Description
- This antibody is pan-specific and reacts well with all Laminin isoforms tested: Laminin-1 (alpha-1, beta-1, and gamma-1) and Laminin-2 (alpha-2, beta-1, and gamma-1). The antibody functionally inhibits Laminin in mouse and rat. It binds to Laminin and inhibits most, if not all, of its cell adhesion and growth promotive properties. Immunostaining is enhanced by antigen retrieval with pepsin, especially paraffin tissue. Suggested positive control: basement membranes (blood vessels of any tissue, tumors, nerve).
- Reactivity
- Human, Mouse, Rat, Chicken/Avian, Hamster, Rabbit
- Host
- Rabbit
- Isotype
- IgG
- Vial size
- 100 μL
- Concentration
- 1 mg/mL
- Storage
- -20°C or -80°C if preferred
No comments: Submit comment
Supportive validation
- Submitted by
- Invitrogen Antibodies (provider)
- Main image

- Experimental details
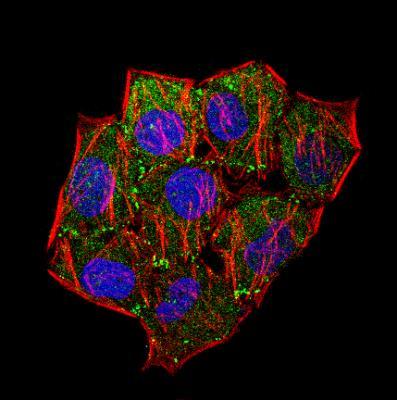
- Immunocytochemistry analysis of Laminin in HeLa cells. Samples were incubated in Laminin polyclonal antibody (Product # PA1-16730) followed by Alexa Fluor 488-conjugated Goat to rabbit IgG secondary antibody (green, A). Actin filaments were labeled with Alexa Fluor 568 phalloidin (red, B). DAPI was used to stain the cell nuclei (blue, C).
- Submitted by
- Invitrogen Antibodies (provider)
- Main image

- Experimental details
- Immunocytochemistry analysis of Laminin in HeLa cells. Samples were incubated in Laminin polyclonal antibody (Product # PA1-16730) followed by Alexa Fluor 488-conjugated Goat to rabbit IgG secondary antibody (green, A). Actin filaments were labeled with Alexa Fluor 568 phalloidin (red, B). DAPI was used to stain the cell nuclei (blue, C).

Supportive validation
- Submitted by
- Invitrogen Antibodies (provider)
- Main image
- Experimental details
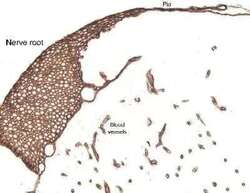
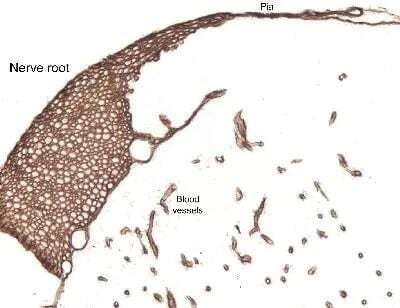
- Immunohistochemical analysis of Laminin in paraformaldehyde/paraffin-embedded rat spinal cord and dorsal root tissue. Samples were incubated in Laminin polyclonal antibody (Product # PA1-16730). Pepsin antigen retrieval was performed on this tissue sample.
- Submitted by
- Invitrogen Antibodies (provider)
- Main image

- Experimental details
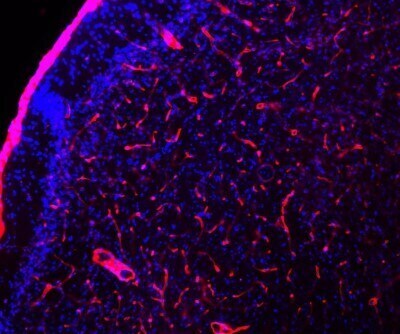
- Immunohistochemical analysis of Laminin in mouse sections of cortex. Samples were incubated in Laminin polyclonal antibody (Product # PA1-16730). Antibody is red. Blue is DAPI staining of DNA. This antibody reveals strong staining in the basement membranes of blood vessels.
- Submitted by
- Invitrogen Antibodies (provider)
- Main image
- Experimental details
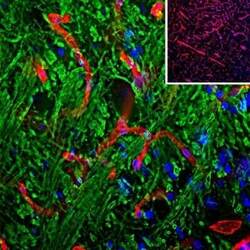
- Immunohistochemical analysis of Laminin in brain stem sections. Samples were incubated in Laminin polyclonal antibody (Product # PA1-16730) using a dilution of 1:1,000 (red). Costained with chicken pAb to Myelin Basic Protein (MBP), dilution 1:5,000 in green. The blue is DAPI staining of nuclear DNA. Following transcardial perfusion of rat with 4% paraformaldehyde, brain was post fixed for 24 hours, cut to 45 µM, and free-floating sections were stained with the above antibodies. The laminin antibody is an excellent marker of basement membranes surrounding blood vessels, while the MBP antibody stains the myelin sheathes around axons.

Supportive validation
- Submitted by
- Invitrogen Antibodies (provider)
- Main image

- Experimental details
- NULL
- Submitted by
- Invitrogen Antibodies (provider)
- Main image
- Experimental details
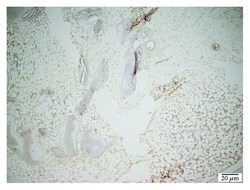
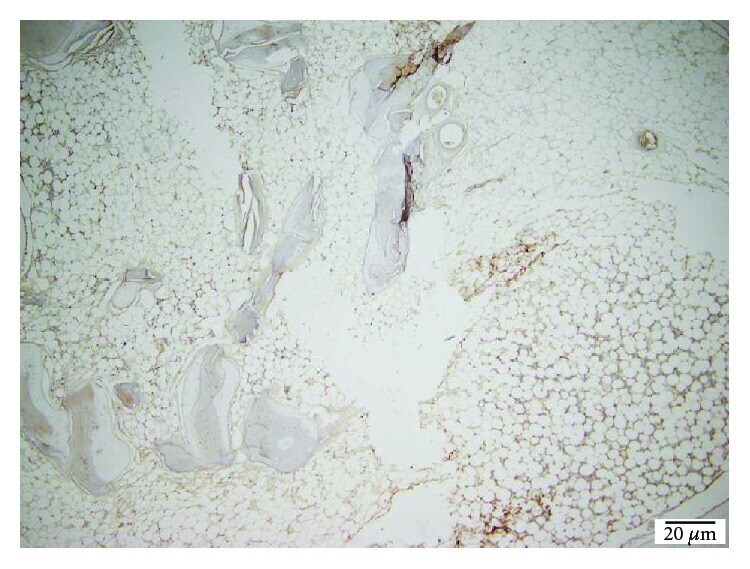
- Figure 13 TCP 40x laminin stain showing moderate scaring.
- Submitted by
- Invitrogen Antibodies (provider)
- Main image
- Experimental details
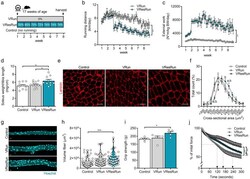
- Fig. 1 Running pattern and muscle hypertrophy are load-dependent. a Experimental set-up. b Average running distances and c average external work per night throughout the exercise protocol ( n = 16 mice per group). d Soleus weight normalized to tibia length. e Representative cross-sections stained for laminin (red) and f quantification ( n = 7-8 mice per group) of fiber cross-sectional area distribution in soleus muscle. g Representative pictures of single myofibers isolated from soleus and ( h quantification of fiber volume of 11-16 single myofibers per mouse ( n = 4 mice per group). i Muscle force production by grip strength and j time-to-fatigue in ex vivo stimulated muscle. Statistics, one-way ANOVA test with Tukey correction for multiple comparisons ( d , h , i , j ) or two-way ANOVA test with a Bonferroni post hoc test ( b , c , f , k ). (* p < 0.05; ** p < 0.01; *** p < 0.001). Each dot represents a single mouse ( d , i , j ) or muscle fiber ( h ). Bar graphs ( d , i , j ) and line graphs ( b , c , f , k ) represent mean +- SEM (error bars). Violin plot ( h ). Scale bars, 50 mum ( e ) and 25 mum ( g ). Pax7 mTmG/+ female mice on a C57BL/6J background were used for all analyses
- Submitted by
- Invitrogen Antibodies (provider)
- Main image

- Experimental details
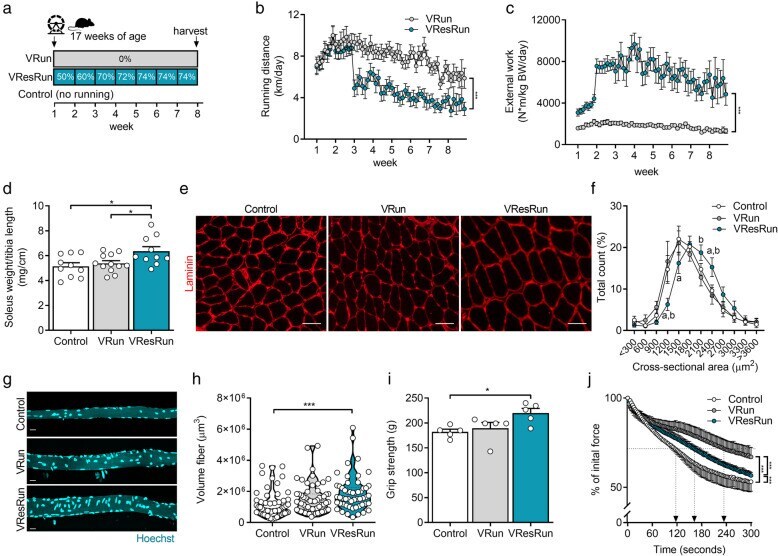
- Additional file 2: Figure S2. Muscle hypertrophy is muscle dependent, fiber type dependent and load-dependent. (A) Representative cross-sections for m. soleus (SOL) stained for MyHCI (green), MyHCIIa (blue) and Laminin (red). (B,C) Quantification of fiber cross-sectional area distribution and (D,E) average fiber cross-sectional area. (F) Representative cross-sections for plantaris (PLT) stained for MyHCIIa (blue), MyHCIIb (yellow) and laminin. (G,H) quantification of fiber cross-sectional area distribution and (I,J) average fiber cross-sectional area. (K) Fiber cross-sectional area distribution for gastrocnemius (GAS), (L) tibialis anterior (TA) and (M) extensor digitorum longus (EDL). Statistics: one-way ANOVA test with Tukey correction for multiple comparisons (*p < 0.05; **p < 0.01; ***p < 0.001) (a, p < 0.05 VResRun compared to Control; b, p < 0.05 VResRun compared to VRun; c, p < 0.05 VRun compared to Control). Bar graphs and line graphs represent mean +- SEM (error bars). Scale bar, 100 mum.
- Submitted by
- Invitrogen Antibodies (provider)
- Main image

- Experimental details
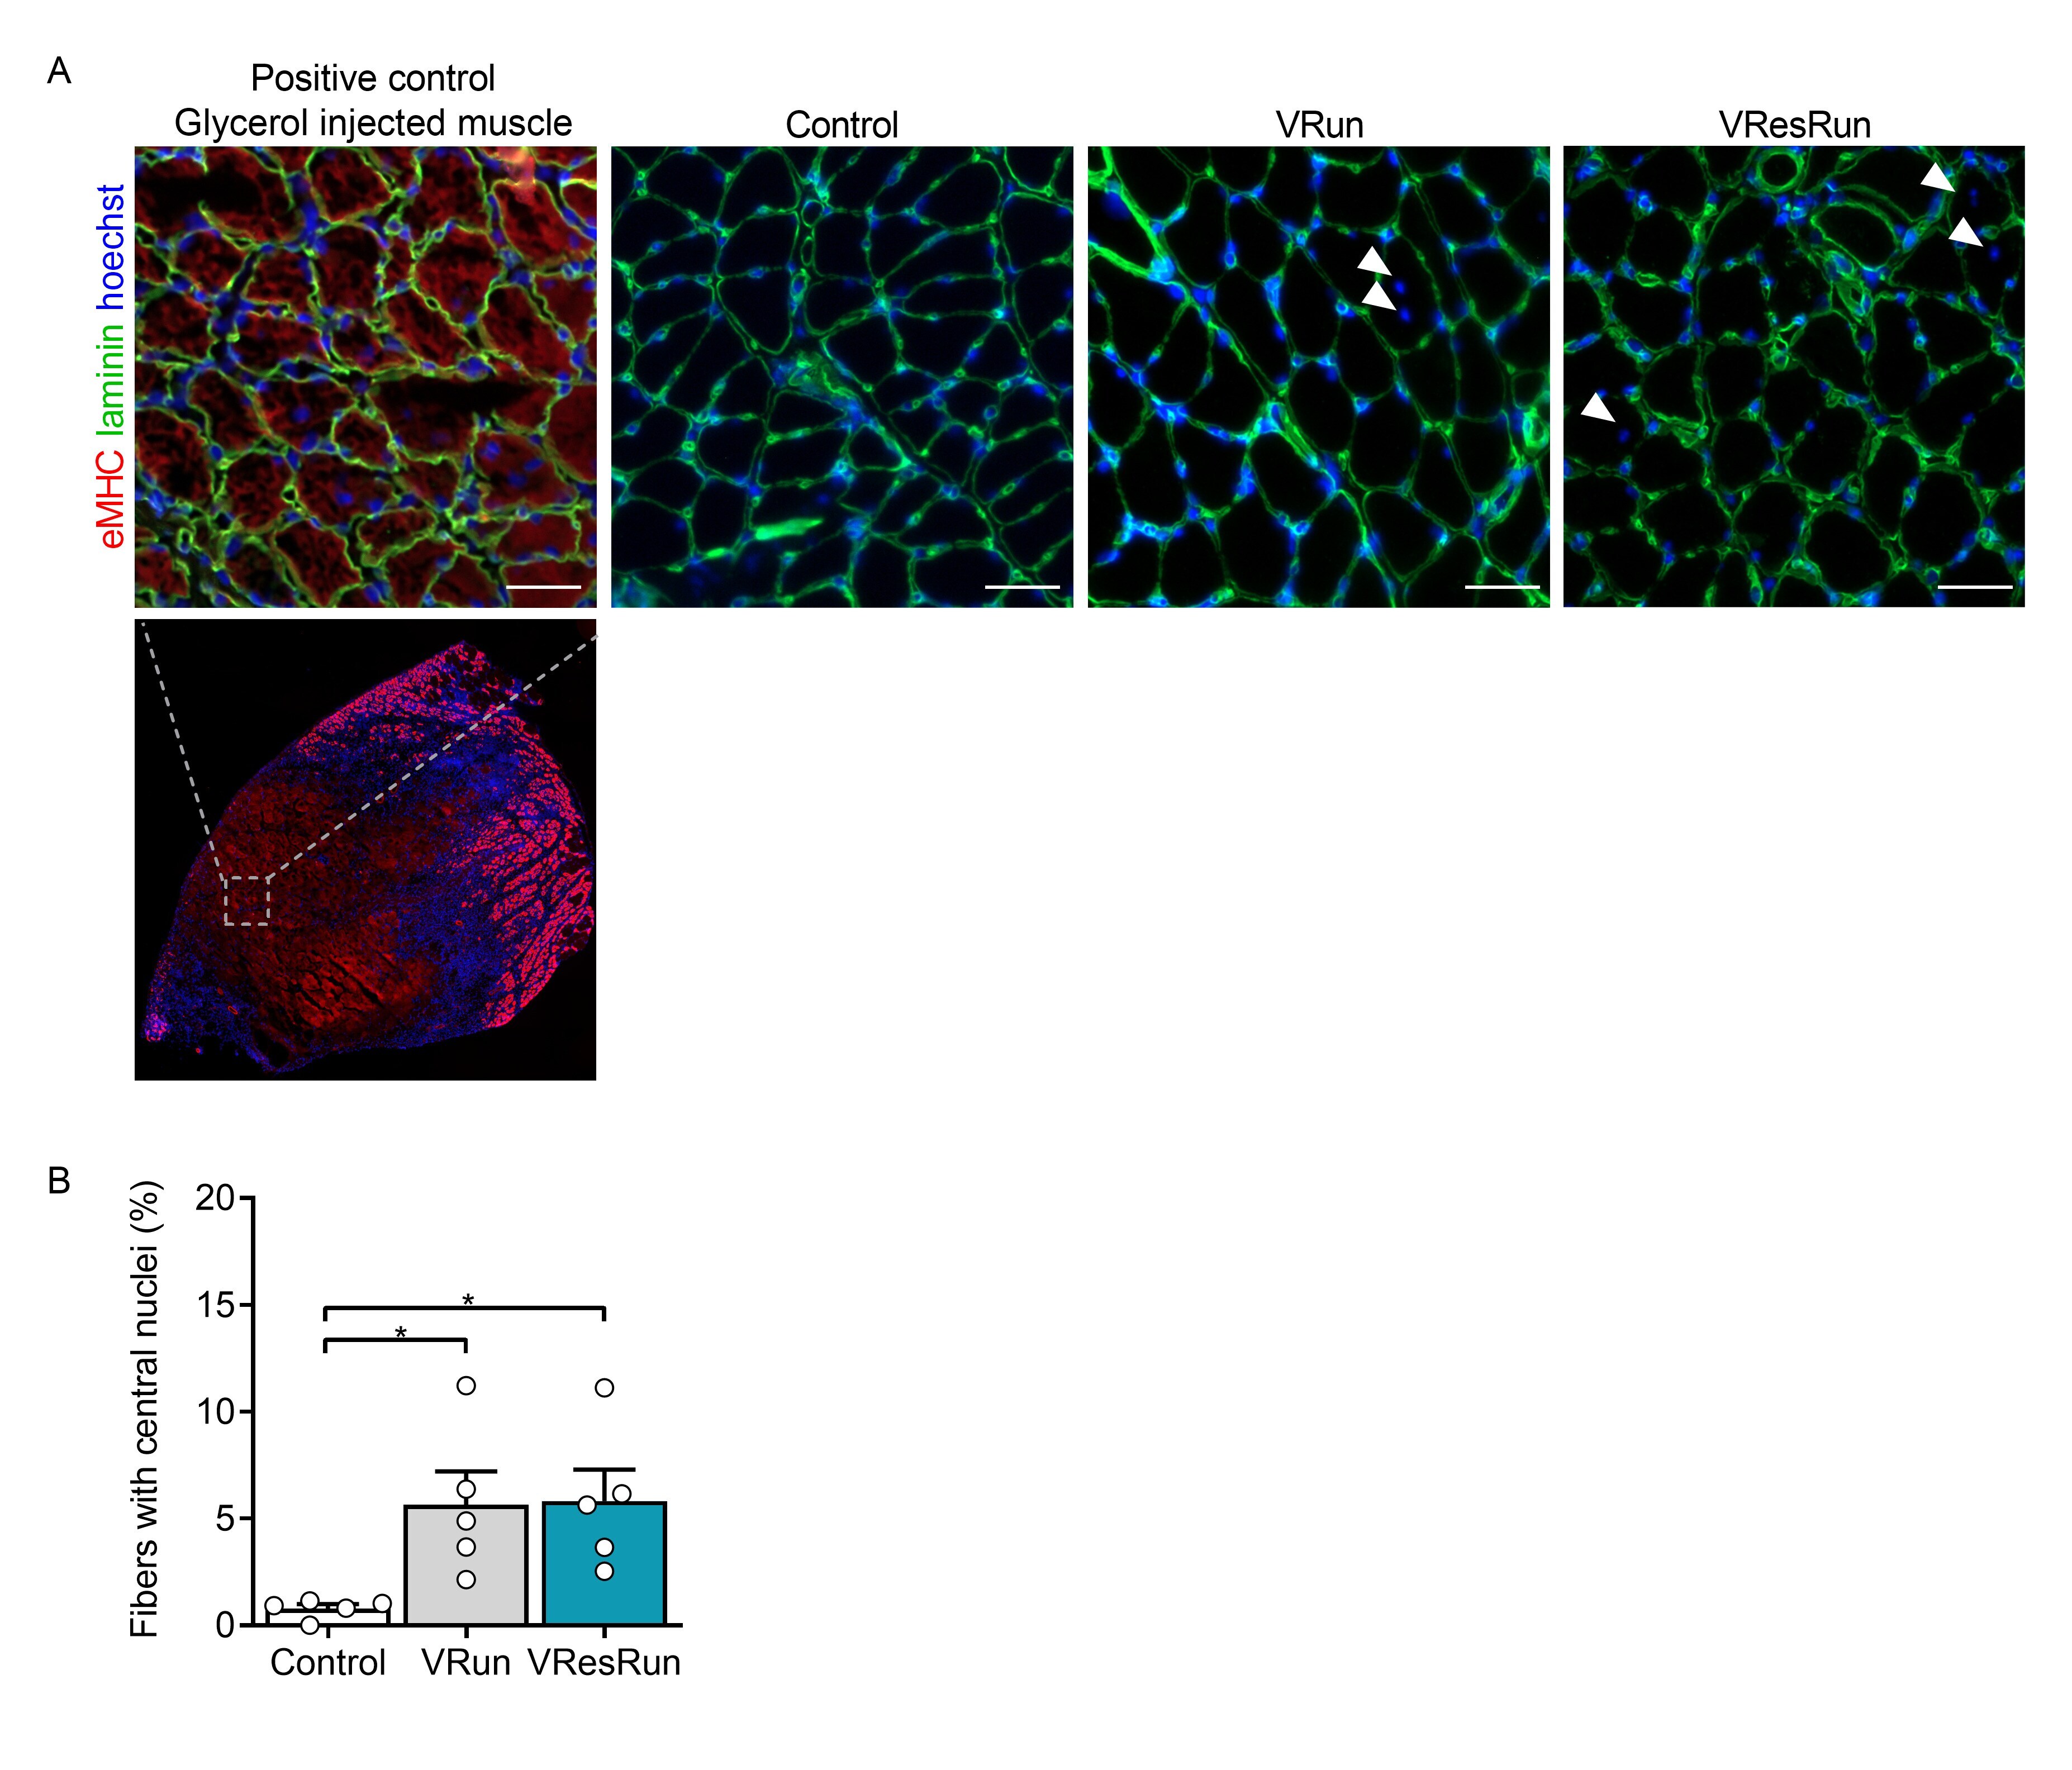
- Additional file 3: Figure S3. Fiber remodeling and central nuclei. (A) Myofibers stained for embryonic myosin heavy chain (eMHC), laminin and hoechst. No eMHC + fibers were detected in Control, VRun, VResRun. Glycerol injected muscle was used as a positive control. (B) Quantification of fibers containing one or more centrally located nucleus. Arrows indicate central nuclei. Bar graph represents mean +- SEM (error bars). Statistics: one-way ANOVA test with Tukey correction for multiple comparisons (*p < 0.05). Each dot represents a single mouse. Scale bar, 50 mum.
- Submitted by
- Invitrogen Antibodies (provider)
- Main image

- Experimental details
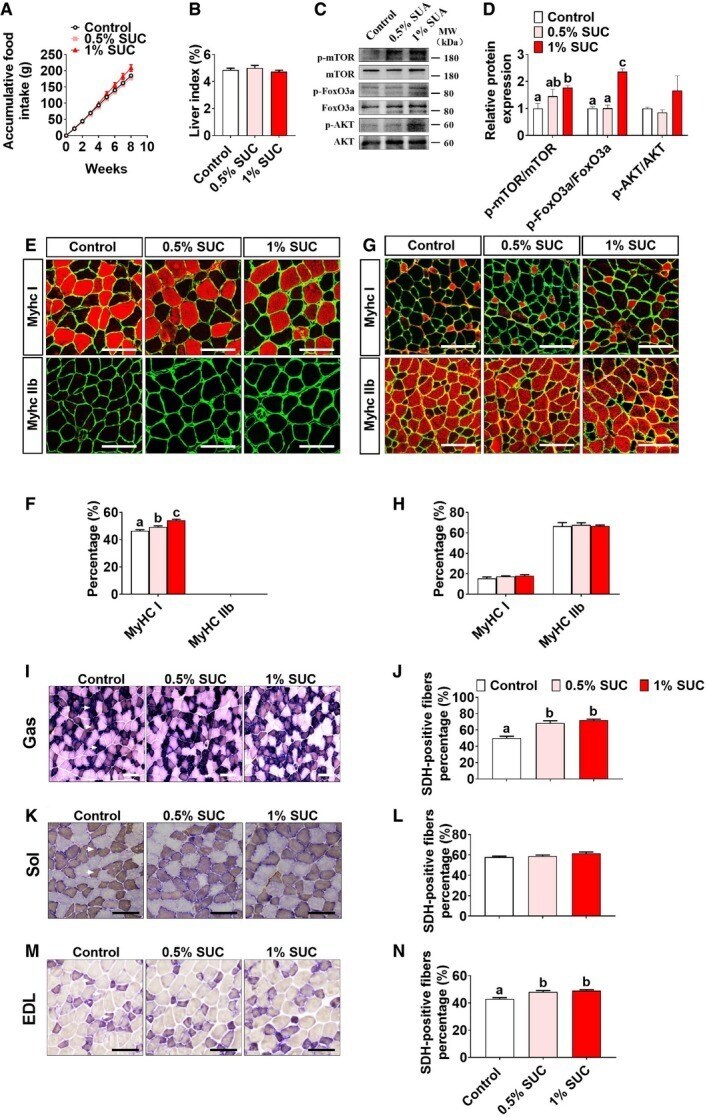
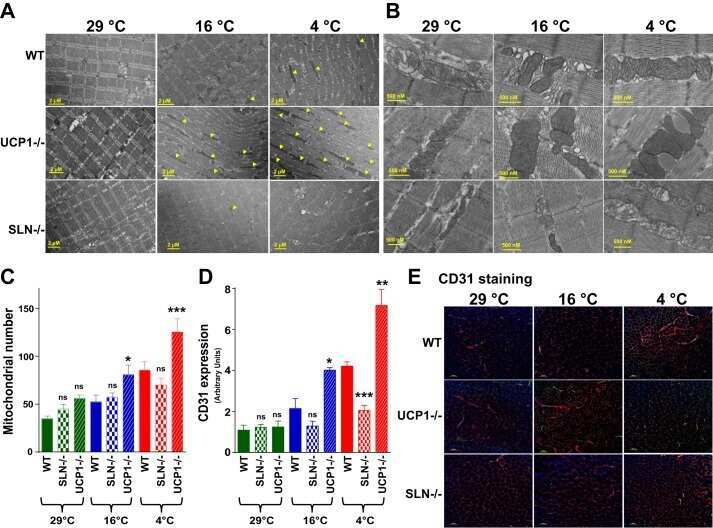
- Figure EV1 Effects of succinate on growth performance and muscle fiber composition in mice (related to Figs 1 and 3 ) Male C57BL/6J mice were fed with chow diet supplemented with 0, 0.5%, or 1% SUC for 8 weeks. A, B (A) Cumulative food intake and (B) liver index of mice treated with SUC for 8 weeks ( n = 8). C, D Immunoblots and quantification of p-mTOR, mTOR, p-FoxO3a, FoxO3a, p-AKT, and AKT protein in gastrocnemius ( n = 3). E-H Representative images and quantification of laminin (green), MyHC I (red), and MyHC IIb (red) immunofluorescent staining in the (E, F) soleus and (G, H) extensor digitorum longus muscle. The graphs show the MyHC I and MyHC IIb fiber ratios ( n = 6). Scale bar in (E, G) represents 100 mum. I-N The percentage of SDH positive in the (I, J) gastrocnemius, (K, L) soleus, and (M, N) extensor digitorum longus muscle is shown by SDH enzyme staining. Only darkly stained SDH fibers are treated as SDH-positive fibers. The graphs show the SDH-positive fiber ratios ( n = 4-6). Scale bar in I, K, and M represents 100 mum. Data information: Results are presented as mean +- SEM. Different letters between bars mean P