Explore
 Validate
 Learn
Learn Western blot
Antibody data
- Antibody Data
- Antigen structure
- References [4]
- Comments [0]
- Validations
- Western blot [3]
- Immunocytochemistry [1]
- Other assay [6]
Submit
Validation data
Reference
Comment
Report error
- Product number
- PA5-17570 - Provider product page

- Provider
- Invitrogen Antibodies
- Product name
- Caspase 1 Polyclonal Antibody
- Antibody type
- Polyclonal
- Antigen
- Synthetic peptide
- Description
- PA5-17570 detects Caspase 1 in WB application with human samples. It is not recommended to aliquot this antibody.
- Reactivity
- Human
- Host
- Rabbit
- Isotype
- IgG
- Vial size
- 100 µL
- Concentration
- 125 µg/mL
- Storage
- -20°C
Submitted references Excess fatty acids induce pancreatic acinar cell pyroptosis through macrophage M1 polarization.
Exenatide Attenuates Non-Alcoholic Steatohepatitis by Inhibiting the Pyroptosis Signaling Pathway.
Burkholderia pseudomallei triggers canonical inflammasome activation in a human primary macrophage-based infection model.
Priming and Activation of Inflammasome by Canarypox Virus Vector ALVAC via the cGAS/IFI16-STING-Type I IFN Pathway and AIM2 Sensor.
Xia W, Lu Z, Chen W, Zhou J, Zhao Y
BMC gastroenterology 2022 Feb 19;22(1):72
BMC gastroenterology 2022 Feb 19;22(1):72
Exenatide Attenuates Non-Alcoholic Steatohepatitis by Inhibiting the Pyroptosis Signaling Pathway.
Liu Y, Wang DW, Wang D, Duan BH, Kuang HY
Frontiers in endocrinology 2021;12:663039
Frontiers in endocrinology 2021;12:663039
Burkholderia pseudomallei triggers canonical inflammasome activation in a human primary macrophage-based infection model.
Lichtenegger S, Stiehler J, Saiger S, Zauner A, Kleinhappl B, Bernecker C, Schlenke P, Wagner GE, Krause K, Gastager M, Steinmetz I
PLoS neglected tropical diseases 2020 Nov;14(11):e0008840
PLoS neglected tropical diseases 2020 Nov;14(11):e0008840
Priming and Activation of Inflammasome by Canarypox Virus Vector ALVAC via the cGAS/IFI16-STING-Type I IFN Pathway and AIM2 Sensor.
Liu F, Niu Q, Fan X, Liu C, Zhang J, Wei Z, Hou W, Kanneganti TD, Robb ML, Kim JH, Michael NL, Sun J, Soong L, Hu H
Journal of immunology (Baltimore, Md. : 1950) 2017 Nov 1;199(9):3293-3305
Journal of immunology (Baltimore, Md. : 1950) 2017 Nov 1;199(9):3293-3305
No comments: Submit comment
Supportive validation
- Submitted by
- Invitrogen Antibodies (provider)
- Main image
- Experimental details
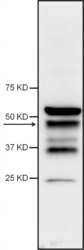
- Western blot analysis of Caspase 1 was performed by loading 35 µg of THP-1 lysate in reducing sample buffer onto a 4-15% Precast Protein Gels. Proteins were transferred to PVDF and then blocked in blocking buffer (TBST+5% non-fat milk) for one hour at room temperature. Caspase 1 was detected at approximately 45 kDa using a caspase 1 polyclonal antibody (Product # PA5-17570) at a dilution of 1:1000 overnight at 4°C on a rocking platform, followed by a Rabbit IgG Horseradish Peroxidase-conjugated Antibody at a dilution of 1:1,000 for one hour. Chemiluminescent detection was performed using SuperSignal™ West Pico Chemiluminescent Substrate (Product # 34080).

- Submitted by
- Invitrogen Antibodies (provider)
- Main image

- Experimental details
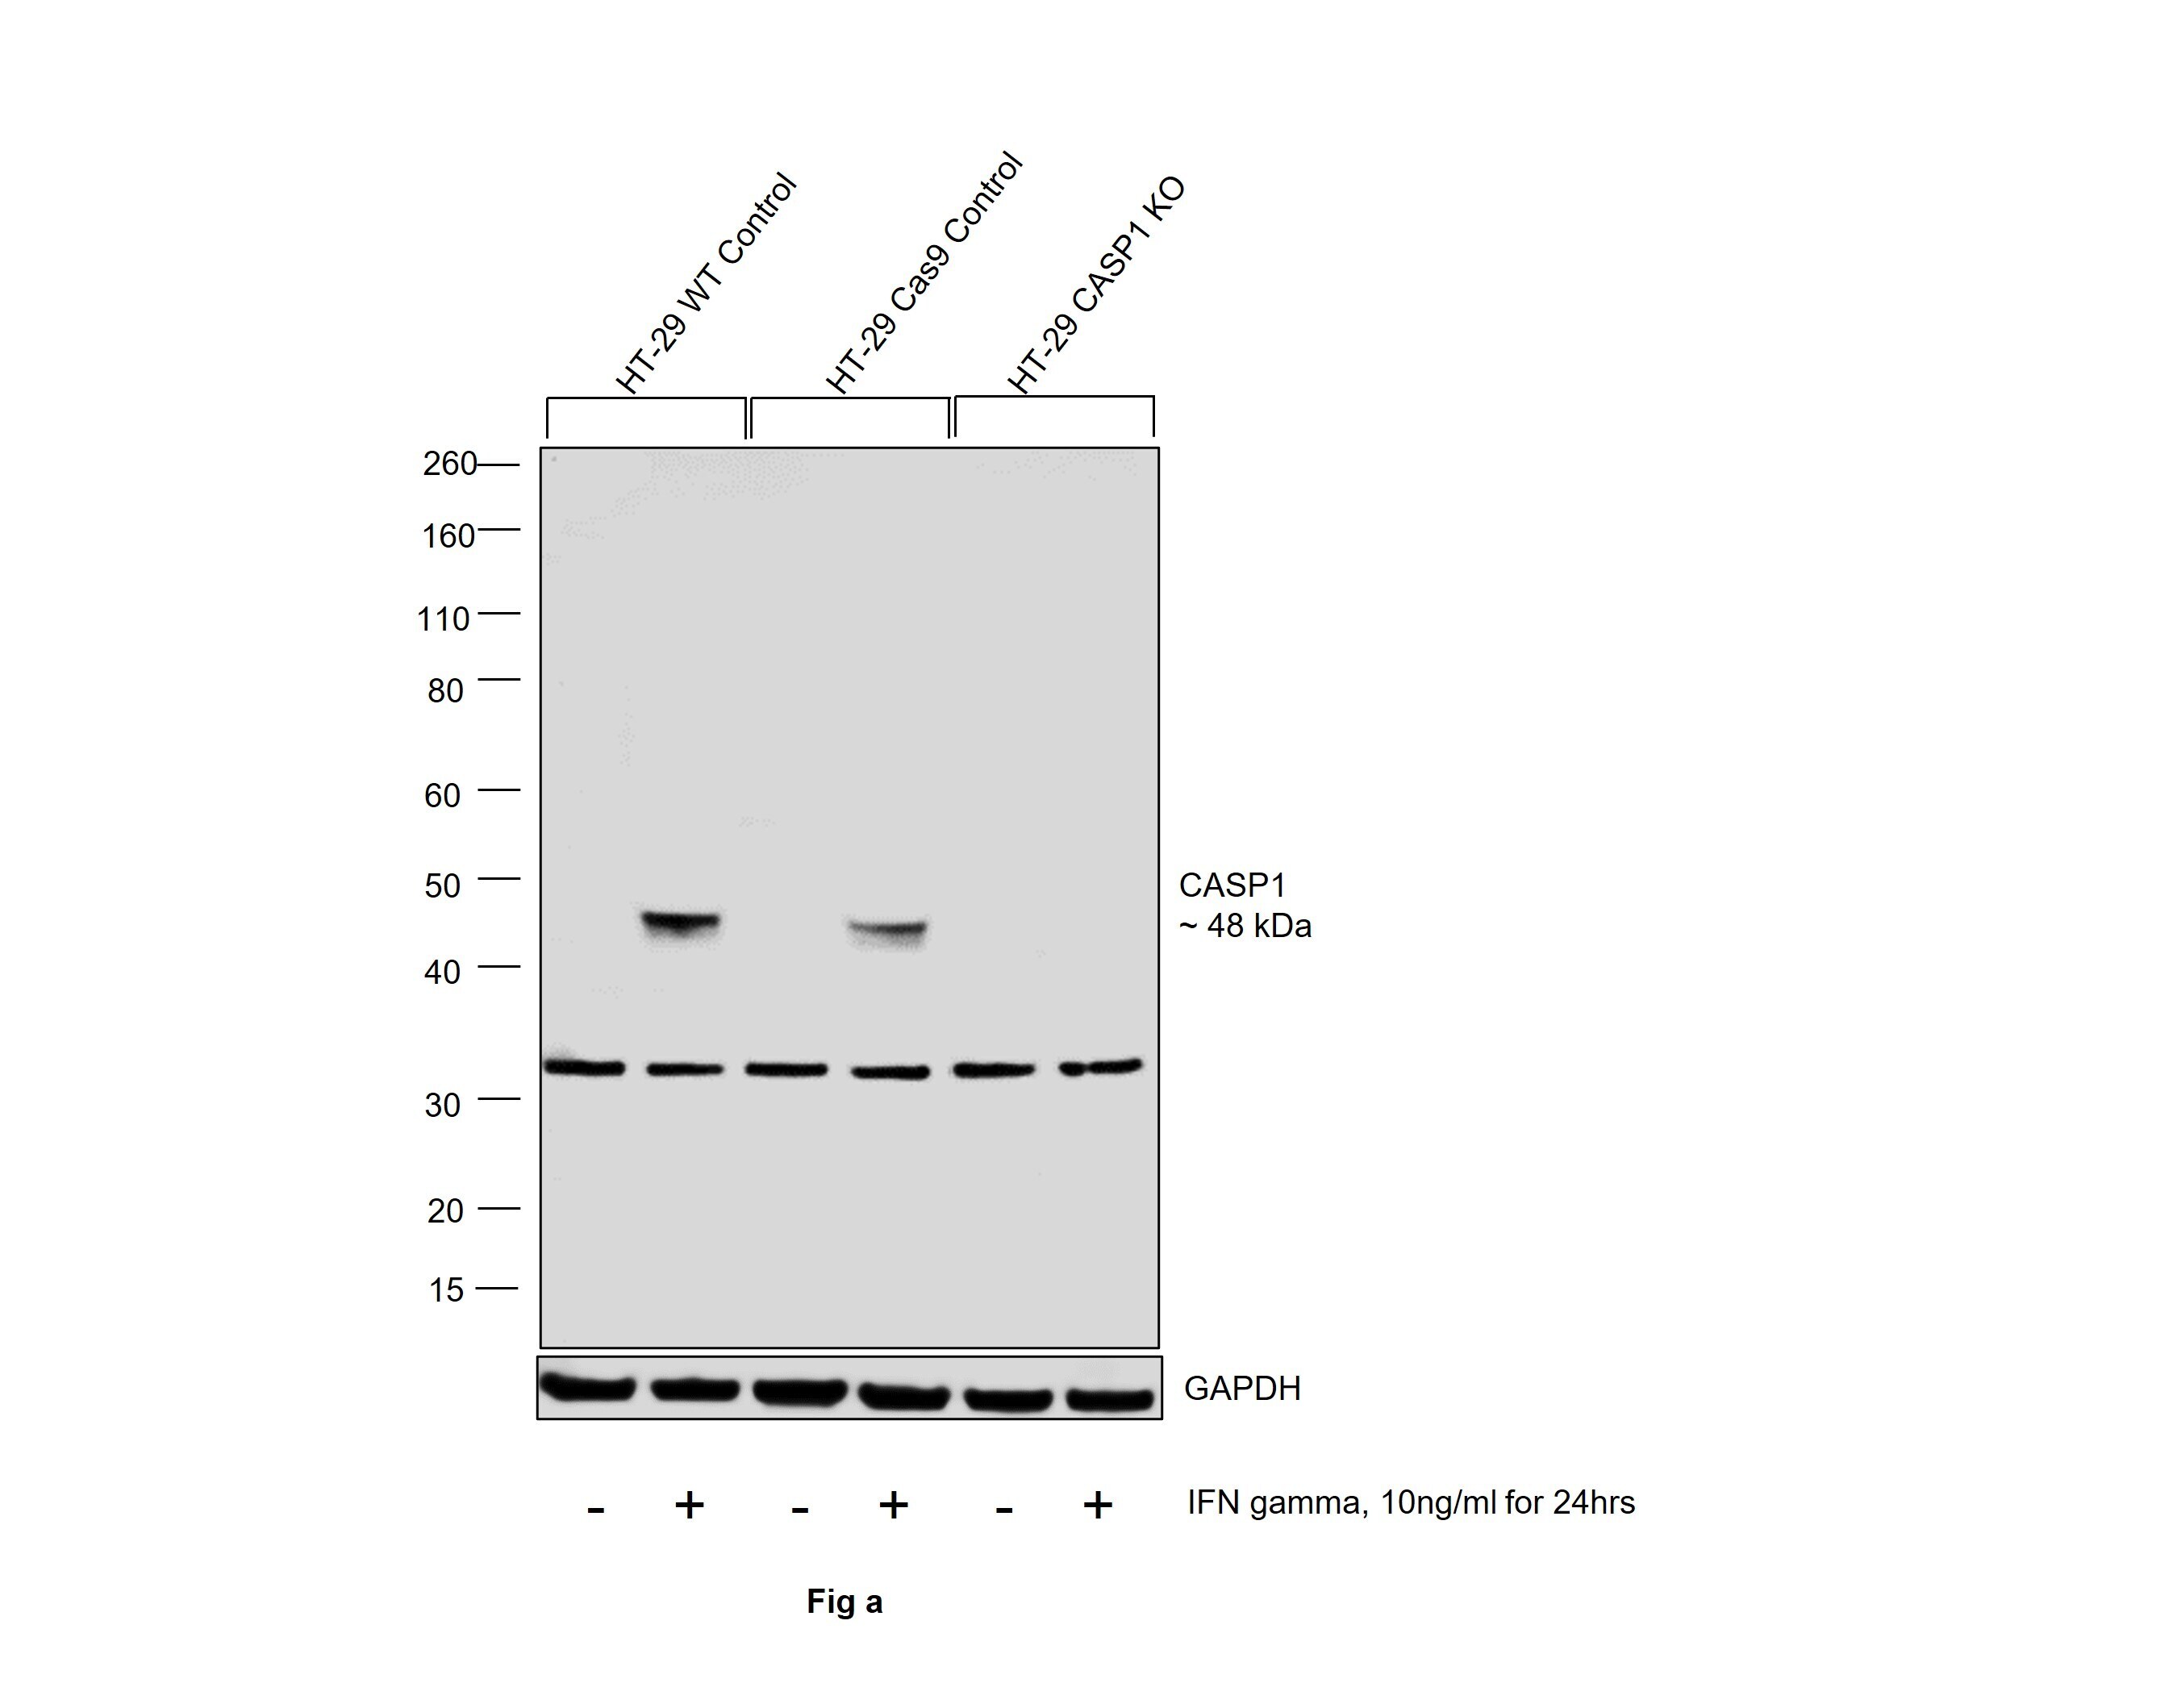
- Knockout of CASP1 was achieved by CRISPR-Cas9 genome editing using LentiArray™ Lentiviral sgRNA (Product # A32042, Assay ID CRISPR917229_LV) and LentiArray Cas9 Lentivirus (Product # A32064). Western blot analysis of CASP1 was performed by loading 30 µg of HT-29 wild type (Lane 1), HT-29 wild type treated with 10 ng/mL IFN gamma for 24hrs (Lane 2),HT-29 Cas9 (Lane 3), HT-29 Cas9 treated with 10 ng/mL IFN gamma for 24hrs (Lane 4), HT-29 CASP1 KO (Lane 5) and HT-29 CASP1 KO treated with 10 ng/mL IFN gamma for 24hrs (Lane 6) whole cell extracts. The samples were electrophoresed using NuPAGE™ Novex™ 4-12% Bis-Tris Protein Gel (Product # NP0322BOX). Resolved proteins were then transferred onto a nitrocellulose membrane (Product # IB23001) by iBlot® 2 Dry Blotting System (Product # IB21001). The blot was probed with Anti-Caspase 1 Polyclonal Antibody (Product # PA5-17570, 1:1000 dilution) and Goat anti-Rabbit IgG (H+L) Superclonal™ Recombinant Secondary Antibody, HRP (Product # A27036, 1:5000 dilution) using the iBright FL 1000 (Product # A32752). Chemiluminescent detection was performed using SuperSignal™ West Dura Extended Duration Substrate (Product # 34076). Loss of signal upon CRISPR mediated knockout (KO) using the LentiArray™ CRISPR product line confirms that antibody is specific to CASP1. An uncharacterized band was observed in all the samples at ~32 kDa.
- Submitted by
- Invitrogen Antibodies (provider)
- Main image

- Experimental details
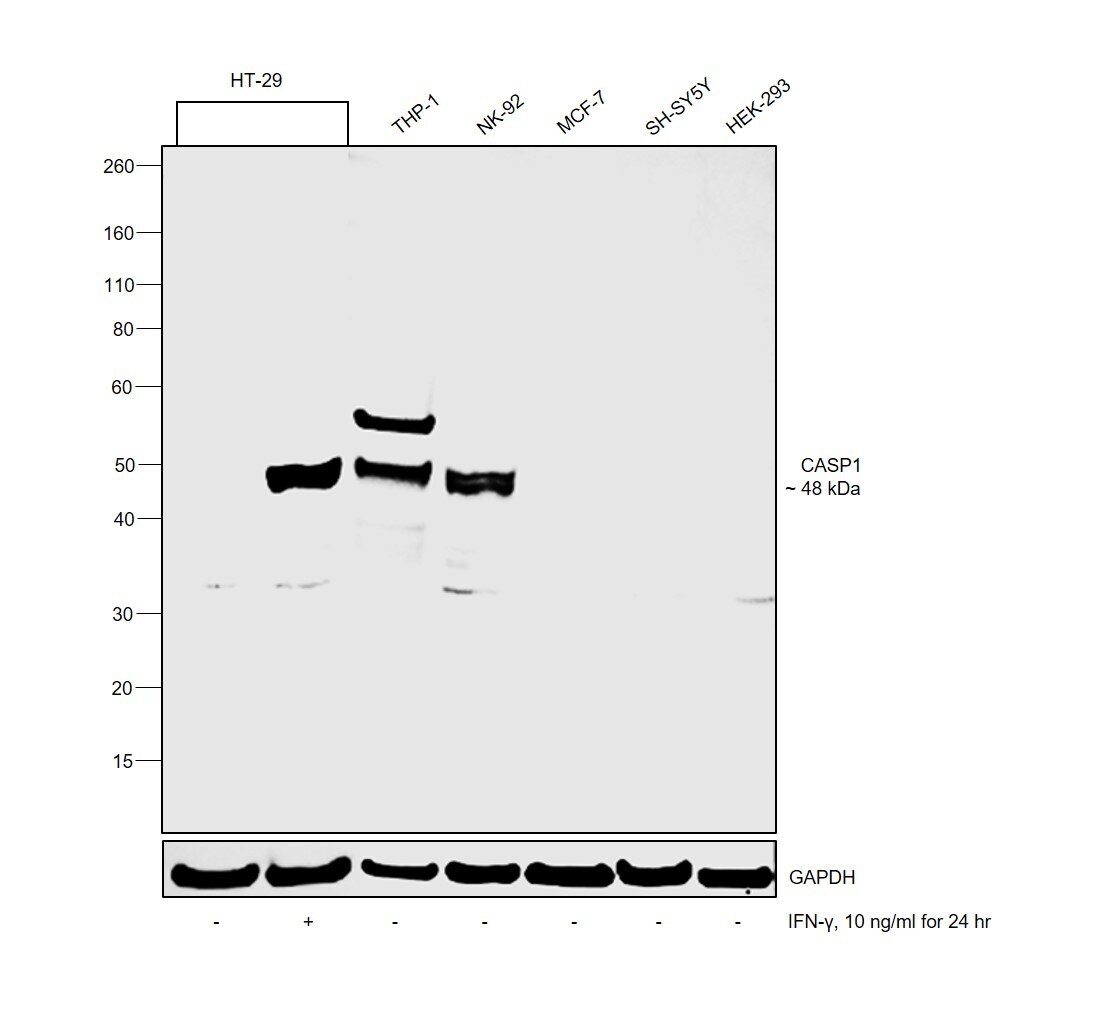
- Western blot was performed using Anti-Caspase 1 Polyclonal Antibody (Product # PA5-17570) and a 48kDa band corresponding to Caspase 1 was observed upon treatment with IFN-gamma in HT-29. Caspase 1 was also observed in THP-1 and NK-92 in comparison to MCF-7, SH-SY5Y and HEK-293 which is reported to be low. Whole Cell Extract-WCL (30 µg lysate) of HT-29 (Lane 1), HT-29 treated with IFN-gamma (10ng/ml for 24hr) (Lane 2), THP-1 (Lane 3), NK-92 (Lane 4), MCF7 (Lane 5), SH-SY5Y (Lane 6) and HEK-293 (Lane 7) were electrophoresed using NuPAGE™ 4-12% Bis-Tris Protein Gel (Product # NP0322BOX). Resolved proteins were then transferred onto a Nitrocellulose membrane (Product # IB23001) by iBlot® 2 Dry Blotting System (Product # IB21001). The blot was probed with the primary antibody (1:1000 dilution) and detected by chemiluminescence with Goat anti-Rabbit IgG (H+L) Superclonal™ Recombinant Secondary Antibody, HRP (Product # A27036,1:4000 dilution) using the iBright FL 1000 (Product # A32752). Chemiluminescent detection was performed using Novex® ECL Chemiluminescent Substrate Reagent Kit (Product # WP20005).
Supportive validation
- Submitted by
- Invitrogen Antibodies (provider)
- Main image

- Experimental details
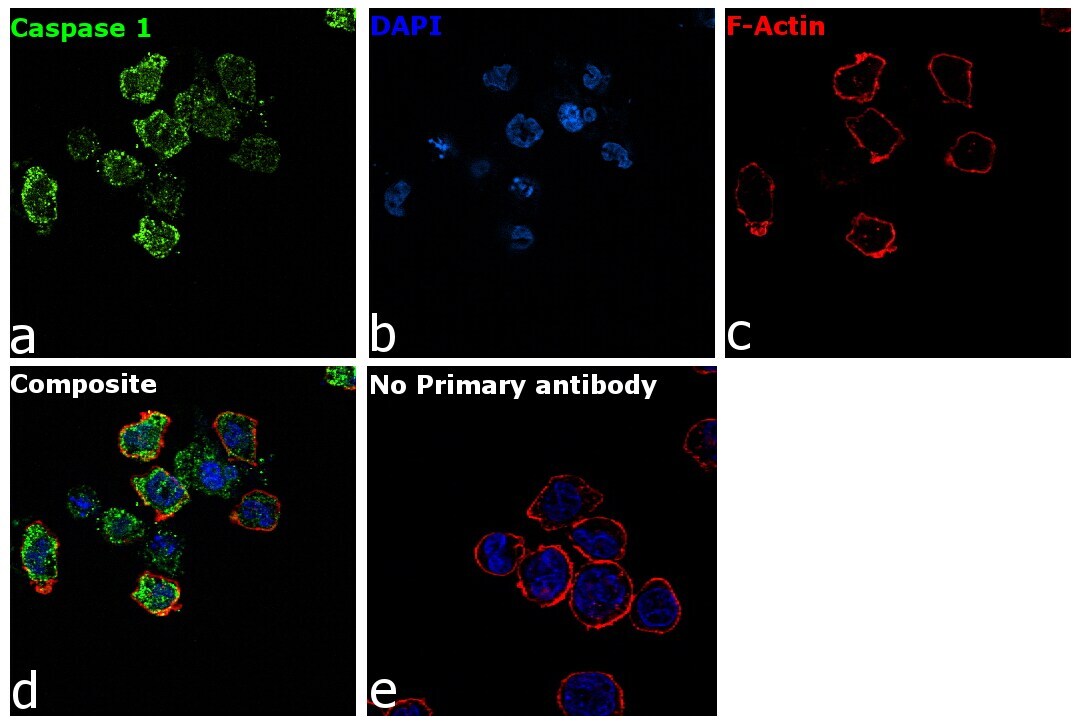
- Immunofluorescence analysis of Caspase 1 was performed using 70% confluent log phase THP-1 cells. The cells were fixed with 4% paraformaldehyde for 10 minutes, permeabilized with 0.1% Triton™ X-100 for 15 minutes, and blocked with 2% BSA for 45 minutes at room temperature. The cells were labeled with Caspase 1 Polyclonal Antibody (Product # PA5-17570) at 1:100 dilution in 0.1% BSA, incubated at 4 degree celsius overnight and then labeled with Goat anti-Rabbit IgG (H+L) Highly Cross-Adsorbed Secondary Antibody, Alexa Fluor Plus 488 (Product # A32731), (1:2000), for 45 minutes at room temperature (Panel a: Green). Nuclei (Panel b:Blue) were stained with ProLong™ Diamond Antifade Mountant with DAPI (Product # P36962). F-actin (Panel c: Red) was stained with Rhodamine Phalloidin (Product # R415, 1:300). Panel d represents the merged image showing cytoplasmic localization. Panel e represents control cells with no primary antibody to assess background. The images were captured at 60X magnification.
Supportive validation
- Submitted by
- Invitrogen Antibodies (provider)
- Main image
- Experimental details
- NULL

- Submitted by
- Invitrogen Antibodies (provider)
- Main image
- Experimental details
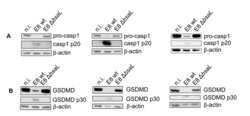
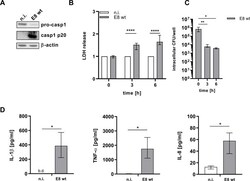
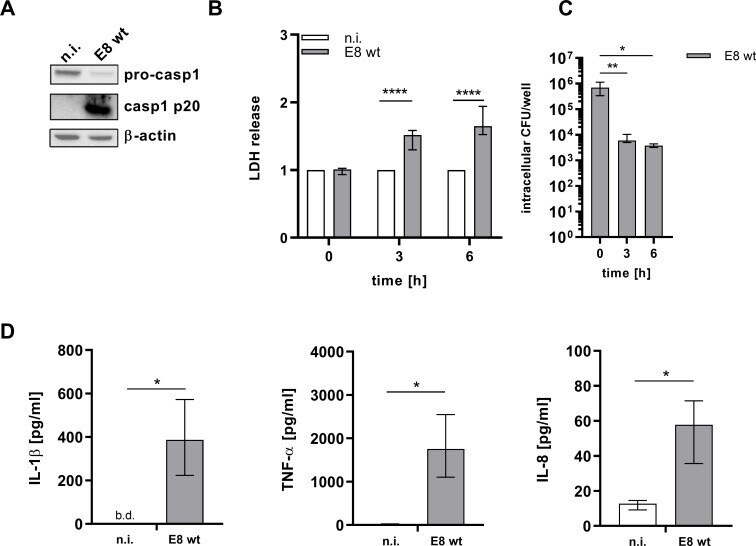
- Fig 2 B . pseudomallei leads to inflammasome activation in hMDMs. hMDMs were infected with B . pseudomallei E8 (MOI 300) for 3 or 6h. (A) Immunoblot analysis was performed on lysates (3h p.i.) for full-length caspase-1 (pro-casp1) and cleaved caspase-1 (casp1 p20). Lysates were re-probed for beta-actin. One representative experiment of three with different donors is shown. (B and C) Cell death and intracellular bacterial burden (in CFU/well) were determined at 0, 3 and 6h p.i. Shown are the results of at least 5 independent experiments with different donors performed in technical duplicates (median with interquartile range). (D) Cytokine release in supernatants was measured 3h p.i. Shown are the results of 4 independent experiments with different donors performed in technical duplicates. Data are represented as median with interquartile range. (*p < 0.05, **p < 0.01, ****p < 0.0001). caspase-1 (pro-casp1), cleaved caspase-1 (casp1 p20), n.i. (not infected), wt (wild type), b.d. (below detection), hours (h), p.i. (post infection).
- Submitted by
- Invitrogen Antibodies (provider)
- Main image
- Experimental details
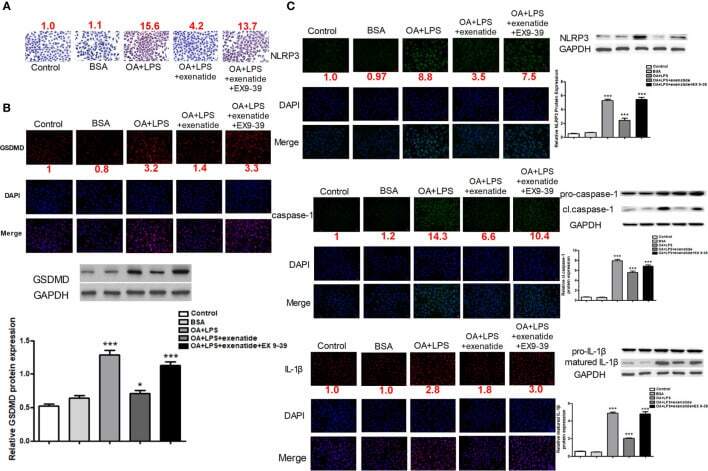
- Figure 1 Exenatide attenuated NASH by inhibiting the pyroptosis signaling pathway in vitro . (A) A representative Oil Red O staining image showed that exenatide attenuated NASH. The numbers above each picture (shown in red) indicated the relative staining intensity as quantified by ImageJ. (B) Representative immunofluorescence images of GSDMD and GSDMD protein expression levels measured by western blotting. (C) Representative immunofluorescence images of NLRP3, caspase-1, and IL-1beta. NLRP3, caspase-1, and IL-1beta. Protein expression levels were measured by western blotting. For panel (B, C) , the numbers below the images (shown in red) indicated the relative fluorescence intensity as quantified by ImageJ. Two subcultures were used for each western blot markers and the experiment was repeated 2-3 times. *p < 0.1; ***p < 0.001. Data are expressed as the mean +- SEM.
- Submitted by
- Invitrogen Antibodies (provider)
- Main image
- Experimental details
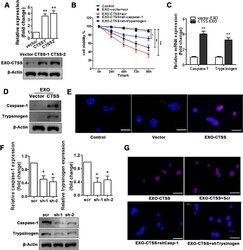
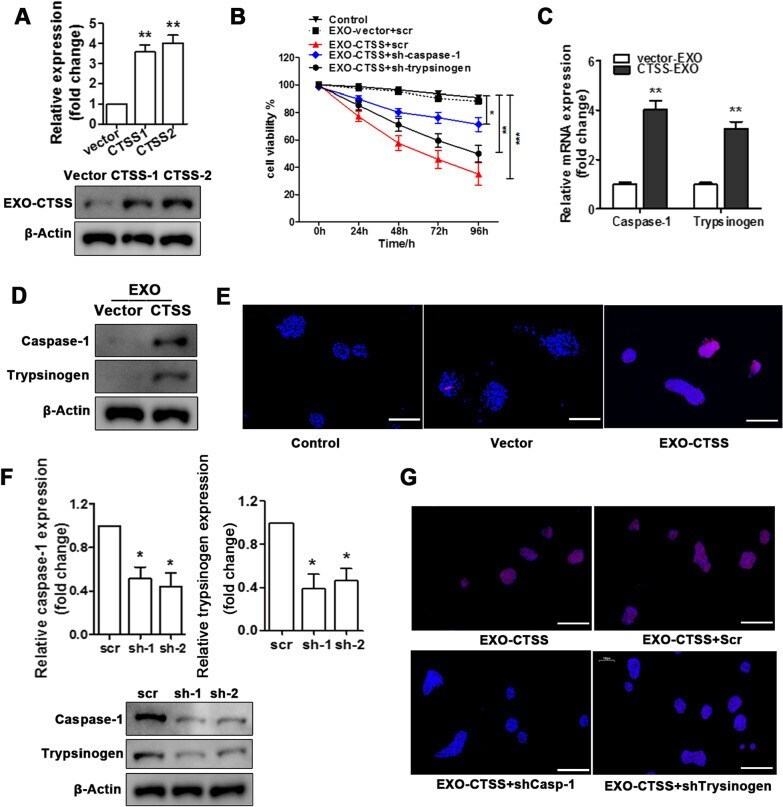
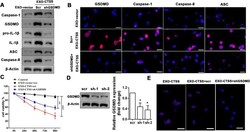
- Fig. 4 Macrophage exosome-derived CTSS induced acinar cell injury via trypsinogen and caspase-1. QRT-PCR and western blot analysis ( A ) of CTSS overexpression in macrophage, empty vector are used as the control. Pancreatic acinar cell viability over time in control, EXO-vector + scr, EXO-CTSS + scr, EXO-CTSS + shCaspase1, and EXO-CTSS + shtrypsinogen ( B ). QRT-PCR ( C ) and western blot analysis ( D ) for caspase-1 and trypsinogen expression of acinar cells after EXO-CTSS stimulation. TUNEL assay for acinar cells apoptotic after EXO-CTSS treatment, with empty vector control, and normal blank control. (Scale bars = 100 mum) ( E ). QRT-PCR and western blot analysis ( F ) of the efficiency of caspase-1 and trypsinogen gene knockdown in acinar cells, with scr control. TUNEL assay to assess apoptosis after EXO-CTSS treatment in acinar cells, which are transfected with scr, shCaspase1, or shTrypsinogen, no transfection is the blank control. (Scale bars = 100 mum) ( G ). Data are shown as the mean +- SEM, n = 3, ANOVA. * P < 0.05, ** P < 0.01, *** P < 0.001
- Submitted by
- Invitrogen Antibodies (provider)
- Main image
- Experimental details
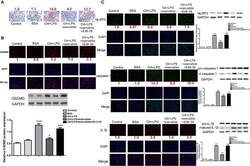
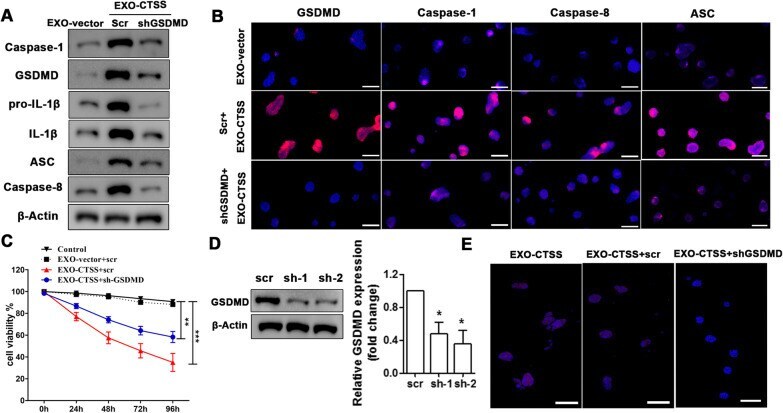
- Fig. 5 Macrophage exosome-derived CTSS induced pyroptosis in vitro. Western blot analysis of caspase-1, GSDMD, pro-IL-1beta, IL-1beta, ASC, and caspase-8 in acinar cells, which are treated with EXO-CTSS or EXO-vector and transfected with scr or shGSDMD ( A ). Immunofluorescence staining for GSDMD, caspase-1, caspase-8, and ASC in acinar cells are treated with EXO-CTSS or EXO-vector, and transfected with scr or shGSDMD ( B ). The location and level of GSDMD, caspase-1, caspase-8, and ASC are shown by red fluorescence, and nucleiare stained with DAPI. QRT-PCR and western blot analysis ( C ) for the efficiency of GSDMD gene knockdown in acinar cells, scr as the control. Acinar cells viability over time in control, EXO-vector + scr, EXO-CTSS + scr, and EXO-CTSS + shGSDMD ( D ). TUNEL assay for apoptosis was performed in acinar cells after EXO-CTSS treatment; cells were transfected with scr or shGSDMD. (Scale bars = 100 mum). ( E ). Data are shown as the mean +- SEM, n = 3, ANOVA. * P < 0.05, ** P < 0.01, *** P < 0.001
- Submitted by
- Invitrogen Antibodies (provider)
- Main image

- Experimental details
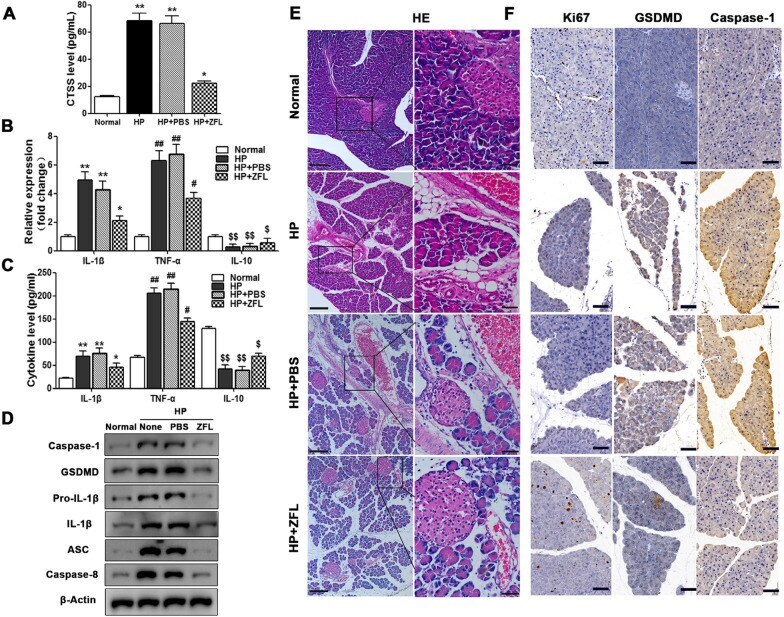
- Fig. 7 Macrophage exosome-derived CTSS induced pyroptosis in vivo. HP mice were divided into different groups, normal, HP, HP + PBS, and HP + Z-FL-COCHO. ELISA ( A , B ) QRT-PCR detection ( C ) for CTSS and inflammation factor levels in the peripheral blood of the HP mouse model. Proteins level of caspase-1, GSDMD, pro-IL-1beta, IL-1beta, ASC, and caspase-8 were assessed by western blotting, in HP mice with different treatments ( D ). Pathologic analysis for HP mice with different treatments, including HE ( E ) shows the pathology (Scale bars = 200 mum (left); Scale bar = 50 mum (right), and Ki67, immunohistochemistry of GSDMD and caspase-1. Scale bar = 50 mum ( F ). Data are shown as the mean +- SEM, n = 6, ANOVA. * P < 0.05, ** P < 0.01, *** P < 0.001