Explore
 Validate
 Learn
Learn Flow cytometry
Antibody data
- Antibody Data
- Antigen structure
- References [27]
- Comments [0]
- Validations
- Flow cytometry [1]
- Other assay [16]
Submit
Validation data
Reference
Comment
Report error
- Product number
- 46-9966-42 - Provider product page

- Provider
- Invitrogen Antibodies
- Product name
- Gata-3 Monoclonal Antibody (TWAJ), PerCP-eFluor™ 710, eBioscience™
- Antibody type
- Monoclonal
- Antigen
- Other
- Description
- Description: The monoclonal antibody TWAJ recognizes mouse and human Gata-3, a member of the Gata family of transcription factors. Gata-3 is a T cell-specific transcription factor important for thymic development and Th2 differentiation. Expression during embryonic development is found in the central nervous system, skin, mammary glands and kidney. During development, the expression of Gata-3 is essential as homozygous knock-out of Gata-3 is embryonic lethal. The Gata-3 is also essential for T cell commitment and survival. In the thymus, expression is found mainly on the CD4 single positive cells. During Th2 differentiation, Gata-3 binds to the IL-4 promoter as well as represses the expression of T-bet, thus inhibiting Th1 differentiation. Alternative splice variants have been reported especially in the MCF7 cell line. The TWAJ Human/Mouse Gata-3 antibody will recognize both forms (50 and 45 kDa) of the protein. Staining with the TWAJ Human/Mouse Gata-3 antibody requires the use of the Foxp3/Transcription Factor Staining Buffer Set.(Product # 00-5523-00) Crossreactivity in rhesus monkeys has been published. Applications Reported: This TWAJ antibody has been reported for use in intracellular staining followed by flow cytometric analysis. Applications Tested: This TWAJ antibody has been pre-titrated and tested by intracellular staining and flow cytometric analysis of mouse thymocytes using the Foxp3/Transcription Factor Staining Buffer Set (Product # 00-5523) and protocol. Please refer to Best Protocols: Protocol B: One step protocol for (nuclear) intracellular proteins located under the Resources Tab online. This can be used at 5 µL (0.06 µg) per test. A test is defined as the amount (µg) of antibody that will stain a cell sample in a final volume of 100 µL. Cell number should be determined empirically but can range from 10^5 to 10^8 cells/test. PerCP-eFluor® 710 emits at 710 nm and is excited with the blue laser (488 nm); it can be used in place of PerCP-Cyanine5.5. We recommend using a 710/50 bandpass filter, however, the 695/40 bandpass filter is an acceptable alternative. Please make sure that your instrument is capable of detecting this fluorochrome. Light sensitivity: This tandem dye is sensitive to photo-induced oxidation. Please protect this vial and stained samples from light. Fixation: Samples can be stored in IC Fixation Buffer (Product # 00-8222) (100 µL of cell sample + 100 µL of IC Fixation Buffer) or 1-step Fix/Lyse Solution (Product # 00-5333) for up to 3 days in the dark at 4°C with minimal impact on brightness and FRET efficiency/compensation. Some generalizations regarding fluorophore performance after fixation can be made, but clone specific performance should be determined empirically. Excitation: 488 nm; Emission: 710 nm; Laser: Blue Laser. Filtration: 0.2 µm post-manufacturing filtered.
- Reactivity
- Human, Mouse, Porcine
- Host
- Rat
- Isotype
- IgG
- Antibody clone number
- TWAJ
- Vial size
- 100 Tests
- Concentration
- 5 µL/Test
- Storage
- 4° C, store in dark, DO NOT FREEZE!
Submitted references Graded RhoA GTPase Expression in Treg Cells Distinguishes Tumor Immunity From Autoimmunity.
Effector T cell responses unleashed by regulatory T cell ablation exacerbate oral squamous cell carcinoma.
The molecular and epigenetic mechanisms of innate lymphoid cell (ILC) memory and its relevance for asthma.
Histone deacetylase 3 represses cholesterol efflux during CD4(+) T-cell activation.
NK and T Cell Differentiation at the Maternal-Fetal Interface in Sows During Late Gestation.
Expansion of Group 2 Innate Lymphoid Cells in Patients with End-Stage Renal Disease and Their Clinical Significance.
Attenuation of TCR-induced transcription by Bach2 controls regulatory T cell differentiation and homeostasis.
Regulatory T Cell-Derived TGF-β1 Controls Multiple Checkpoints Governing Allergy and Autoimmunity.
Compartmentalized gut lymph node drainage dictates adaptive immune responses.
IL-33-mediated mast cell activation promotes gastric cancer through macrophage mobilization.
An Id2(RFP)-Reporter Mouse Redefines Innate Lymphoid Cell Precursor Potentials.
Commensals Suppress Intestinal Epithelial Cell Retinoic Acid Synthesis to Regulate Interleukin-22 Activity and Prevent Microbial Dysbiosis.
Characterisation of innate lymphoid cell populations at different sites in mice with defective T cell immunity.
Systemic Human ILC Precursors Provide a Substrate for Tissue ILC Differentiation.
Stability and function of regulatory T cells expressing the transcription factor T-bet.
Huai Qi Huang corrects the balance of Th1/Th2 and Treg/Th17 in an ovalbumin-induced asthma mouse model.
Sex impacts Th1 cells, Tregs, and DCs in both intestinal and systemic immunity in a mouse strain and location-dependent manner.
CD4(+) T-cell survival in the GI tract requires dectin-1 during fungal infection.
Arginase 1 is an innate lymphoid-cell-intrinsic metabolic checkpoint controlling type 2 inflammation.
Intranasal Administration of Lentiviral miR-135a Regulates Mast Cell and Allergen-Induced Inflammation by Targeting GATA-3.
Skewed T-helper (Th)1/2- and Th17/T regulatory‑cell balances in patients with renal cell carcinoma.
Clonal analysis of the T-cell response to in vivo expressed Mycobacterium tuberculosis protein Rv2034, using a CD154 expression based T-cell cloning method.
IL-22 fate reporter reveals origin and control of IL-22 production in homeostasis and infection.
Bhlhe40 controls cytokine production by T cells and is essential for pathogenicity in autoimmune neuroinflammation.
Impaired proteasome function activates GATA3 in T cells and upregulates CTLA-4: relevance for Sézary syndrome.
Role of CD44 in the differentiation of Th1 and Th2 cells: CD44-deficiency enhances the development of Th2 effectors in response to sheep RBC and chicken ovalbumin.
Normalization of obesity-associated insulin resistance through immunotherapy.
Kalim KW, Yang JQ, Modur V, Nguyen P, Li Y, Zheng Y, Guo F
Frontiers in immunology 2021;12:726393
Frontiers in immunology 2021;12:726393
Effector T cell responses unleashed by regulatory T cell ablation exacerbate oral squamous cell carcinoma.
Chao JL, Korzinkin M, Zhavoronkov A, Ozerov IV, Walker MT, Higgins K, Lingen MW, Izumchenko E, Savage PA
Cell reports. Medicine 2021 Sep 21;2(9):100399
Cell reports. Medicine 2021 Sep 21;2(9):100399
The molecular and epigenetic mechanisms of innate lymphoid cell (ILC) memory and its relevance for asthma.
Verma M, Michalec L, Sripada A, McKay J, Sirohi K, Verma D, Sheth D, Martin R, Dyjack N, Seibold MA, Knapp JR, Tu TH, O'Connor BP, Gorska MM, Alam R
The Journal of experimental medicine 2021 Jul 5;218(7)
The Journal of experimental medicine 2021 Jul 5;218(7)
Histone deacetylase 3 represses cholesterol efflux during CD4(+) T-cell activation.
Wilfahrt D, Philips RL, Lama J, Kizerwetter M, Shapiro MJ, McCue SA, Kennedy MM, Rajcula MJ, Zeng H, Shapiro VS
eLife 2021 Dec 2;10
eLife 2021 Dec 2;10
NK and T Cell Differentiation at the Maternal-Fetal Interface in Sows During Late Gestation.
Stas MR, Koch M, Stadler M, Sawyer S, Sassu EL, Mair KH, Saalmüller A, Gerner W, Ladinig A
Frontiers in immunology 2020;11:582065
Frontiers in immunology 2020;11:582065
Expansion of Group 2 Innate Lymphoid Cells in Patients with End-Stage Renal Disease and Their Clinical Significance.
Liu GY, Deng XH, Li X, Cao YJ, Xing YF, Zhou P, Lei AH, Yang Q, Deng K, Zhang H, Zhou J
Journal of immunology (Baltimore, Md. : 1950) 2020 Jul 1;205(1):36-44
Journal of immunology (Baltimore, Md. : 1950) 2020 Jul 1;205(1):36-44
Attenuation of TCR-induced transcription by Bach2 controls regulatory T cell differentiation and homeostasis.
Sidwell T, Liao Y, Garnham AL, Vasanthakumar A, Gloury R, Blume J, Teh PP, Chisanga D, Thelemann C, de Labastida Rivera F, Engwerda CR, Corcoran L, Kometani K, Kurosaki T, Smyth GK, Shi W, Kallies A
Nature communications 2020 Jan 14;11(1):252
Nature communications 2020 Jan 14;11(1):252
Regulatory T Cell-Derived TGF-β1 Controls Multiple Checkpoints Governing Allergy and Autoimmunity.
Turner JA, Stephen-Victor E, Wang S, Rivas MN, Abdel-Gadir A, Harb H, Cui Y, Fanny M, Charbonnier LM, Fong JJH, Benamar M, Wang L, Burton OT, Bansal K, Bry L, Zhu C, Li QZ, Clement RL, Oettgen HC, Crestani E, Rachid R, Sage PT, Chatila TA
Immunity 2020 Dec 15;53(6):1202-1214.e6
Immunity 2020 Dec 15;53(6):1202-1214.e6
Compartmentalized gut lymph node drainage dictates adaptive immune responses.
Esterházy D, Canesso MCC, Mesin L, Muller PA, de Castro TBR, Lockhart A, ElJalby M, Faria AMC, Mucida D
Nature 2019 May;569(7754):126-130
Nature 2019 May;569(7754):126-130
IL-33-mediated mast cell activation promotes gastric cancer through macrophage mobilization.
Eissmann MF, Dijkstra C, Jarnicki A, Phesse T, Brunnberg J, Poh AR, Etemadi N, Tsantikos E, Thiem S, Huntington ND, Hibbs ML, Boussioutas A, Grimbaldeston MA, Buchert M, O'Donoghue RJJ, Masson F, Ernst M
Nature communications 2019 Jun 21;10(1):2735
Nature communications 2019 Jun 21;10(1):2735
An Id2(RFP)-Reporter Mouse Redefines Innate Lymphoid Cell Precursor Potentials.
Xu W, Cherrier DE, Chea S, Vosshenrich C, Serafini N, Petit M, Liu P, Golub R, Di Santo JP
Immunity 2019 Apr 16;50(4):1054-1068.e3
Immunity 2019 Apr 16;50(4):1054-1068.e3
Commensals Suppress Intestinal Epithelial Cell Retinoic Acid Synthesis to Regulate Interleukin-22 Activity and Prevent Microbial Dysbiosis.
Grizotte-Lake M, Zhong G, Duncan K, Kirkwood J, Iyer N, Smolenski I, Isoherranen N, Vaishnava S
Immunity 2018 Dec 18;49(6):1103-1115.e6
Immunity 2018 Dec 18;49(6):1103-1115.e6
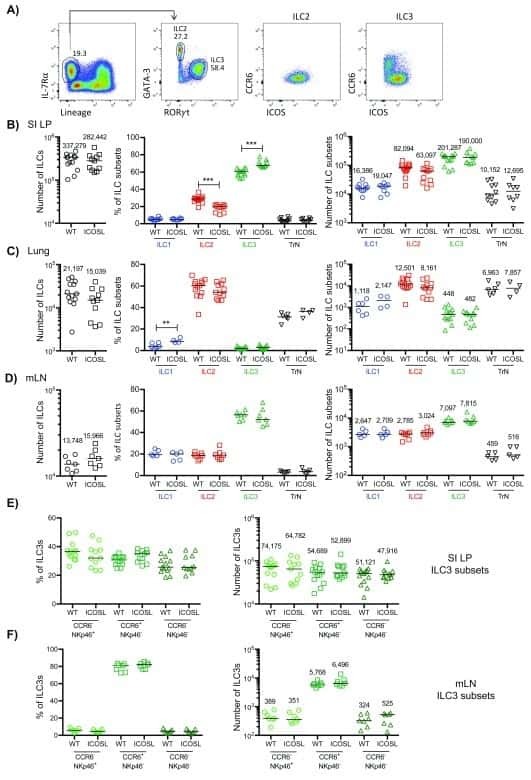
Characterisation of innate lymphoid cell populations at different sites in mice with defective T cell immunity.
Dutton EE, Camelo A, Sleeman M, Herbst R, Carlesso G, Belz GT, Withers DR
Wellcome open research 2017;2:117
Wellcome open research 2017;2:117
Systemic Human ILC Precursors Provide a Substrate for Tissue ILC Differentiation.
Lim AI, Li Y, Lopez-Lastra S, Stadhouders R, Paul F, Casrouge A, Serafini N, Puel A, Bustamante J, Surace L, Masse-Ranson G, David E, Strick-Marchand H, Le Bourhis L, Cocchi R, Topazio D, Graziano P, Muscarella LA, Rogge L, Norel X, Sallenave JM, Allez M, Graf T, Hendriks RW, Casanova JL, Amit I, Yssel H, Di Santo JP
Cell 2017 Mar 9;168(6):1086-1100.e10
Cell 2017 Mar 9;168(6):1086-1100.e10
Stability and function of regulatory T cells expressing the transcription factor T-bet.
Levine AG, Mendoza A, Hemmers S, Moltedo B, Niec RE, Schizas M, Hoyos BE, Putintseva EV, Chaudhry A, Dikiy S, Fujisawa S, Chudakov DM, Treuting PM, Rudensky AY
Nature 2017 Jun 15;546(7658):421-425
Nature 2017 Jun 15;546(7658):421-425
Huai Qi Huang corrects the balance of Th1/Th2 and Treg/Th17 in an ovalbumin-induced asthma mouse model.
Liang P, Peng S, Zhang M, Ma Y, Zhen X, Li H
Bioscience reports 2017 Dec 22;37(6)
Bioscience reports 2017 Dec 22;37(6)
Sex impacts Th1 cells, Tregs, and DCs in both intestinal and systemic immunity in a mouse strain and location-dependent manner.
Elderman M, van Beek A, Brandsma E, de Haan B, Savelkoul H, de Vos P, Faas M
Biology of sex differences 2016;7:21
Biology of sex differences 2016;7:21
CD4(+) T-cell survival in the GI tract requires dectin-1 during fungal infection.
Drummond RA, Dambuza IM, Vautier S, Taylor JA, Reid DM, Bain CC, Underhill DM, Masopust D, Kaplan DH, Brown GD
Mucosal immunology 2016 Mar;9(2):492-502
Mucosal immunology 2016 Mar;9(2):492-502
Arginase 1 is an innate lymphoid-cell-intrinsic metabolic checkpoint controlling type 2 inflammation.
Monticelli LA, Buck MD, Flamar AL, Saenz SA, Tait Wojno ED, Yudanin NA, Osborne LC, Hepworth MR, Tran SV, Rodewald HR, Shah H, Cross JR, Diamond JM, Cantu E, Christie JD, Pearce EL, Artis D
Nature immunology 2016 Jun;17(6):656-65
Nature immunology 2016 Jun;17(6):656-65
Intranasal Administration of Lentiviral miR-135a Regulates Mast Cell and Allergen-Induced Inflammation by Targeting GATA-3.
Deng YQ, Yang YQ, Wang SB, Li F, Liu MZ, Hua QQ, Tao ZZ
PloS one 2015;10(9):e0139322
PloS one 2015;10(9):e0139322
Skewed T-helper (Th)1/2- and Th17/T regulatory‑cell balances in patients with renal cell carcinoma.
Li L, Yang C, Zhao Z, Xu B, Zheng M, Zhang C, Min Z, Guo J, Rong R
Molecular medicine reports 2015 Feb;11(2):947-53
Molecular medicine reports 2015 Feb;11(2):947-53
Clonal analysis of the T-cell response to in vivo expressed Mycobacterium tuberculosis protein Rv2034, using a CD154 expression based T-cell cloning method.
Commandeur S, Coppola M, Dijkman K, Friggen AH, van Meijgaarden KE, van den Eeden SJ, Wilson L, van der Ploeg-van Schip JJ, Franken KL, Geluk A, Ottenhoff TH
PloS one 2014;9(6):e99203
PloS one 2014;9(6):e99203
IL-22 fate reporter reveals origin and control of IL-22 production in homeostasis and infection.
Ahlfors H, Morrison PJ, Duarte JH, Li Y, Biro J, Tolaini M, Di Meglio P, Potocnik AJ, Stockinger B
Journal of immunology (Baltimore, Md. : 1950) 2014 Nov 1;193(9):4602-13
Journal of immunology (Baltimore, Md. : 1950) 2014 Nov 1;193(9):4602-13
Bhlhe40 controls cytokine production by T cells and is essential for pathogenicity in autoimmune neuroinflammation.
Lin CC, Bradstreet TR, Schwarzkopf EA, Sim J, Carrero JA, Chou C, Cook LE, Egawa T, Taneja R, Murphy TL, Russell JH, Edelson BT
Nature communications 2014 Apr 3;5:3551
Nature communications 2014 Apr 3;5:3551
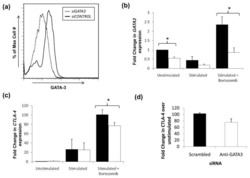
Impaired proteasome function activates GATA3 in T cells and upregulates CTLA-4: relevance for Sézary syndrome.
Gibson HM, Mishra A, Chan DV, Hake TS, Porcu P, Wong HK
The Journal of investigative dermatology 2013 Jan;133(1):249-57
The Journal of investigative dermatology 2013 Jan;133(1):249-57
Role of CD44 in the differentiation of Th1 and Th2 cells: CD44-deficiency enhances the development of Th2 effectors in response to sheep RBC and chicken ovalbumin.
Guan H, Nagarkatti PS, Nagarkatti M
Journal of immunology (Baltimore, Md. : 1950) 2009 Jul 1;183(1):172-80
Journal of immunology (Baltimore, Md. : 1950) 2009 Jul 1;183(1):172-80
Normalization of obesity-associated insulin resistance through immunotherapy.
Winer S, Chan Y, Paltser G, Truong D, Tsui H, Bahrami J, Dorfman R, Wang Y, Zielenski J, Mastronardi F, Maezawa Y, Drucker DJ, Engleman E, Winer D, Dosch HM
Nature medicine 2009 Aug;15(8):921-9
Nature medicine 2009 Aug;15(8):921-9
No comments: Submit comment
Supportive validation
- Submitted by
- Invitrogen Antibodies (provider)
- Main image
- Experimental details
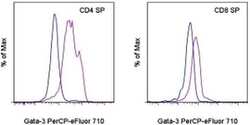
- BALB/c thymocytes were surface stained with Anti-Mouse CD4 APC (Product # 17-0041-82) and Anti-Mouse CD8a PE (Product # 12-0081-82) followed by intracellular staining with Rat IgG2b K Isotype Control PerCP-eFluor® 710 (Product # 46-4031-82) (blue histogram) or Anti-Human/Mouse Gata-3 PerCP-eFluor® 710 (purple histogram) using the Foxp3/Transcription Factor Staining Buffer Set (Product # 00-5523-00) and protocol. Cells in the CD4 single positive (left) or CD8 single positive (right) gates were used for analysis.

Supportive validation
- Submitted by
- Invitrogen Antibodies (provider)
- Main image
- Experimental details
- NULL

- Submitted by
- Invitrogen Antibodies (provider)
- Main image

- Experimental details
- NULL
- Submitted by
- Invitrogen Antibodies (provider)
- Main image
- Experimental details
- NULL

- Submitted by
- Invitrogen Antibodies (provider)
- Main image
- Experimental details
- NULL
- Submitted by
- Invitrogen Antibodies (provider)
- Main image
- Experimental details
- NULL
- Submitted by
- Invitrogen Antibodies (provider)
- Main image
- Experimental details
- NULL
- Submitted by
- Invitrogen Antibodies (provider)
- Main image
- Experimental details
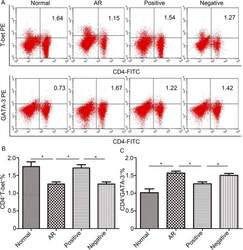
- Fig 5 Lentiviral-mmu-miR-135a treatment influences Th cell polarization. The expression of T-bet and GATA-3 protein in CD4 + T cells was measured in the spleens of normal (control), AR (AR-induced), positive (AR-induced, treated with lentiviral-mmu-miR-135a), and negative (AR-induced, treated with empty lentivirus) mice using flow cytometry. (A) Representative dot plots from each experimental group. The percentages of CD4 + T-bet + T cells (B) and CD4 + GATA-3 + T cells (C) were also calculated. Data are presented as the mean +- SEM. *P

- Submitted by
- Invitrogen Antibodies (provider)
- Main image
- Experimental details
- Fig. 7 Tumor burden is reduced in St2 receptor-deficient gp130 FF mice. a Quantification of total tumor burden in 100-day-old mice of the indicated genotype. Each symbol represents an individual mouse. One-way ANOVA was performed with F (DFn, Dfd) = 11.83 (2, 48). b Enumeration of total tumor number from mice in a , and of tumors following classification according to their size. n = 12 ( FF, St2 +/+ ), n = 20 ( FF, St2 +/ - ), and n = 19 ( FF, St2 -/- ) mice. One-way ANOVA was performed with F (DFn, Dfd) = 22.79 (11, 192). c Quantification of toluidine blue (for detection of mast cells; submucosal tissue), F4/80 and CD31 stained sections of gastric tumors of mice of the indicated genotype. Mast cells: n = 10 mice, t -test t (df) = 4.25 (18); F4/80: n = 8 (FF; St2 +/+ ), n = 9 (FF; St2 - /- ), one-way ANOVA F (DFn, Dfd) = 27.52 (3,29); CD31: n = 6 (Submucosa) n = 5 (Tumor), and one-way ANOVA F (DFn, Dfd) = 13.6 (3,19). d qPCR expression analysis of chemokines expressed by FACS-purified tumor-associated mast cells from stomachs of either FF; St2 +/+ or FF; St2 -/- mice. All n = 4 from two independent experiments. Csf2 : t -test t (df) = 3.81 (6); Ccl3 : t -test t (df) = 3.97 (6); Ccl7 : t -test t (df) = 0.88(6); Il6 :: t -test t (df) = 4.02 (6); e , f Flow cytometric analysis of unaffected antrum (AN) and antrum tumors (AT) of indicated genotype for the frequency of ILC2 cells (lineage - , Cd11b - , Gata3 + ), Tregs (Foxp3 + , CD4 + ), and proportion of St2 + cells within these

- Submitted by
- Invitrogen Antibodies (provider)
- Main image

- Experimental details
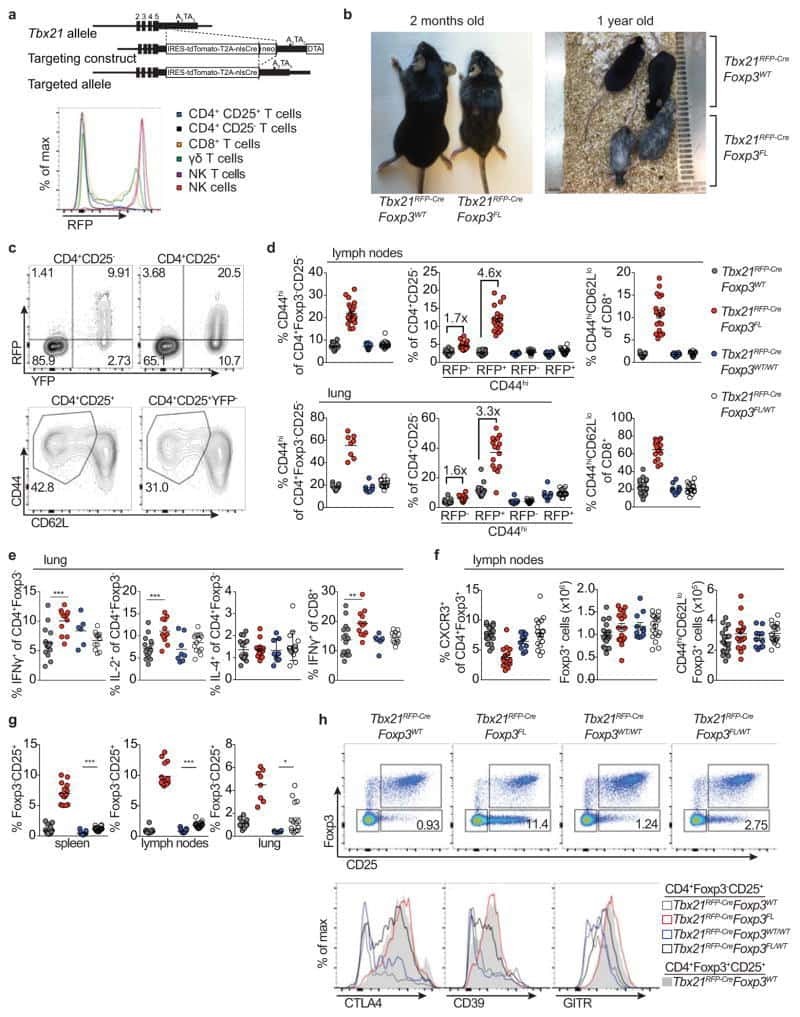
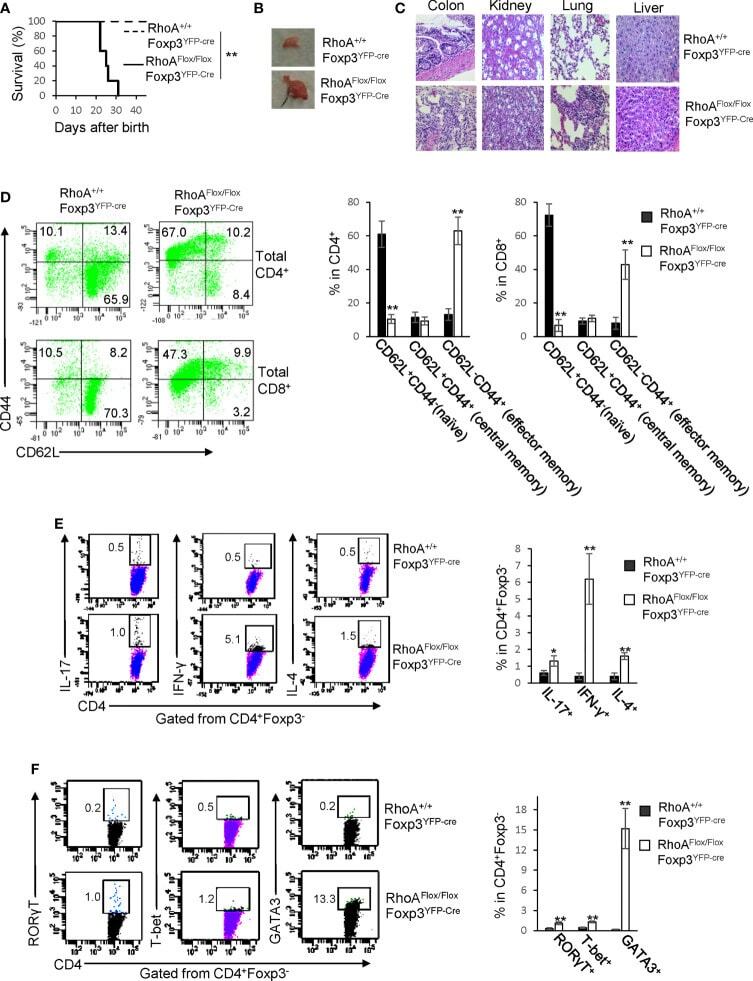
- Figure 1 Homozygous RhoA deletion in Treg cells leads to early, fatal spontaneous inflammatory disorders. (A) Survival outcome of RhoA +/+ Foxp3 YFP-Cre and RhoA Flox/Flox Foxp3 YFP-Cre mice. Results were analyzed with a log-rank (Mantel-Cox) test and expressed as Kaplan-Meier survival curves. (B) Image of lymphadenopathy in RhoA Flox/Flox Foxp3 YFP-Cre mice. Inguinal lymph nodes are shown. (C) Images of H&E staining of the indicated organs from RhoA +/+ Foxp3 YFP-Cre and RhoA Flox/Flox Foxp3 YFP-Cre mice (original magnification X 400). (D) Left, representative flow cytogram of CD44 and CD62L staining in CD4 + and CD8 + cells from the spleen of RhoA +/+ Foxp3 YFP-Cre and RhoA Flox/Flox Foxp3 YFP-Cre mice. The numbers indicate percentages of CD44 + , CD44 + CD62L + , and CD62L + cells. Right, average percentages of CD44 + , CD44 + CD62L + , and CD62L + cells. (E) Left, representative flow cytogram of IL-17, IFN-gamma, and IL-4 staining in CD4 + Foxp3 - cells from the spleen of RhoA +/+ Foxp3 YFP-Cre and RhoA Flox/Flox Foxp3 YFP-Cre mice. The numbers indicate percentages of IL-17 + , IFN-gamma + , and IL-4 + cells. Right, average percentages of IL-17 + , IFN-gamma + , and IL-4 + cells. (F) Left, representative flow cytogram of RORgammaT, T-bet and GATA3 staining in CD4 + Foxp3 - cells from the spleen of RhoA +/+ Foxp3 YFP-Cre and RhoA Flox/Flox Foxp3 YFP-Cre mice. The numbers indicate percentages of RORgammaT + , T-bet + , and GATA3 + cells. Right, average percentages of RORgam
- Submitted by
- Invitrogen Antibodies (provider)
- Main image
- Experimental details
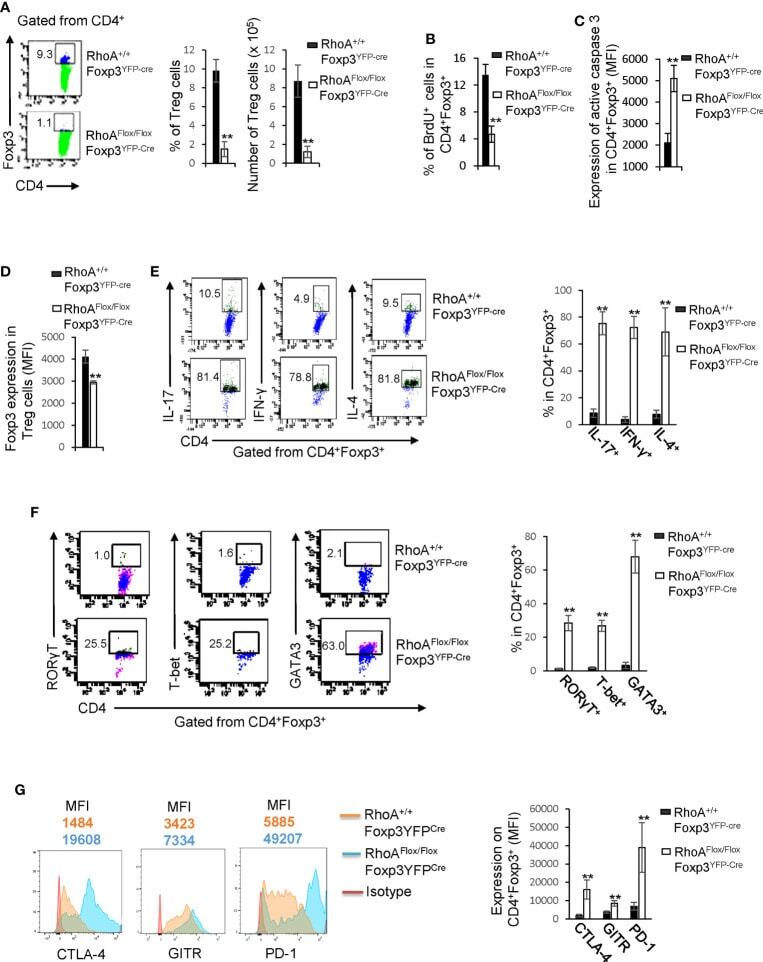
- Figure 2 Homozygous RhoA deletion in Treg cells dampens Treg cell homeostasis and induces Treg cell plasticity. (A) Left, representative flow cytogram of Foxp3 staining in CD4 + cells from the spleen of RhoA +/+ Foxp3 YFP-Cre and RhoA Flox/Flox Foxp3 YFP-Cre mice. The numbers indicate percentages of CD4 + Foxp3 + Treg cells. Middle, average percentages of CD4 + Foxp3 + Treg cells. Right, average numbers of CD4 + Foxp3 + Treg cells. (B) Treg cell proliferation. Percentages of CD4 + Foxp3 + Treg cells incorporated with BrdU are shown. (C) Treg cell apoptosis. The expression levels (MFI: Mean fluorescence intensity) of active caspase 3 in CD4 + Foxp3 + Treg cells are shown. (D) The expression levels of Foxp3 in Treg cells. (E) Left, representative flow cytogram of IL-17, IFN-gamma, and IL-4 staining in CD4 + Foxp3 + Treg cells. The numbers indicate percentages of IL-17 + , IFN-gamma + , and IL-4 + Treg cells. Right, average percentages of IL-17 + , IFN-gamma + , and IL-4 + Treg cells. (F) Left, representative flow cytogram of RORgammaT, T-bet and GATA3 staining in CD4 + Foxp3 + Treg cells. The numbers indicate percentages of RORgammaT + , T-bet + , and GATA3 + Treg cells. Right, average percentages of RORgammaT + , T-bet + , and GATA3 + Treg cells. (G) Left, representative histogram of the expression levels of CTLA-4, GITR and PD-1 in CD4 + Foxp3 + Treg cells. The numbers above the graphs indicate MFI. Right, average MFI of CTLA-4, GITR and PD-1 in CD4 + Foxp3 + Treg cells. n =
- Submitted by
- Invitrogen Antibodies (provider)
- Main image
- Experimental details
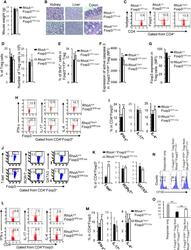
- Figure 5 Heterozygous RhoA deletion in Treg cells induces Treg cell plasticity and increases CD4 + effector T cells but does not result in autoimmunity. (A) Body weight of RhoA +/+ Foxp3 YFP-Cre and RhoA Flox/+ Foxp3 YFP-Cre mice. (B) Images of H&E staining of the indicated organs. (C) Representative flow cytogram of Foxp3 staining in CD4 + cells from the spleen of RhoA +/+ Foxp3 YFP-Cre and RhoA Flox/+ Foxp3 YFP-Cre mice. The numbers indicate percentages of CD4 + Foxp3 + Treg cells. (D) Left, average percentages of CD4 + Foxp3 + Treg cells. Right, cell numbers of CD4 + Foxp3 + Treg cells. (E) Proliferation of Foxp3 + YFP + Treg cells from RhoA +/+ Foxp3 YFP-Cre/+ and RhoA Flox/+ Foxp3 YFP-Cre/+ female mice. Percentages of Foxp3 + YFP + Treg cells incorporated with BrdU are shown. (F) Apoptosis of Foxp3 + YFP + Treg cells from RhoA +/+ Foxp3 YFP-Cre/+ and RhoA Flox/+ Foxp3 YFP-Cre/+ female mice. The expression levels (MFI: mean fluorescence intensity) of active caspase 3 in Foxp3 + YFP + Treg cells are shown. (G) The expression levels of Foxp3 in Treg cells from RhoA +/+ Foxp3 YFP-Cre and RhoA Flox/+ Foxp3 YFP-Cre mice. (H) Representative flow cytogram of IFN-gamma, IL-17 and IL-4 staining in CD4 + Foxp3 + Treg cells. The numbers indicate percentages of IFN-gamma + , IL-17 + and IL-4 + Treg cells. (I) Average percentages of IFN-gamma + , IL-17 + and IL-4 + Treg cells. (J) Representative flow cytogram of RORgammaT, T-bet and GATA3 staining in CD4 + Foxp3 + Treg cells. The numb
- Submitted by
- Invitrogen Antibodies (provider)
- Main image
- Experimental details
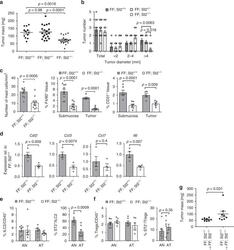
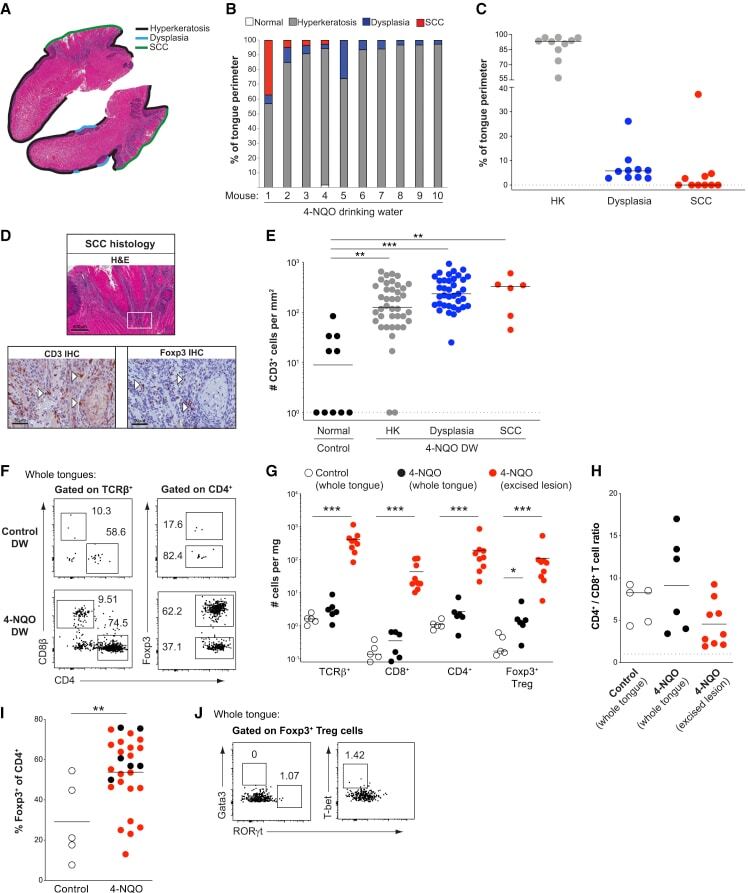
- Figure 2 Murine carcinogen-induced oral lesions are enriched for CD4 + Treg and conventional T cells 6- to 8-week-old C57BL/6 mice were exposed to drinking water containing 100 mug/mL 4-NQO or vehicle control for 20 weeks. (A) Quantification of histopathology. After 20 weeks of treatment with 4-NQO drinking water, tongues were dissected, fixed in 10% formalin, bisected longitudinally, and stained with H&E. The perimeter of each tongue is outlined and categorized base on histology grade: hyperkeratosis (black); dysplasia (blue); or SCC (green). Shown is a representative H&E stain of FFPE tongue after longitudinal bisection of 4-NQO-treated mouse, perimeter traced based on histology grades noted above. (B and C) Summary plots of 4-NQO-induced histopathology, showing the percentage of tongue perimeter defined as indicated histology grade. Each bar (B) or symbol (C) represents an individual tongue from a single mouse. Median is indicated in (C). n = 10 mice. (D) (Top) Representative H&E image of SCC region of tongue epithelium from (A). (Bottom) Representative CD3 (left) and Foxp3 (right) IHC images of adjacent sections of depicted SCC region denoted by white box in H&E image are shown. White arrows denote CD3 + or Foxp3 + cells. Scale bars represent 400 mum (H&E) or 50 mum (IHC). (E) Summary plot of pooled data from CD3 IHC density analysis, showing the number of CD3 + cells per mm 2 for each lesion. Each symbol represents an individual lesion. Median is indicated. n = 10 region
- Submitted by
- Invitrogen Antibodies (provider)
- Main image

- Experimental details
- Figure 2. Histone deacetylase 3 (HDAC3)-deficient CD4 + T cells from dLck-Cre HDAC3 cKO mice have reduced differentiated T h -cell populations. Identification of helper T-cell populations in vivo. Splenocytes were harvested from wild-type (WT) and HDAC3 cKO mice, and labeled for flow cytometry. Cells were first gated on HDAC3 + or HDAC3 - events, then gating for T h 1 (T-bet + ), T h 2 (GATA3 + ), T h 17 (RORgammat + ), T reg (Foxp3 + CD25 + ), and T fh (CXCR5 + PD-1 + Bcl-6 hi ) is shown (left). Bar plots on right represent pooled data for the total cell number +- standard deviation (SD) from three independent experiments ( n = 4-5 mice/group in total). Non-T fh CXCR5 - PD-1 - cells (dark gray histograms) were used as a negative control for Bcl-6 expression to set the gate on the Bcl-6 histograms. Statistical significance was determined for the indicated comparisons using ordinary one-way analysis of variance (ANOVA) with Tukey's multiple comparisons test (*p < 0.05, **p < 0.01, ***p < 0.001, ****p < 0.0001). Figure 2--figure supplement 1. Histone deacetylase 3 (HDAC3)-deficient T cells from dLck-Cre HDAC3 cKO mice have reduced differentiated T h -cell populations. Identification of helper T-cell populations in vivo. Lymphocytes were harvested from mesenteric lymph nodes of wild-type (WT) and dLck-Cre HDAC3 cKO mice, and labeled for flow cytometry. Cells were first gated on HDAC3 + or HDAC3 - events, then gating for T h 1 (T-bet + ), T h 2 (GATA3 + ), T h 17 (RORgammat + ),

- Submitted by
- Invitrogen Antibodies (provider)
- Main image
- Experimental details
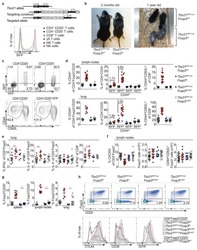
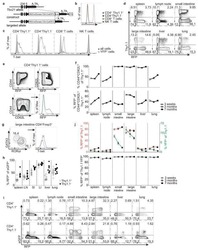
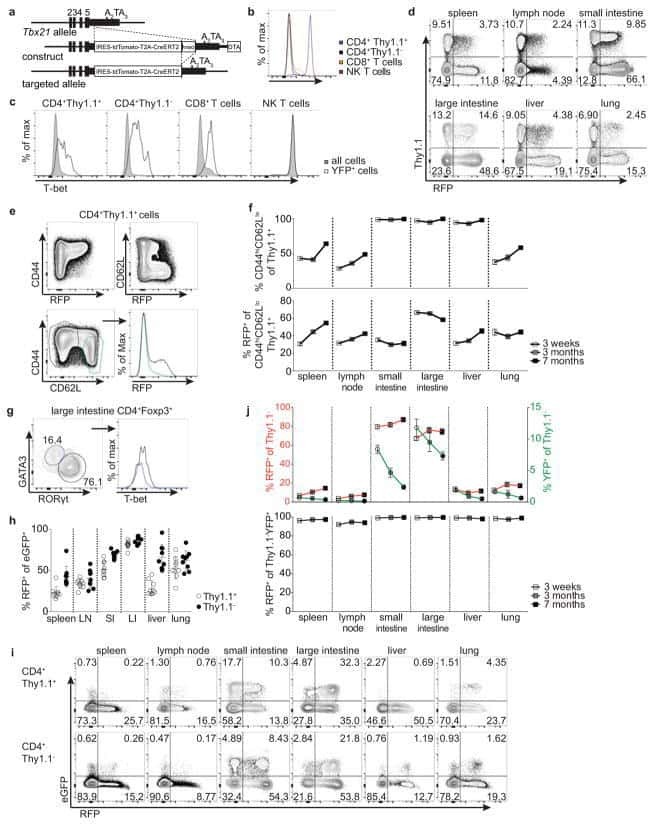
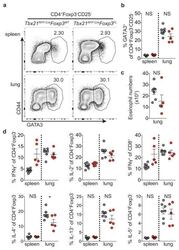
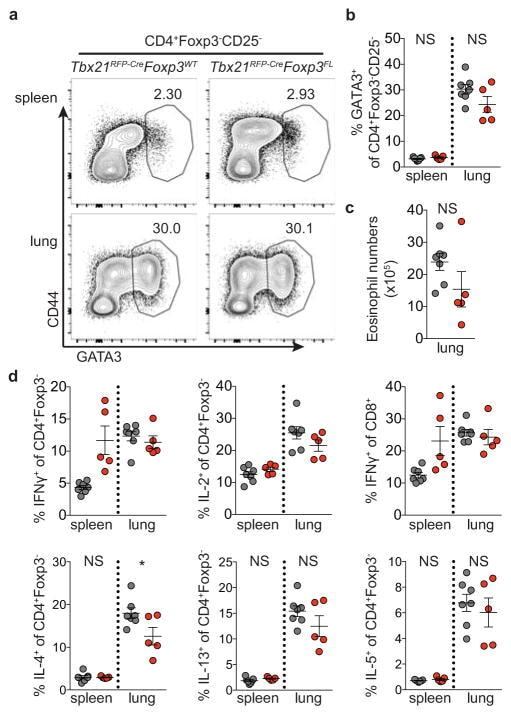
- Extended Data Figure 7 Distinguishing the drivers of autoimmunity in the absence of T-bet + Treg cells a,b , ex-Treg cells are no more pathogenic than effector CD4 T cells. a , CD4 + CD25 + (Treg) cells were sorted from lymph nodes of Tbx21 RFP-Cre Foxp3 WT mice, and CD4 + CD25 - (effector) and CD4 + CD25 lo (exTreg) cells were sorted from lymph nodes of Tbx21 RFP-Cre Foxp3 FL mice for transfer into Tcrb - / - Tcrd - / - mice. Intracellular staining for Foxp3 demonstrates purity of cell populations. b , Weights of Tcrb - / - Tcrd - / - mice receiving CD4 + CD25 + (white squares), CD4 + CD25 - (black squares), and CD4 + CD25 lo (gray squares) cells. c , Percentages and numbers of the indicated T cell populations in spleens of mice analyzed on d62 post transfer. d,e , T-bet + effector alphabetaT cells drive disease upon ablation of T-bet + Treg cells. Lethally irradiated Tcrb - / - Tcrd - / - mice were reconstituted with a 1:1 mix of CD45.2 + Tbx21 RFP-Cre/WT R26 iDTR T-cell depleted bone marrow cells with either CD45.1 + Foxp3 KO , CD45.1 + Foxp3 WT , or CD45.2 + Tcrb KO T-cell depleted bone marrow cells. Mice were injected with 0.5mug diphtheria toxin (DT) on day 0, then treated daily with 0.1mug DT for 22 days before analysis. d , Weight loss in Tbx21 RFP-Cre/WT R26 iDTR :Foxp3 KO (red line) vs. Tbx21 RFP-Cre/WT R26 iDTR :Foxp3 WT (black line) vs. Tbx21 RFP-Cre/WT R26 iDTR :Tcrb KO (blue line) reconstituted mice. e , Representative fl
- Submitted by
- Invitrogen Antibodies (provider)
- Main image

- Experimental details
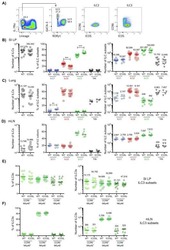
- Figure 4. Duodenal infection leads to a compartmentalized immune conflict in the duodenal gLNs and to compromised oral tolerance. a , Dissected gLNs from non-infected (N.I.) C57BL/6 mice or mice infected with 700 S. venezuelensis (S.v.) larvae 8 days prior to harvest. b , Total CD45 + cell counts ( n =5, represents 3 independent experiments). c-f , Frequency of CD103 + CD11b - ( c ), CD103 + CD11b + ( d ) and CD103 - CD11b + ( e ) among MHCII hi CD11c + cells and eosinophils among CD45 + cells ( f ) ( n =5, represents 2 independent experiments). g , Representative flow cytometry plot of GATA3 + and FOXP3 + CD4 + T cells. h , Frequency of GATA3 + CD4 + T cells ( n =5, represents 3 independent experiments). i , Frequency of total FOXP3 + among CD45.1 + cells in gLNs 64 h post adoptive transfer of 1 x 10 6 naive CD45.1 + OT-II cells into CD45.2 mice ( n =8, pool of 2 independent experiments) infected with S.v. larvae or N.I. 8 days and gavaged with OVA 48 h and 24 h prior to analysis. j , Scheme of oral tolerance experimental set-up in S.v. infected mice. k - m , Total eosinophils in bronchoalveolar lavage fluid (BALF) ( k ), frequency of eosinophils among CD45 + cells in lung tissue ( l ) and OVA-specific IgG1 levels in serum ( m ) from mice infected with S.v. or N.I. during antigen feeding (+OVA groups) or no feeding (-OVA groups), at 21 d after first immunization with OVA-alum ( j ) ( n =13 for +OVA groups, n =10 for -OVA groups, pool of 2 independent experiments). LN abbrevi

- Submitted by
- Invitrogen Antibodies (provider)
- Main image
- Experimental details
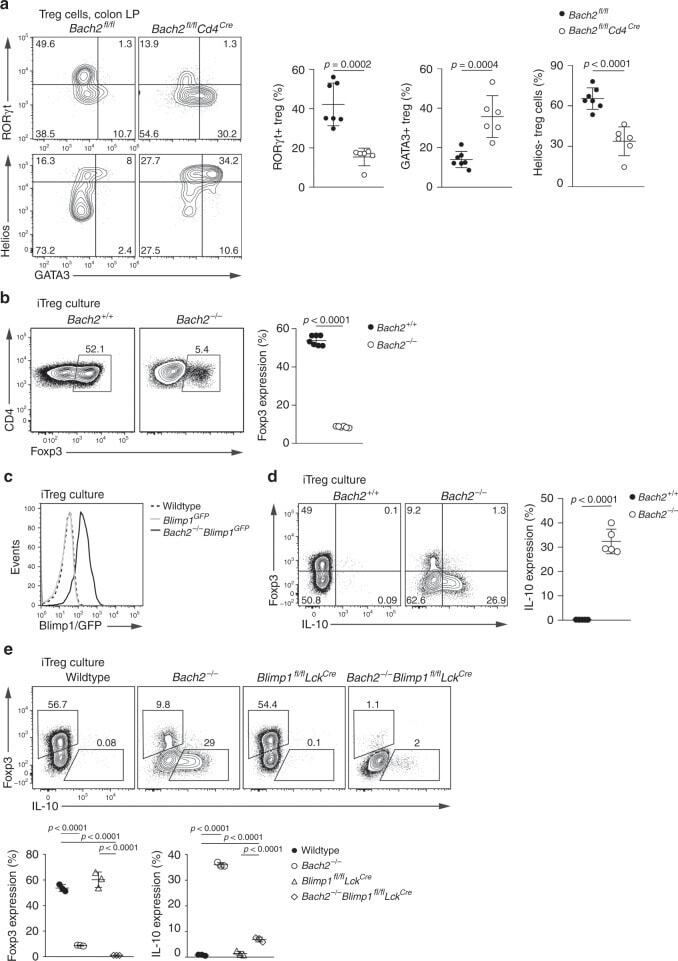
- Fig. 4 Bach2 is intrinsically required for pTreg cell differentiation. a Flow cytometry plots and quantification showing GATA3, RORgammat and Helios expression by Treg cells from the colonic lamina propria of Bach2 fl/fl Cd4 Cre and control mice. b Flow cytometry plots showing Foxp3 expression by wildtype and Bach2 -/- CD4 T cells after three days in Treg cell-inducing culture conditions, and frequency of Foxp3-expressing cells (right). c Histograms showing Blimp1-GFP expression by Blimp1 GFP and Bach2 -/- Blimp1 GFP CD4 T cells after culture in Treg cell-inducing conditions. Dashed line indicates background fluorescence levels in non-reporter cells. d Flow cytometry plots showing Foxp3 and IL-10 expression by wildtype and Bach2 -/- CD4 T cells after Treg cell-inducing culture, and quantification (right). e Flow cytometry plots showing Foxp3 expression by wildtype, Bach2 -/- , Blimp1 fl/fl Lck Cre and Bach2 -/- Blimp1 fl/fl Lck Cre after three days culture in Treg cell-inducing conditions, and frequency of Foxp3 and IL-10 expressing cells (below). Flow cytometry plots are representative, data pooled from ( a ) or representative of two ( c - e ) or six ( b ) independent experiments. Statistical significance tested using two-way ANOVA with Tukey's test ( e ). Otherwise, significance was tested using the unpaired Student's t- test. Error bars denote mean +- S.D. Source data are provided as a Source Data file.