Explore
 Validate
 Learn
Learn Flow cytometry
Antibody data
- Antibody Data
- Antigen structure
- References [41]
- Comments [0]
- Validations
- Flow cytometry [1]
- Other assay [19]
Submit
Validation data
Reference
Comment
Report error
- Product number
- 50-9966-41 - Provider product page

- Provider
- Invitrogen Antibodies
- Product name
- Gata-3 Monoclonal Antibody (TWAJ), eFluor™ 660, eBioscience™
- Antibody type
- Monoclonal
- Antigen
- Other
- Description
- Description: The monoclonal antibody TWAJ recognizes mouse and human Gata-3, a member of the Gata family of transcription factors. Gata-3 is a T cell-specific transcription factor important for thymic development and Th2 differentiation. Expression during embryonic development is found in the central nervous system, skin, mammary glands and kidney. During development, the expression of Gata-3 is essential as homozygous knock-out of Gata-3 is embryonic lethal. The Gata-3 is also essential for T cell commitment and survival. In the thymus, expression is found mainly on the CD4 single positive cells. During Th2 differentiation, Gata-3 binds to the IL-4 promoter as well as represses the expression of T-bet, thus inhibiting Th1 differentiation. Alternative splice variants have been reported especially in the MCF7 cell line. The TWAJ Human/Mouse Gata-3 antibody will recognize both forms (50 and 45 kDa) of the protein. Staining with the TWAJ Human/Mouse Gata-3 antibody requires the use of the Foxp3/Transcription Factor Staining Buffer Set. Applications Reported: This TWAJ antibody has been reported for use in intracellular staining followed by flow cytometric analysis. Applications Tested: This TWAJ antibody has been pre-titrated and tested by intracellular staining and flow cytometric analysis of mouse thymocytes using the Foxp3/Transcription Factor Staining Buffer Set (Product # 00-5523-00) and protocol. Please see Best Protocols Section (Staining intracellular Antigens for Flow Cytometry) for staining protocol (refer to Protocol B: One-step protocol for intracellular (nuclear) proteins). This can be used at 5 µL (0.125 µg) per test. A test is defined as the amount (µg) of antibody that will stain a cell sample in a final volume of 100 µL. Cell number should be determined empirically but can range from 10^5 to 10^8 cells/test. eFluor® 660 is a replacement for Alexa Fluor® 647. eFluor® 660 emits at 659 nm and is excited with the red laser (633 nm). Please make sure that your instrument is capable of detecting this fluorochome. Excitation: 633-647 nm; Emission: 668 nm; Laser: Red Laser. Filtration: 0.2 µm post-manufacturing filtered.
- Reactivity
- Human, Mouse, Porcine
- Host
- Rat
- Isotype
- IgG
- Antibody clone number
- TWAJ
- Vial size
- 25 Tests
- Concentration
- 5 µL/Test
- Storage
- 4° C, store in dark, DO NOT FREEZE!
Submitted references Graded RhoA GTPase Expression in Treg Cells Distinguishes Tumor Immunity From Autoimmunity.
Effector T cell responses unleashed by regulatory T cell ablation exacerbate oral squamous cell carcinoma.
A coordinated progression of progenitor cell states initiates urinary tract development.
Histone deacetylase 3 represses cholesterol efflux during CD4(+) T-cell activation.
Th2 Biased Immunity With Altered B Cell Profiles in Circulation of Patients With Sporotrichosis Caused by Sporothrix globosa.
Antigen discovery unveils resident memory and migratory cell roles in antifungal resistance.
Novel, Non-Gene-Destructive Knock-In Reporter Mice Refute the Concept of Monoallelic Gata3 Expression.
Attenuation of TCR-induced transcription by Bach2 controls regulatory T cell differentiation and homeostasis.
Osteoprotegerin-dependent M cell self-regulation balances gut infection and immunity.
Regulatory T Cell-Derived TGF-β1 Controls Multiple Checkpoints Governing Allergy and Autoimmunity.
Club Cell TRPV4 Serves as a Damage Sensor Driving Lung Allergic Inflammation.
Progranulin prevents regulatory NK cell cytotoxicity against antiviral T cells.
Compartmentalized gut lymph node drainage dictates adaptive immune responses.
IL-33-mediated mast cell activation promotes gastric cancer through macrophage mobilization.
Alternative ZAP70-p38 signals prime a classical p38 pathway through LAT and SOS to support regulatory T cell differentiation.
Mass cytometry reveals innate lymphoid cell differentiation pathways in the human fetal intestine.
Toxoplasma Co-infection Prevents Th2 Differentiation and Leads to a Helminth-Specific Th1 Response.
Characterisation of innate lymphoid cell populations at different sites in mice with defective T cell immunity.
ILC2s regulate adaptive Th2 cell functions via PD-L1 checkpoint control.
Water-soluble chitosan inhibits nerve growth factor and attenuates allergic inflammation in mite allergen-induced allergic rhinitis.
Interleukin-33-Activated Islet-Resident Innate Lymphoid Cells Promote Insulin Secretion through Myeloid Cell Retinoic Acid Production.
Quality of TCR signaling determined by differential affinities of enhancers for the composite BATF-IRF4 transcription factor complex.
Eosinophils are required to suppress Th2 responses in Peyer's patches during intestinal infection by nematodes.
The E-Id Protein Axis Specifies Adaptive Lymphoid Cell Identity and Suppresses Thymic Innate Lymphoid Cell Development.
Reciprocal regulation of the Il9 locus by counteracting activities of transcription factors IRF1 and IRF4.
Stability and function of regulatory T cells expressing the transcription factor T-bet.
Recruited Monocytes and Type 2 Immunity Promote Lung Regeneration following Pneumonectomy.
Intestinal helminth infection induces highly functional resident memory CD4(+) T cells in mice.
Susceptibility to Ticks and Lyme Disease Spirochetes Is Not Affected in Mice Coinfected with Nematodes.
A Role for Regulatory T Cells in a Murine Model of Epicutaneous Toluene Diisocyanate Sensitization.
Group 2 innate lymphoid cells license dendritic cells to potentiate memory TH2 cell responses.
Intranasal Administration of Lentiviral miR-135a Regulates Mast Cell and Allergen-Induced Inflammation by Targeting GATA-3.
Cutting edge: identification and characterization of human intrahepatic CD49a+ NK cells.
Prophylaxis with a respiratory syncytial virus (RSV) anti-G protein monoclonal antibody shifts the adaptive immune response to RSV rA2-line19F infection from Th2 to Th1 in BALB/c mice.
Regulatory T cells prevent Th2 immune responses and pulmonary eosinophilia during respiratory syncytial virus infection in mice.
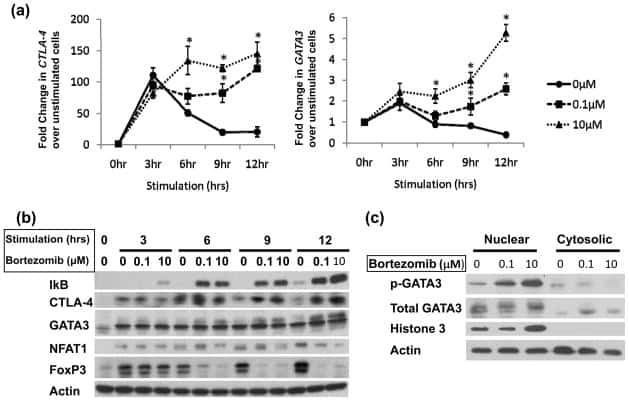
Impaired proteasome function activates GATA3 in T cells and upregulates CTLA-4: relevance for Sézary syndrome.
GATA3 suppresses metastasis and modulates the tumour microenvironment by regulating microRNA-29b expression.
Mesenchymal stem cells alleviate TNBS-induced colitis by modulating inflammatory and autoimmune responses.
Helios is associated with CD4 T cells differentiating to T helper 2 and follicular helper T cells in vivo independently of Foxp3 expression.
Role of CD44 in the differentiation of Th1 and Th2 cells: CD44-deficiency enhances the development of Th2 effectors in response to sheep RBC and chicken ovalbumin.
Normalization of obesity-associated insulin resistance through immunotherapy.
Kalim KW, Yang JQ, Modur V, Nguyen P, Li Y, Zheng Y, Guo F
Frontiers in immunology 2021;12:726393
Frontiers in immunology 2021;12:726393
Effector T cell responses unleashed by regulatory T cell ablation exacerbate oral squamous cell carcinoma.
Chao JL, Korzinkin M, Zhavoronkov A, Ozerov IV, Walker MT, Higgins K, Lingen MW, Izumchenko E, Savage PA
Cell reports. Medicine 2021 Sep 21;2(9):100399
Cell reports. Medicine 2021 Sep 21;2(9):100399
A coordinated progression of progenitor cell states initiates urinary tract development.
Sanchez-Ferras O, Pacis A, Sotiropoulou M, Zhang Y, Wang YC, Bourgey M, Bourque G, Ragoussis J, Bouchard M
Nature communications 2021 May 11;12(1):2627
Nature communications 2021 May 11;12(1):2627
Histone deacetylase 3 represses cholesterol efflux during CD4(+) T-cell activation.
Wilfahrt D, Philips RL, Lama J, Kizerwetter M, Shapiro MJ, McCue SA, Kennedy MM, Rajcula MJ, Zeng H, Shapiro VS
eLife 2021 Dec 2;10
eLife 2021 Dec 2;10
Th2 Biased Immunity With Altered B Cell Profiles in Circulation of Patients With Sporotrichosis Caused by Sporothrix globosa.
Zu J, Yao L, Song Y, Cui Y, Guan M, Chen R, Zhen Y, Li S
Frontiers in immunology 2020;11:570888
Frontiers in immunology 2020;11:570888
Antigen discovery unveils resident memory and migratory cell roles in antifungal resistance.
Dobson HE, Dias LDS, Kohn EM, Fites S, Wiesner DL, Dileepan T, Kujoth GC, Abraham A, Ostroff GR, Klein BS, Wüthrich M
Mucosal immunology 2020 May;13(3):518-529
Mucosal immunology 2020 May;13(3):518-529
Novel, Non-Gene-Destructive Knock-In Reporter Mice Refute the Concept of Monoallelic Gata3 Expression.
Rao TN, Kumar S, Pulikkottil AJ, Oliveri F, Hendriks RW, Beckel F, Fehling HJ
Journal of immunology (Baltimore, Md. : 1950) 2020 May 1;204(9):2600-2611
Journal of immunology (Baltimore, Md. : 1950) 2020 May 1;204(9):2600-2611
Attenuation of TCR-induced transcription by Bach2 controls regulatory T cell differentiation and homeostasis.
Sidwell T, Liao Y, Garnham AL, Vasanthakumar A, Gloury R, Blume J, Teh PP, Chisanga D, Thelemann C, de Labastida Rivera F, Engwerda CR, Corcoran L, Kometani K, Kurosaki T, Smyth GK, Shi W, Kallies A
Nature communications 2020 Jan 14;11(1):252
Nature communications 2020 Jan 14;11(1):252
Osteoprotegerin-dependent M cell self-regulation balances gut infection and immunity.
Kimura S, Nakamura Y, Kobayashi N, Shiroguchi K, Kawakami E, Mutoh M, Takahashi-Iwanaga H, Yamada T, Hisamoto M, Nakamura M, Udagawa N, Sato S, Kaisho T, Iwanaga T, Hase K
Nature communications 2020 Jan 13;11(1):234
Nature communications 2020 Jan 13;11(1):234
Regulatory T Cell-Derived TGF-β1 Controls Multiple Checkpoints Governing Allergy and Autoimmunity.
Turner JA, Stephen-Victor E, Wang S, Rivas MN, Abdel-Gadir A, Harb H, Cui Y, Fanny M, Charbonnier LM, Fong JJH, Benamar M, Wang L, Burton OT, Bansal K, Bry L, Zhu C, Li QZ, Clement RL, Oettgen HC, Crestani E, Rachid R, Sage PT, Chatila TA
Immunity 2020 Dec 15;53(6):1202-1214.e6
Immunity 2020 Dec 15;53(6):1202-1214.e6
Club Cell TRPV4 Serves as a Damage Sensor Driving Lung Allergic Inflammation.
Wiesner DL, Merkhofer RM, Ober C, Kujoth GC, Niu M, Keller NP, Gern JE, Brockman-Schneider RA, Evans MD, Jackson DJ, Warner T, Jarjour NN, Esnault SJ, Feldman MB, Freeman M, Mou H, Vyas JM, Klein BS
Cell host & microbe 2020 Apr 8;27(4):614-628.e6
Cell host & microbe 2020 Apr 8;27(4):614-628.e6
Progranulin prevents regulatory NK cell cytotoxicity against antiviral T cells.
Huang A, Shinde PV, Huang J, Senff T, Xu HC, Margotta C, Häussinger D, Willnow TE, Zhang J, Pandyra AA, Timm J, Weggen S, Lang KS, Lang PA
JCI insight 2019 Sep 5;4(17)
JCI insight 2019 Sep 5;4(17)
Compartmentalized gut lymph node drainage dictates adaptive immune responses.
Esterházy D, Canesso MCC, Mesin L, Muller PA, de Castro TBR, Lockhart A, ElJalby M, Faria AMC, Mucida D
Nature 2019 May;569(7754):126-130
Nature 2019 May;569(7754):126-130
IL-33-mediated mast cell activation promotes gastric cancer through macrophage mobilization.
Eissmann MF, Dijkstra C, Jarnicki A, Phesse T, Brunnberg J, Poh AR, Etemadi N, Tsantikos E, Thiem S, Huntington ND, Hibbs ML, Boussioutas A, Grimbaldeston MA, Buchert M, O'Donoghue RJJ, Masson F, Ernst M
Nature communications 2019 Jun 21;10(1):2735
Nature communications 2019 Jun 21;10(1):2735
Alternative ZAP70-p38 signals prime a classical p38 pathway through LAT and SOS to support regulatory T cell differentiation.
Jun JE, Kulhanek KR, Chen H, Chakraborty A, Roose JP
Science signaling 2019 Jul 23;12(591)
Science signaling 2019 Jul 23;12(591)
Mass cytometry reveals innate lymphoid cell differentiation pathways in the human fetal intestine.
Li N, van Unen V, Höllt T, Thompson A, van Bergen J, Pezzotti N, Eisemann E, Vilanova A, Chuva de Sousa Lopes SM, Lelieveldt BPF, Koning F
The Journal of experimental medicine 2018 May 7;215(5):1383-1396
The Journal of experimental medicine 2018 May 7;215(5):1383-1396
Toxoplasma Co-infection Prevents Th2 Differentiation and Leads to a Helminth-Specific Th1 Response.
Ahmed N, French T, Rausch S, Kühl A, Hemminger K, Dunay IR, Steinfelder S, Hartmann S
Frontiers in cellular and infection microbiology 2017;7:341
Frontiers in cellular and infection microbiology 2017;7:341
Characterisation of innate lymphoid cell populations at different sites in mice with defective T cell immunity.
Dutton EE, Camelo A, Sleeman M, Herbst R, Carlesso G, Belz GT, Withers DR
Wellcome open research 2017;2:117
Wellcome open research 2017;2:117
ILC2s regulate adaptive Th2 cell functions via PD-L1 checkpoint control.
Schwartz C, Khan AR, Floudas A, Saunders SP, Hams E, Rodewald HR, McKenzie ANJ, Fallon PG
The Journal of experimental medicine 2017 Sep 4;214(9):2507-2521
The Journal of experimental medicine 2017 Sep 4;214(9):2507-2521
Water-soluble chitosan inhibits nerve growth factor and attenuates allergic inflammation in mite allergen-induced allergic rhinitis.
Chen PC, Hsieh MH, Kuo WS, Kao HF, Hsu CL, Wang JY
The Journal of allergy and clinical immunology 2017 Oct;140(4):1146-1149.e8
The Journal of allergy and clinical immunology 2017 Oct;140(4):1146-1149.e8
Interleukin-33-Activated Islet-Resident Innate Lymphoid Cells Promote Insulin Secretion through Myeloid Cell Retinoic Acid Production.
Dalmas E, Lehmann FM, Dror E, Wueest S, Thienel C, Borsigova M, Stawiski M, Traunecker E, Lucchini FC, Dapito DH, Kallert SM, Guigas B, Pattou F, Kerr-Conte J, Maechler P, Girard JP, Konrad D, Wolfrum C, Böni-Schnetzler M, Finke D, Donath MY
Immunity 2017 Nov 21;47(5):928-942.e7
Immunity 2017 Nov 21;47(5):928-942.e7
Quality of TCR signaling determined by differential affinities of enhancers for the composite BATF-IRF4 transcription factor complex.
Iwata A, Durai V, Tussiwand R, Briseño CG, Wu X, Grajales-Reyes GE, Egawa T, Murphy TL, Murphy KM
Nature immunology 2017 May;18(5):563-572
Nature immunology 2017 May;18(5):563-572
Eosinophils are required to suppress Th2 responses in Peyer's patches during intestinal infection by nematodes.
Strandmark J, Steinfelder S, Berek C, Kühl AA, Rausch S, Hartmann S
Mucosal immunology 2017 May;10(3):661-672
Mucosal immunology 2017 May;10(3):661-672
The E-Id Protein Axis Specifies Adaptive Lymphoid Cell Identity and Suppresses Thymic Innate Lymphoid Cell Development.
Miyazaki M, Miyazaki K, Chen K, Jin Y, Turner J, Moore AJ, Saito R, Yoshida K, Ogawa S, Rodewald HR, Lin YC, Kawamoto H, Murre C
Immunity 2017 May 16;46(5):818-834.e4
Immunity 2017 May 16;46(5):818-834.e4
Reciprocal regulation of the Il9 locus by counteracting activities of transcription factors IRF1 and IRF4.
Campos Carrascosa L, Klein M, Kitagawa Y, Lückel C, Marini F, König A, Guralnik A, Raifer H, Hagner-Benes S, Rädler D, Böck A, Kang C, Lohoff M, Garn H, Schaub B, Berberich-Siebelt F, Sakaguchi S, Bopp T, Huber M
Nature communications 2017 May 12;8:15366
Nature communications 2017 May 12;8:15366
Stability and function of regulatory T cells expressing the transcription factor T-bet.
Levine AG, Mendoza A, Hemmers S, Moltedo B, Niec RE, Schizas M, Hoyos BE, Putintseva EV, Chaudhry A, Dikiy S, Fujisawa S, Chudakov DM, Treuting PM, Rudensky AY
Nature 2017 Jun 15;546(7658):421-425
Nature 2017 Jun 15;546(7658):421-425
Recruited Monocytes and Type 2 Immunity Promote Lung Regeneration following Pneumonectomy.
Lechner AJ, Driver IH, Lee J, Conroy CM, Nagle A, Locksley RM, Rock JR
Cell stem cell 2017 Jul 6;21(1):120-134.e7
Cell stem cell 2017 Jul 6;21(1):120-134.e7
Intestinal helminth infection induces highly functional resident memory CD4(+) T cells in mice.
Steinfelder S, Rausch S, Michael D, Kühl AA, Hartmann S
European journal of immunology 2017 Feb;47(2):353-363
European journal of immunology 2017 Feb;47(2):353-363
Susceptibility to Ticks and Lyme Disease Spirochetes Is Not Affected in Mice Coinfected with Nematodes.
Maaz D, Rausch S, Richter D, Krücken J, Kühl AA, Demeler J, Blümke J, Matuschka FR, von Samson-Himmelstjerna G, Hartmann S
Infection and immunity 2016 May;84(5):1274-1286
Infection and immunity 2016 May;84(5):1274-1286
A Role for Regulatory T Cells in a Murine Model of Epicutaneous Toluene Diisocyanate Sensitization.
Long CM, Marshall NB, Lukomska E, Kashon ML, Meade BJ, Shane H, Anderson SE
Toxicological sciences : an official journal of the Society of Toxicology 2016 Jul;152(1):85-98
Toxicological sciences : an official journal of the Society of Toxicology 2016 Jul;152(1):85-98
Group 2 innate lymphoid cells license dendritic cells to potentiate memory TH2 cell responses.
Halim TY, Hwang YY, Scanlon ST, Zaghouani H, Garbi N, Fallon PG, McKenzie AN
Nature immunology 2016 Jan;17(1):57-64
Nature immunology 2016 Jan;17(1):57-64
Intranasal Administration of Lentiviral miR-135a Regulates Mast Cell and Allergen-Induced Inflammation by Targeting GATA-3.
Deng YQ, Yang YQ, Wang SB, Li F, Liu MZ, Hua QQ, Tao ZZ
PloS one 2015;10(9):e0139322
PloS one 2015;10(9):e0139322
Cutting edge: identification and characterization of human intrahepatic CD49a+ NK cells.
Marquardt N, Béziat V, Nyström S, Hengst J, Ivarsson MA, Kekäläinen E, Johansson H, Mjösberg J, Westgren M, Lankisch TO, Wedemeyer H, Ellis EC, Ljunggren HG, Michaëlsson J, Björkström NK
Journal of immunology (Baltimore, Md. : 1950) 2015 Mar 15;194(6):2467-71
Journal of immunology (Baltimore, Md. : 1950) 2015 Mar 15;194(6):2467-71
Prophylaxis with a respiratory syncytial virus (RSV) anti-G protein monoclonal antibody shifts the adaptive immune response to RSV rA2-line19F infection from Th2 to Th1 in BALB/c mice.
Boyoglu-Barnum S, Chirkova T, Todd SO, Barnum TR, Gaston KA, Jorquera P, Haynes LM, Tripp RA, Moore ML, Anderson LJ
Journal of virology 2014 Sep;88(18):10569-83
Journal of virology 2014 Sep;88(18):10569-83
Regulatory T cells prevent Th2 immune responses and pulmonary eosinophilia during respiratory syncytial virus infection in mice.
Durant LR, Makris S, Voorburg CM, Loebbermann J, Johansson C, Openshaw PJ
Journal of virology 2013 Oct;87(20):10946-54
Journal of virology 2013 Oct;87(20):10946-54
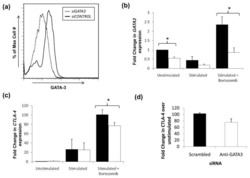
Impaired proteasome function activates GATA3 in T cells and upregulates CTLA-4: relevance for Sézary syndrome.
Gibson HM, Mishra A, Chan DV, Hake TS, Porcu P, Wong HK
The Journal of investigative dermatology 2013 Jan;133(1):249-57
The Journal of investigative dermatology 2013 Jan;133(1):249-57
GATA3 suppresses metastasis and modulates the tumour microenvironment by regulating microRNA-29b expression.
Chou J, Lin JH, Brenot A, Kim JW, Provot S, Werb Z
Nature cell biology 2013 Feb;15(2):201-13
Nature cell biology 2013 Feb;15(2):201-13
Mesenchymal stem cells alleviate TNBS-induced colitis by modulating inflammatory and autoimmune responses.
Chen QQ, Yan L, Wang CZ, Wang WH, Shi H, Su BB, Zeng QH, Du HT, Wan J
World journal of gastroenterology 2013 Aug 7;19(29):4702-17
World journal of gastroenterology 2013 Aug 7;19(29):4702-17
Helios is associated with CD4 T cells differentiating to T helper 2 and follicular helper T cells in vivo independently of Foxp3 expression.
Serre K, Bénézech C, Desanti G, Bobat S, Toellner KM, Bird R, Chan S, Kastner P, Cunningham AF, Maclennan IC, Mohr E
PloS one 2011;6(6):e20731
PloS one 2011;6(6):e20731
Role of CD44 in the differentiation of Th1 and Th2 cells: CD44-deficiency enhances the development of Th2 effectors in response to sheep RBC and chicken ovalbumin.
Guan H, Nagarkatti PS, Nagarkatti M
Journal of immunology (Baltimore, Md. : 1950) 2009 Jul 1;183(1):172-80
Journal of immunology (Baltimore, Md. : 1950) 2009 Jul 1;183(1):172-80
Normalization of obesity-associated insulin resistance through immunotherapy.
Winer S, Chan Y, Paltser G, Truong D, Tsui H, Bahrami J, Dorfman R, Wang Y, Zielenski J, Mastronardi F, Maezawa Y, Drucker DJ, Engleman E, Winer D, Dosch HM
Nature medicine 2009 Aug;15(8):921-9
Nature medicine 2009 Aug;15(8):921-9
No comments: Submit comment
Supportive validation
- Submitted by
- Invitrogen Antibodies (provider)
- Main image

- Experimental details
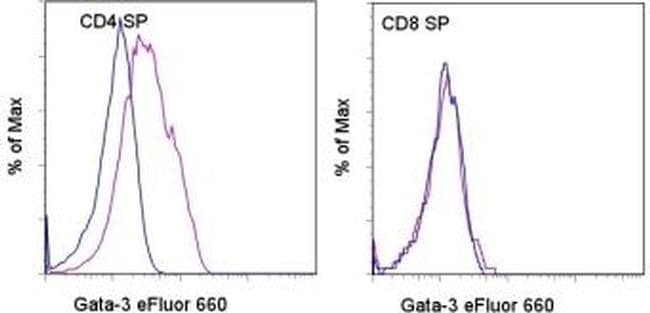
- Intracellular staining of BALB/c thymocytes with Anti-Mouse CD4 PE (Product # 12-0041-82), Anti-Mouse CD8a FITC (Product # 11-0081-82), and Rat IgG2b K Isotype Control eFluor® 660 (Product # 50-4031-82) (blue histogram) or Anti-Human/Mouse Gata-3 eFluor® 660 (purple histogram) using the Foxp3 Staining Buffers (Product # 00-5523-00). CD4 single-positive (left) or CD8 single-positive (right) cells were used for analysis.
Supportive validation
- Submitted by
- Invitrogen Antibodies (provider)
- Main image

- Experimental details
- NULL

- Submitted by
- Invitrogen Antibodies (provider)
- Main image
- Experimental details
- NULL

- Submitted by
- Invitrogen Antibodies (provider)
- Main image

- Experimental details
- NULL
- Submitted by
- Invitrogen Antibodies (provider)
- Main image
- Experimental details
- NULL

- Submitted by
- Invitrogen Antibodies (provider)
- Main image
- Experimental details
- NULL
- Submitted by
- Invitrogen Antibodies (provider)
- Main image
- Experimental details
- NULL
- Submitted by
- Invitrogen Antibodies (provider)
- Main image
- Experimental details
- NULL
- Submitted by
- Invitrogen Antibodies (provider)
- Main image
- Experimental details
- NULL
- Submitted by
- Invitrogen Antibodies (provider)
- Main image
- Experimental details
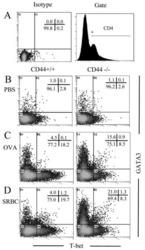
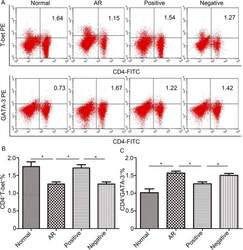
- Fig 5 Lentiviral-mmu-miR-135a treatment influences Th cell polarization. The expression of T-bet and GATA-3 protein in CD4 + T cells was measured in the spleens of normal (control), AR (AR-induced), positive (AR-induced, treated with lentiviral-mmu-miR-135a), and negative (AR-induced, treated with empty lentivirus) mice using flow cytometry. (A) Representative dot plots from each experimental group. The percentages of CD4 + T-bet + T cells (B) and CD4 + GATA-3 + T cells (C) were also calculated. Data are presented as the mean +- SEM. *P

- Submitted by
- Invitrogen Antibodies (provider)
- Main image
- Experimental details
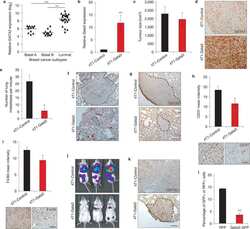
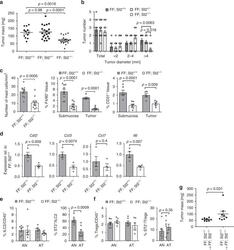
- Fig. 7 Tumor burden is reduced in St2 receptor-deficient gp130 FF mice. a Quantification of total tumor burden in 100-day-old mice of the indicated genotype. Each symbol represents an individual mouse. One-way ANOVA was performed with F (DFn, Dfd) = 11.83 (2, 48). b Enumeration of total tumor number from mice in a , and of tumors following classification according to their size. n = 12 ( FF, St2 +/+ ), n = 20 ( FF, St2 +/ - ), and n = 19 ( FF, St2 -/- ) mice. One-way ANOVA was performed with F (DFn, Dfd) = 22.79 (11, 192). c Quantification of toluidine blue (for detection of mast cells; submucosal tissue), F4/80 and CD31 stained sections of gastric tumors of mice of the indicated genotype. Mast cells: n = 10 mice, t -test t (df) = 4.25 (18); F4/80: n = 8 (FF; St2 +/+ ), n = 9 (FF; St2 - /- ), one-way ANOVA F (DFn, Dfd) = 27.52 (3,29); CD31: n = 6 (Submucosa) n = 5 (Tumor), and one-way ANOVA F (DFn, Dfd) = 13.6 (3,19). d qPCR expression analysis of chemokines expressed by FACS-purified tumor-associated mast cells from stomachs of either FF; St2 +/+ or FF; St2 -/- mice. All n = 4 from two independent experiments. Csf2 : t -test t (df) = 3.81 (6); Ccl3 : t -test t (df) = 3.97 (6); Ccl7 : t -test t (df) = 0.88(6); Il6 :: t -test t (df) = 4.02 (6); e , f Flow cytometric analysis of unaffected antrum (AN) and antrum tumors (AT) of indicated genotype for the frequency of ILC2 cells (lineage - , Cd11b - , Gata3 + ), Tregs (Foxp3 + , CD4 + ), and proportion of St2 + cells within these

- Submitted by
- Invitrogen Antibodies (provider)
- Main image

- Experimental details
- Fig. 6 Inactivation of Tfap2a and Tfap2b by CRISPR/Cas9 leads to defects in nephric duct morphogenesis and progenitor cell identity. a Schematic representation of Tfap2a and Tfap2b exons targeted by CRISPR/Cas9 technology and the location of the sgRNAs used. b Wholemount GFP fluorescence of control ( Pax2-GFP ) and allelic series of Tfap2a/2b ; Pax2-GFP mutant embryos at E9.5 and E10.5. White arrows denote nephric duct integrity defects whereas yellow arrow and inset magnification highlight ectopic Pax2-GFP positive cells. Scale bar of the inset = 50 mum. c Quantification of nephric duct (ND) elongation in Tfap2a/2b ; Pax2-GFP double KO embryos at E9.5. n = 15 (Control) and n = 4 ( Tfap2a/2b double KO) biologically independent samples. The graphs represent mean +- SD, assessed by a two-tailed Mann-Whitney test. Source data are provided as a Source Data file . d Immunostaining for the nephric duct marker Gata3 in transverse sections of E9.5 Tfap2a/2b double mutant shows an elongation defect and the presence of ectopic Gata3 positive (nephric duct) cells (yellow arrows). Nephric duct cells are denoted by white dotted lines. Scale bar 25 mum for all pictures. e Quantification of Gata3 + cells in the rostral region of E9.5 control and Tfap2a/2b double KO embryos ( n = 7). The graph represents mean +- SD, determined by a two-tailed unpaired t -test. Source data are provided as a Source Data file . f Immunostaining for the markers Hoxb9 (NdPr1), and intermediate mesoderm (Wt1) in t

- Submitted by
- Invitrogen Antibodies (provider)
- Main image

- Experimental details
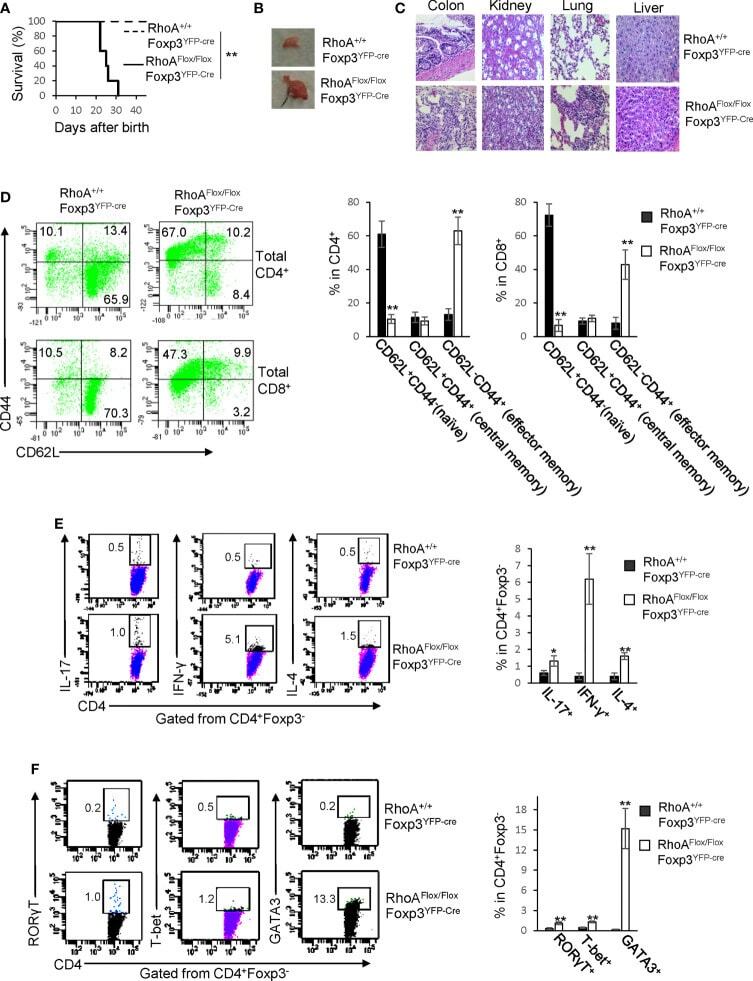
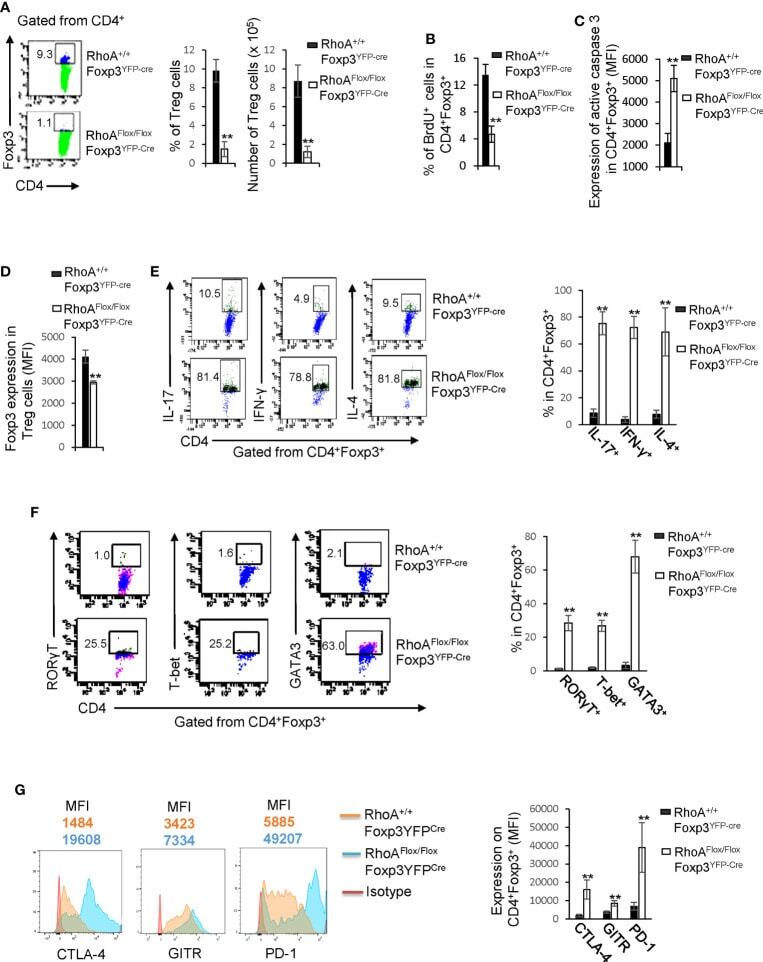
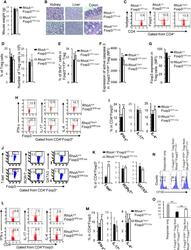
- Figure 1 Homozygous RhoA deletion in Treg cells leads to early, fatal spontaneous inflammatory disorders. (A) Survival outcome of RhoA +/+ Foxp3 YFP-Cre and RhoA Flox/Flox Foxp3 YFP-Cre mice. Results were analyzed with a log-rank (Mantel-Cox) test and expressed as Kaplan-Meier survival curves. (B) Image of lymphadenopathy in RhoA Flox/Flox Foxp3 YFP-Cre mice. Inguinal lymph nodes are shown. (C) Images of H&E staining of the indicated organs from RhoA +/+ Foxp3 YFP-Cre and RhoA Flox/Flox Foxp3 YFP-Cre mice (original magnification X 400). (D) Left, representative flow cytogram of CD44 and CD62L staining in CD4 + and CD8 + cells from the spleen of RhoA +/+ Foxp3 YFP-Cre and RhoA Flox/Flox Foxp3 YFP-Cre mice. The numbers indicate percentages of CD44 + , CD44 + CD62L + , and CD62L + cells. Right, average percentages of CD44 + , CD44 + CD62L + , and CD62L + cells. (E) Left, representative flow cytogram of IL-17, IFN-gamma, and IL-4 staining in CD4 + Foxp3 - cells from the spleen of RhoA +/+ Foxp3 YFP-Cre and RhoA Flox/Flox Foxp3 YFP-Cre mice. The numbers indicate percentages of IL-17 + , IFN-gamma + , and IL-4 + cells. Right, average percentages of IL-17 + , IFN-gamma + , and IL-4 + cells. (F) Left, representative flow cytogram of RORgammaT, T-bet and GATA3 staining in CD4 + Foxp3 - cells from the spleen of RhoA +/+ Foxp3 YFP-Cre and RhoA Flox/Flox Foxp3 YFP-Cre mice. The numbers indicate percentages of RORgammaT + , T-bet + , and GATA3 + cells. Right, average percentages of RORgam
- Submitted by
- Invitrogen Antibodies (provider)
- Main image
- Experimental details
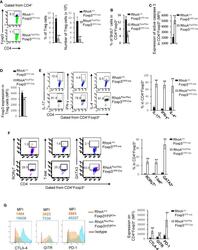
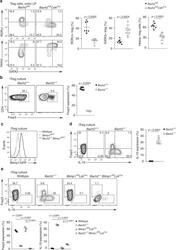
- Figure 2 Homozygous RhoA deletion in Treg cells dampens Treg cell homeostasis and induces Treg cell plasticity. (A) Left, representative flow cytogram of Foxp3 staining in CD4 + cells from the spleen of RhoA +/+ Foxp3 YFP-Cre and RhoA Flox/Flox Foxp3 YFP-Cre mice. The numbers indicate percentages of CD4 + Foxp3 + Treg cells. Middle, average percentages of CD4 + Foxp3 + Treg cells. Right, average numbers of CD4 + Foxp3 + Treg cells. (B) Treg cell proliferation. Percentages of CD4 + Foxp3 + Treg cells incorporated with BrdU are shown. (C) Treg cell apoptosis. The expression levels (MFI: Mean fluorescence intensity) of active caspase 3 in CD4 + Foxp3 + Treg cells are shown. (D) The expression levels of Foxp3 in Treg cells. (E) Left, representative flow cytogram of IL-17, IFN-gamma, and IL-4 staining in CD4 + Foxp3 + Treg cells. The numbers indicate percentages of IL-17 + , IFN-gamma + , and IL-4 + Treg cells. Right, average percentages of IL-17 + , IFN-gamma + , and IL-4 + Treg cells. (F) Left, representative flow cytogram of RORgammaT, T-bet and GATA3 staining in CD4 + Foxp3 + Treg cells. The numbers indicate percentages of RORgammaT + , T-bet + , and GATA3 + Treg cells. Right, average percentages of RORgammaT + , T-bet + , and GATA3 + Treg cells. (G) Left, representative histogram of the expression levels of CTLA-4, GITR and PD-1 in CD4 + Foxp3 + Treg cells. The numbers above the graphs indicate MFI. Right, average MFI of CTLA-4, GITR and PD-1 in CD4 + Foxp3 + Treg cells. n =
- Submitted by
- Invitrogen Antibodies (provider)
- Main image
- Experimental details
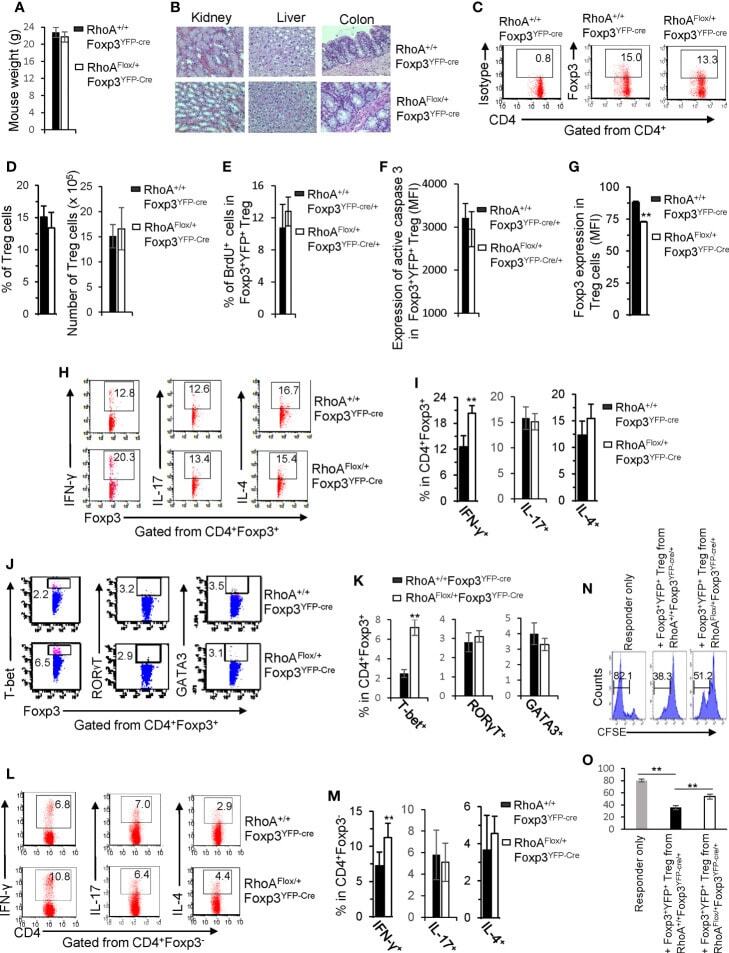
- Figure 5 Heterozygous RhoA deletion in Treg cells induces Treg cell plasticity and increases CD4 + effector T cells but does not result in autoimmunity. (A) Body weight of RhoA +/+ Foxp3 YFP-Cre and RhoA Flox/+ Foxp3 YFP-Cre mice. (B) Images of H&E staining of the indicated organs. (C) Representative flow cytogram of Foxp3 staining in CD4 + cells from the spleen of RhoA +/+ Foxp3 YFP-Cre and RhoA Flox/+ Foxp3 YFP-Cre mice. The numbers indicate percentages of CD4 + Foxp3 + Treg cells. (D) Left, average percentages of CD4 + Foxp3 + Treg cells. Right, cell numbers of CD4 + Foxp3 + Treg cells. (E) Proliferation of Foxp3 + YFP + Treg cells from RhoA +/+ Foxp3 YFP-Cre/+ and RhoA Flox/+ Foxp3 YFP-Cre/+ female mice. Percentages of Foxp3 + YFP + Treg cells incorporated with BrdU are shown. (F) Apoptosis of Foxp3 + YFP + Treg cells from RhoA +/+ Foxp3 YFP-Cre/+ and RhoA Flox/+ Foxp3 YFP-Cre/+ female mice. The expression levels (MFI: mean fluorescence intensity) of active caspase 3 in Foxp3 + YFP + Treg cells are shown. (G) The expression levels of Foxp3 in Treg cells from RhoA +/+ Foxp3 YFP-Cre and RhoA Flox/+ Foxp3 YFP-Cre mice. (H) Representative flow cytogram of IFN-gamma, IL-17 and IL-4 staining in CD4 + Foxp3 + Treg cells. The numbers indicate percentages of IFN-gamma + , IL-17 + and IL-4 + Treg cells. (I) Average percentages of IFN-gamma + , IL-17 + and IL-4 + Treg cells. (J) Representative flow cytogram of RORgammaT, T-bet and GATA3 staining in CD4 + Foxp3 + Treg cells. The numb
- Submitted by
- Invitrogen Antibodies (provider)
- Main image
- Experimental details
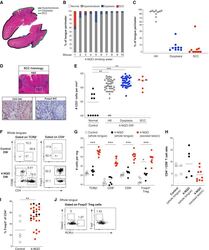
- Figure 2 Murine carcinogen-induced oral lesions are enriched for CD4 + Treg and conventional T cells 6- to 8-week-old C57BL/6 mice were exposed to drinking water containing 100 mug/mL 4-NQO or vehicle control for 20 weeks. (A) Quantification of histopathology. After 20 weeks of treatment with 4-NQO drinking water, tongues were dissected, fixed in 10% formalin, bisected longitudinally, and stained with H&E. The perimeter of each tongue is outlined and categorized base on histology grade: hyperkeratosis (black); dysplasia (blue); or SCC (green). Shown is a representative H&E stain of FFPE tongue after longitudinal bisection of 4-NQO-treated mouse, perimeter traced based on histology grades noted above. (B and C) Summary plots of 4-NQO-induced histopathology, showing the percentage of tongue perimeter defined as indicated histology grade. Each bar (B) or symbol (C) represents an individual tongue from a single mouse. Median is indicated in (C). n = 10 mice. (D) (Top) Representative H&E image of SCC region of tongue epithelium from (A). (Bottom) Representative CD3 (left) and Foxp3 (right) IHC images of adjacent sections of depicted SCC region denoted by white box in H&E image are shown. White arrows denote CD3 + or Foxp3 + cells. Scale bars represent 400 mum (H&E) or 50 mum (IHC). (E) Summary plot of pooled data from CD3 IHC density analysis, showing the number of CD3 + cells per mm 2 for each lesion. Each symbol represents an individual lesion. Median is indicated. n = 10 region
- Submitted by
- Invitrogen Antibodies (provider)
- Main image

- Experimental details
- Figure 2. Histone deacetylase 3 (HDAC3)-deficient CD4 + T cells from dLck-Cre HDAC3 cKO mice have reduced differentiated T h -cell populations. Identification of helper T-cell populations in vivo. Splenocytes were harvested from wild-type (WT) and HDAC3 cKO mice, and labeled for flow cytometry. Cells were first gated on HDAC3 + or HDAC3 - events, then gating for T h 1 (T-bet + ), T h 2 (GATA3 + ), T h 17 (RORgammat + ), T reg (Foxp3 + CD25 + ), and T fh (CXCR5 + PD-1 + Bcl-6 hi ) is shown (left). Bar plots on right represent pooled data for the total cell number +- standard deviation (SD) from three independent experiments ( n = 4-5 mice/group in total). Non-T fh CXCR5 - PD-1 - cells (dark gray histograms) were used as a negative control for Bcl-6 expression to set the gate on the Bcl-6 histograms. Statistical significance was determined for the indicated comparisons using ordinary one-way analysis of variance (ANOVA) with Tukey's multiple comparisons test (*p < 0.05, **p < 0.01, ***p < 0.001, ****p < 0.0001). Figure 2--figure supplement 1. Histone deacetylase 3 (HDAC3)-deficient T cells from dLck-Cre HDAC3 cKO mice have reduced differentiated T h -cell populations. Identification of helper T-cell populations in vivo. Lymphocytes were harvested from mesenteric lymph nodes of wild-type (WT) and dLck-Cre HDAC3 cKO mice, and labeled for flow cytometry. Cells were first gated on HDAC3 + or HDAC3 - events, then gating for T h 1 (T-bet + ), T h 2 (GATA3 + ), T h 17 (RORgammat + ),

- Submitted by
- Invitrogen Antibodies (provider)
- Main image
- Experimental details
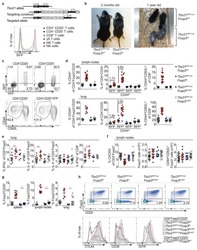
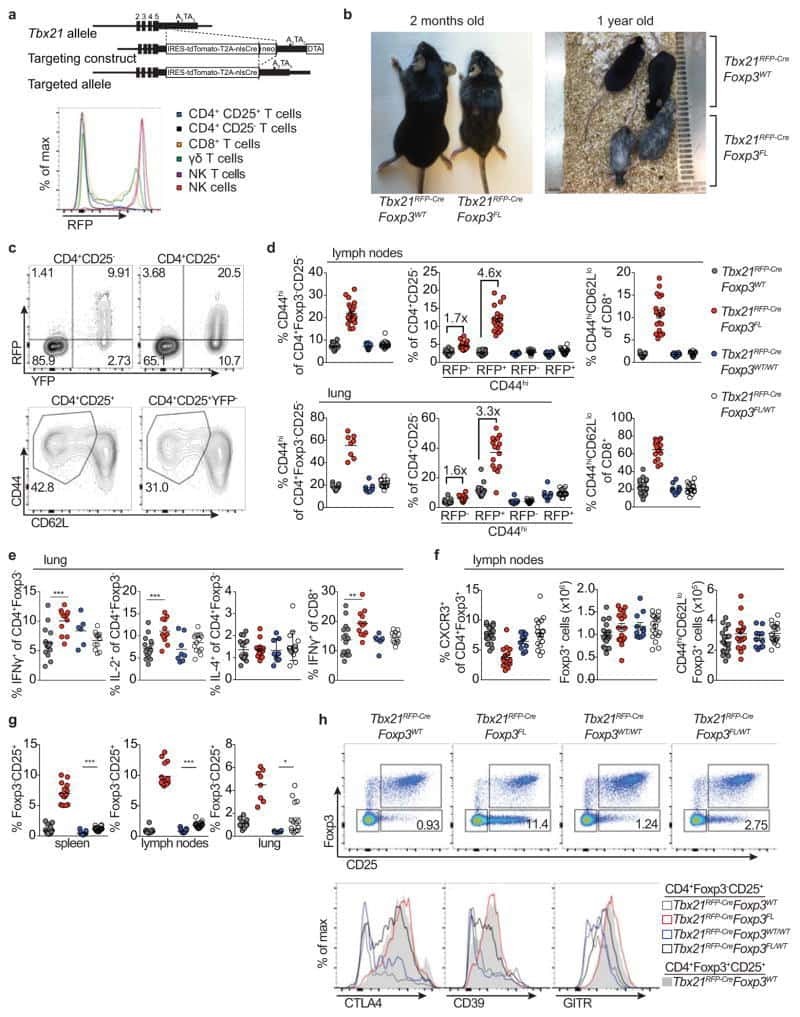
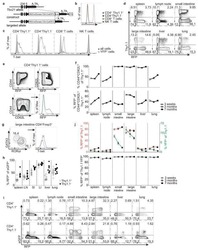
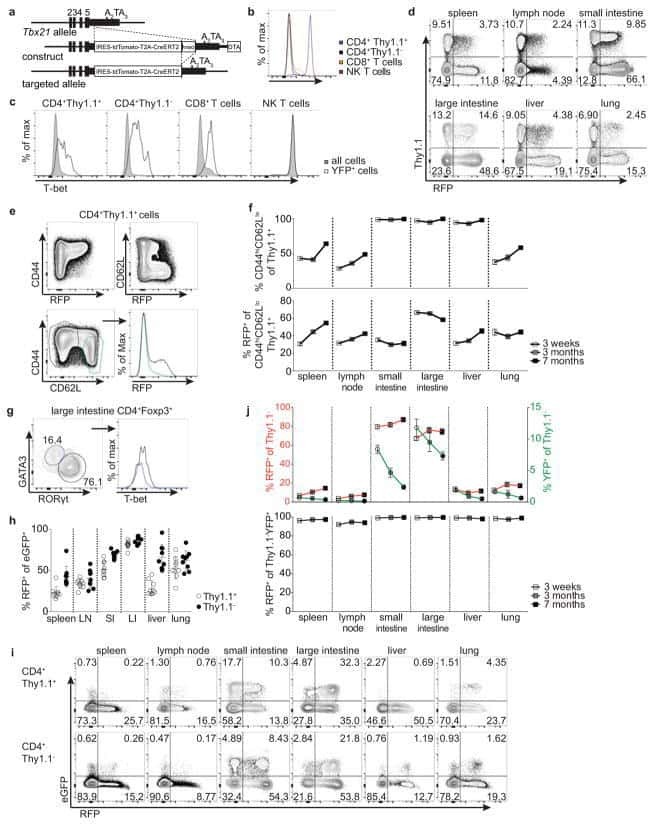
- Extended Data Figure 7 Distinguishing the drivers of autoimmunity in the absence of T-bet + Treg cells a,b , ex-Treg cells are no more pathogenic than effector CD4 T cells. a , CD4 + CD25 + (Treg) cells were sorted from lymph nodes of Tbx21 RFP-Cre Foxp3 WT mice, and CD4 + CD25 - (effector) and CD4 + CD25 lo (exTreg) cells were sorted from lymph nodes of Tbx21 RFP-Cre Foxp3 FL mice for transfer into Tcrb - / - Tcrd - / - mice. Intracellular staining for Foxp3 demonstrates purity of cell populations. b , Weights of Tcrb - / - Tcrd - / - mice receiving CD4 + CD25 + (white squares), CD4 + CD25 - (black squares), and CD4 + CD25 lo (gray squares) cells. c , Percentages and numbers of the indicated T cell populations in spleens of mice analyzed on d62 post transfer. d,e , T-bet + effector alphabetaT cells drive disease upon ablation of T-bet + Treg cells. Lethally irradiated Tcrb - / - Tcrd - / - mice were reconstituted with a 1:1 mix of CD45.2 + Tbx21 RFP-Cre/WT R26 iDTR T-cell depleted bone marrow cells with either CD45.1 + Foxp3 KO , CD45.1 + Foxp3 WT , or CD45.2 + Tcrb KO T-cell depleted bone marrow cells. Mice were injected with 0.5mug diphtheria toxin (DT) on day 0, then treated daily with 0.1mug DT for 22 days before analysis. d , Weight loss in Tbx21 RFP-Cre/WT R26 iDTR :Foxp3 KO (red line) vs. Tbx21 RFP-Cre/WT R26 iDTR :Foxp3 WT (black line) vs. Tbx21 RFP-Cre/WT R26 iDTR :Tcrb KO (blue line) reconstituted mice. e , Representative fl
- Submitted by
- Invitrogen Antibodies (provider)
- Main image

- Experimental details
- Figure 4. Duodenal infection leads to a compartmentalized immune conflict in the duodenal gLNs and to compromised oral tolerance. a , Dissected gLNs from non-infected (N.I.) C57BL/6 mice or mice infected with 700 S. venezuelensis (S.v.) larvae 8 days prior to harvest. b , Total CD45 + cell counts ( n =5, represents 3 independent experiments). c-f , Frequency of CD103 + CD11b - ( c ), CD103 + CD11b + ( d ) and CD103 - CD11b + ( e ) among MHCII hi CD11c + cells and eosinophils among CD45 + cells ( f ) ( n =5, represents 2 independent experiments). g , Representative flow cytometry plot of GATA3 + and FOXP3 + CD4 + T cells. h , Frequency of GATA3 + CD4 + T cells ( n =5, represents 3 independent experiments). i , Frequency of total FOXP3 + among CD45.1 + cells in gLNs 64 h post adoptive transfer of 1 x 10 6 naive CD45.1 + OT-II cells into CD45.2 mice ( n =8, pool of 2 independent experiments) infected with S.v. larvae or N.I. 8 days and gavaged with OVA 48 h and 24 h prior to analysis. j , Scheme of oral tolerance experimental set-up in S.v. infected mice. k - m , Total eosinophils in bronchoalveolar lavage fluid (BALF) ( k ), frequency of eosinophils among CD45 + cells in lung tissue ( l ) and OVA-specific IgG1 levels in serum ( m ) from mice infected with S.v. or N.I. during antigen feeding (+OVA groups) or no feeding (-OVA groups), at 21 d after first immunization with OVA-alum ( j ) ( n =13 for +OVA groups, n =10 for -OVA groups, pool of 2 independent experiments). LN abbrevi

- Submitted by
- Invitrogen Antibodies (provider)
- Main image
- Experimental details
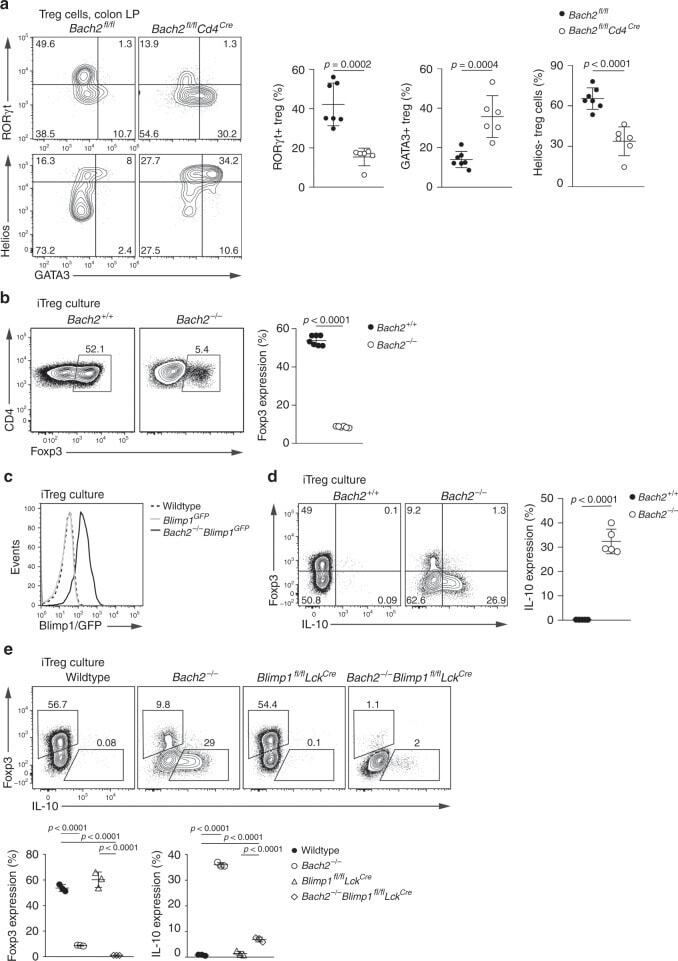
- Fig. 4 Bach2 is intrinsically required for pTreg cell differentiation. a Flow cytometry plots and quantification showing GATA3, RORgammat and Helios expression by Treg cells from the colonic lamina propria of Bach2 fl/fl Cd4 Cre and control mice. b Flow cytometry plots showing Foxp3 expression by wildtype and Bach2 -/- CD4 T cells after three days in Treg cell-inducing culture conditions, and frequency of Foxp3-expressing cells (right). c Histograms showing Blimp1-GFP expression by Blimp1 GFP and Bach2 -/- Blimp1 GFP CD4 T cells after culture in Treg cell-inducing conditions. Dashed line indicates background fluorescence levels in non-reporter cells. d Flow cytometry plots showing Foxp3 and IL-10 expression by wildtype and Bach2 -/- CD4 T cells after Treg cell-inducing culture, and quantification (right). e Flow cytometry plots showing Foxp3 expression by wildtype, Bach2 -/- , Blimp1 fl/fl Lck Cre and Bach2 -/- Blimp1 fl/fl Lck Cre after three days culture in Treg cell-inducing conditions, and frequency of Foxp3 and IL-10 expressing cells (below). Flow cytometry plots are representative, data pooled from ( a ) or representative of two ( c - e ) or six ( b ) independent experiments. Statistical significance tested using two-way ANOVA with Tukey's test ( e ). Otherwise, significance was tested using the unpaired Student's t- test. Error bars denote mean +- S.D. Source data are provided as a Source Data file.