 Explore
 Validate
 Learn
Learn14-3249-82
antibody from Invitrogen Antibodies
Targeting: CDH1
CD324, UVO, uvomorulin
 Western blot
 ELISA Immunocytochemistry Immunoprecipitation Immunohistochemistry Flow cytometry Other assay
Antibody data
- Antibody Data
- Antigen structure
- References [46]
- Comments [0]
- Validations
- Western blot [1]
- Immunocytochemistry [1]
- Other assay [37]
Submit
Validation data
Reference
Comment
Report error
- Product number
- 14-3249-82 - Provider product page

- Provider
- Invitrogen Antibodies
- Product name
- CD324 (E-Cadherin) Monoclonal Antibody (DECMA-1), eBioscience™
- Antibody type
- Monoclonal
- Antigen
- Other
- Description
- Description: The monoclonal antibody DECMA-1 recognizes mouse, human and canine CD324 also known as E-cadherin (Epithelial cadherin) or uvomorulin. Like the other cadherin family members P and N cadherin, E-cadherin is a transmembrane glycoprotein involved in intercellular adhesion. These proteins share a common basic structure. The extracellular portions of the proteins are largely composed of repeating domains, each with two consensus Ca2+-binding motifs. The cytoplasmic domain interacts with a-, b-, and g-catenins and actinins. These catenins connect E-cadherin with the cytoskeleton. Expression is found in most epidermal cells including melanocytes and kerotinocytes. E-cadherin is localized at the intercellular boundaries of epithelial cells in several tissues, and is thought to play a role in maintenance of tissue integrity. Loss of E-cadherin function has been implicated in the progression of a variety of cancers. E-Cadherin protein is sensitive to trypsin treatment, so exposure to trypsin should be minimized or avoided. The monoclonal antibody DECMA-1 has been shown to have functional activity by disrupting adhesion in human, mouse and dog cells. Applications Reported: This DECMA-1 antibody has been reported for use in flow cytometric analysis, immunoprecipitation, western blotting, immunohistochemical staining of frozen tissue sections, and ELISA. (Please use Functional Grade purified DECMA-1, Product # 16-3249-85 , in functional assays). Applications Tested: This DECMA-1 antibody has been tested by western blot analysis of EDTA treated MDCK cell line. This can be used at less than or equal to 2 µg/mL. It is recommended that the antibody be carefully titrated for optimal performance in the assay of interest. Purity: Greater than 90%, as determined by SDS-PAGE. Aggregation: Less than 10%, as determined by HPLC. Filtration: 0.2 µm post-manufacturing filtered.
- Reactivity
- Human, Mouse, Canine
- Host
- Rat
- Isotype
- IgG
- Antibody clone number
- DECMA-1
- Vial size
- 100 µg
- Concentration
- 0.5 mg/mL
- Storage
- 4° C
Submitted references Antagonizing STK25 Signaling Suppresses the Development of Hepatocellular Carcinoma Through Targeting Metabolic, Inflammatory, and Pro-Oncogenic Pathways.
CMTM5 inhibits the development of prostate cancer via the EGFR/PI3K/AKT signaling pathway.
Low-Dose Albendazole Inhibits Epithelial-Mesenchymal Transition of Melanoma Cells by Enhancing Phosphorylated GSK-3β/Tyr216 Accumulation.
Human Adipose-Derived Mesenchymal Stem Cells Ameliorate Elastase-Induced Emphysema in Mice by Mesenchymal-Epithelial Transition.
Efficient Messenger RNA Delivery to the Kidney Using Renal Pelvis Injection in Mice.
EGFR Transgene Stimulates Spontaneous Formation of MCF7 Breast Cancer Cells Spheroids with Partly Loss of HER3 Receptor.
Opposing effects of Wnt/β-catenin signaling on epithelial and mesenchymal cell fate in the developing cochlea.
Crosstalk between E-Cadherin/β-Catenin and NF-κB Signaling Pathways: The Regulation of Host-Pathogen Interaction during Leptospirosis.
MicroRNA-384 inhibits nasopharyngeal carcinoma growth and metastasis via binding to Smad5 and suppressing the Wnt/β-catenin axis.
Multiscale analysis of single and double maternal-zygotic Myh9 and Myh10 mutants during mouse preimplantation development.
Leptin Modulates the Metastasis of Canine Inflammatory Mammary Adenocarcinoma Cells Through Downregulation of Lysosomal Protective Protein Cathepsin A (CTSA).
Shigella flexneri Disruption of Cellular Tension Promotes Intercellular Spread.
Genome-wide CRISPR screen identifies noncanonical NF-κB signaling as a regulator of density-dependent proliferation.
Epithelial Vegfa Specifies a Distinct Endothelial Population in the Mouse Lung.
GDNF drives rapid tubule morphogenesis in a novel 3D in vitro model for ADPKD.
Heterotypic cell-cell communication regulates glandular stem cell multipotency.
Mechanisms of stretch-mediated skin expansion at single-cell resolution.
Fsp1-Mediated Lineage Tracing Fails to Detect the Majority of Disseminating Cells Undergoing EMT.
Coordinated removal of repressive epigenetic modifications during induced reversal of cell identity.
Defining Reprogramming Checkpoints from Single-Cell Analyses of Induced Pluripotency.
Pluripotency reprogramming by competent and incompetent POU factors uncovers temporal dependency for Oct4 and Sox2.
Caspase-11 regulates the tumour suppressor function of STAT1 in a murine model of colitis-associated carcinogenesis.
β-Catenin maintains lung epithelial progenitors after lung specification.
Early lineage segregation of multipotent embryonic mammary gland progenitors.
Differential requirements of androgen receptor in luminal progenitors during prostate regeneration and tumor initiation.
A Unifying Theory of Branching Morphogenesis.
Identity and dynamics of mammary stem cells during branching morphogenesis.
Constitutively Active SMAD2/3 Are Broad-Scope Potentiators of Transcription-Factor-Mediated Cellular Reprogramming.
Precision-cut Mouse Lung Slices to Visualize Live Pulmonary Dendritic Cells.
Alternative Routes to Induced Pluripotent Stem Cells Revealed by Reprogramming of the Neural Lineage.
Quantitative lineage tracing strategies to resolve multipotency in tissue-specific stem cells.
Tumour stroma-derived lipocalin-2 promotes breast cancer metastasis.
Epithelial-to-mesenchymal transition induces cell cycle arrest and parenchymal damage in renal fibrosis.
Reprogramming Roadblocks Are System Dependent.
Epithelial-to-mesenchymal transition is dispensable for metastasis but induces chemoresistance in pancreatic cancer.
Foxm1 regulates resolution of hyperoxic lung injury in newborns.
Quantifying Memory CD8 T Cells Reveals Regionalization of Immunosurveillance.
Differentiation of human induced pluripotent stem cells to mature functional Purkinje neurons.
Blocking the epithelial-to-mesenchymal transition pathway abrogates resistance to anti-folate chemotherapy in lung cancer.
Single luminal epithelial progenitors can generate prostate organoids in culture.
FGF2 mediates mouse spermatogonial stem cell self-renewal via upregulation of Etv5 and Bcl6b through MAP2K1 activation.
E-cadherin inhibits cell surface localization of the pro-migratory 5T4 oncofetal antigen in mouse embryonic stem cells.
Recruitment and activation of Rac1 by the formation of E-cadherin-mediated cell-cell adhesion sites.
Expression of the homotypic adhesion molecule E-cadherin by immature murine thymocytes and thymic epithelial cells.
E-cadherin is the major mediator of human melanocyte adhesion to keratinocytes in vitro.
Identification of a putative cell adhesion domain of uvomorulin.
Kurhe Y, Caputo M, Cansby E, Xia Y, Kumari S, Anand SK, Howell BW, Marschall HU, Mahlapuu M
Cellular and molecular gastroenterology and hepatology 2022;13(2):405-423
Cellular and molecular gastroenterology and hepatology 2022;13(2):405-423
CMTM5 inhibits the development of prostate cancer via the EGFR/PI3K/AKT signaling pathway.
Li L, Hu Y, Chen D, Zhu J, Bao W, Xu X, Chen H, Chen W, Feng R
Molecular medicine reports 2022 Jan;25(1)
Molecular medicine reports 2022 Jan;25(1)
Low-Dose Albendazole Inhibits Epithelial-Mesenchymal Transition of Melanoma Cells by Enhancing Phosphorylated GSK-3β/Tyr216 Accumulation.
He Z, Lei S, Liang F, Tan L, Zhang W, Xie L, Zheng H, Lu Y
Journal of oncology 2021;2021:4475192
Journal of oncology 2021;2021:4475192
Human Adipose-Derived Mesenchymal Stem Cells Ameliorate Elastase-Induced Emphysema in Mice by Mesenchymal-Epithelial Transition.
Fujioka N, Kitabatake M, Ouji-Sageshima N, Ibaraki T, Kumamoto M, Fujita Y, Hontsu S, Yamauchi M, Yoshikawa M, Muro S, Ito T
International journal of chronic obstructive pulmonary disease 2021;16:2783-2793
International journal of chronic obstructive pulmonary disease 2021;16:2783-2793
Efficient Messenger RNA Delivery to the Kidney Using Renal Pelvis Injection in Mice.
Oyama N, Kawaguchi M, Itaka K, Kawakami S
Pharmaceutics 2021 Oct 29;13(11)
Pharmaceutics 2021 Oct 29;13(11)
EGFR Transgene Stimulates Spontaneous Formation of MCF7 Breast Cancer Cells Spheroids with Partly Loss of HER3 Receptor.
Troitskaya O, Novak D, Nushtaeva A, Savinkova M, Varlamov M, Ermakov M, Richter V, Koval O
International journal of molecular sciences 2021 Nov 29;22(23)
International journal of molecular sciences 2021 Nov 29;22(23)
Opposing effects of Wnt/β-catenin signaling on epithelial and mesenchymal cell fate in the developing cochlea.
Billings SE, Myers NM, Quiruz L, Cheng AG
Development (Cambridge, England) 2021 Jun 1;148(11)
Development (Cambridge, England) 2021 Jun 1;148(11)
Crosstalk between E-Cadherin/β-Catenin and NF-κB Signaling Pathways: The Regulation of Host-Pathogen Interaction during Leptospirosis.
Hsu SH, Chou LF, Hong CH, Chang MY, Tsai CY, Tian YC, Yang HY, Yang CW
International journal of molecular sciences 2021 Dec 4;22(23)
International journal of molecular sciences 2021 Dec 4;22(23)
MicroRNA-384 inhibits nasopharyngeal carcinoma growth and metastasis via binding to Smad5 and suppressing the Wnt/β-catenin axis.
Zeng X, Liao H, Wang F
Cytotechnology 2021 Apr;73(2):203-215
Cytotechnology 2021 Apr;73(2):203-215
Multiscale analysis of single and double maternal-zygotic Myh9 and Myh10 mutants during mouse preimplantation development.
Schliffka MF, Tortorelli AF, Özgüç Ö, de Plater L, Polzer O, Pelzer D, Maître JL
eLife 2021 Apr 19;10
eLife 2021 Apr 19;10
Leptin Modulates the Metastasis of Canine Inflammatory Mammary Adenocarcinoma Cells Through Downregulation of Lysosomal Protective Protein Cathepsin A (CTSA).
Kim JW, Mahiddine FY, Kim GA
International journal of molecular sciences 2020 Nov 25;21(23)
International journal of molecular sciences 2020 Nov 25;21(23)
Shigella flexneri Disruption of Cellular Tension Promotes Intercellular Spread.
Duncan-Lowey JK, Wiscovitch AL, Wood TE, Goldberg MB, Russo BC
Cell reports 2020 Nov 24;33(8):108409
Cell reports 2020 Nov 24;33(8):108409
Genome-wide CRISPR screen identifies noncanonical NF-κB signaling as a regulator of density-dependent proliferation.
Fomicheva M, Macara IG
eLife 2020 Nov 13;9
eLife 2020 Nov 13;9
Epithelial Vegfa Specifies a Distinct Endothelial Population in the Mouse Lung.
Vila Ellis L, Cain MP, Hutchison V, Flodby P, Crandall ED, Borok Z, Zhou B, Ostrin EJ, Wythe JD, Chen J
Developmental cell 2020 Mar 9;52(5):617-630.e6
Developmental cell 2020 Mar 9;52(5):617-630.e6
GDNF drives rapid tubule morphogenesis in a novel 3D in vitro model for ADPKD.
Dixon EE, Maxim DS, Halperin Kuhns VL, Lane-Harris AC, Outeda P, Ewald AJ, Watnick TJ, Welling PA, Woodward OM
Journal of cell science 2020 Jul 16;133(14)
Journal of cell science 2020 Jul 16;133(14)
Heterotypic cell-cell communication regulates glandular stem cell multipotency.
Centonze A, Lin S, Tika E, Sifrim A, Fioramonti M, Malfait M, Song Y, Wuidart A, Van Herck J, Dannau A, Bouvencourt G, Dubois C, Dedoncker N, Sahay A, de Maertelaer V, Siebel CW, Van Keymeulen A, Voet T, Blanpain C
Nature 2020 Aug;584(7822):608-613
Nature 2020 Aug;584(7822):608-613
Mechanisms of stretch-mediated skin expansion at single-cell resolution.
Aragona M, Sifrim A, Malfait M, Song Y, Van Herck J, Dekoninck S, Gargouri S, Lapouge G, Swedlund B, Dubois C, Baatsen P, Vints K, Han S, Tissir F, Voet T, Simons BD, Blanpain C
Nature 2020 Aug;584(7820):268-273
Nature 2020 Aug;584(7820):268-273
Fsp1-Mediated Lineage Tracing Fails to Detect the Majority of Disseminating Cells Undergoing EMT.
Bornes L, van Scheppingen RH, Beerling E, Schelfhorst T, Ellenbroek SIJ, Seinstra D, van Rheenen J
Cell reports 2019 Nov 26;29(9):2565-2569.e3
Cell reports 2019 Nov 26;29(9):2565-2569.e3
Coordinated removal of repressive epigenetic modifications during induced reversal of cell identity.
Tran KA, Dillingham CM, Sridharan R
The EMBO journal 2019 Nov 15;38(22):e101681
The EMBO journal 2019 Nov 15;38(22):e101681
Defining Reprogramming Checkpoints from Single-Cell Analyses of Induced Pluripotency.
Tran KA, Pietrzak SJ, Zaidan NZ, Siahpirani AF, McCalla SG, Zhou AS, Iyer G, Roy S, Sridharan R
Cell reports 2019 May 7;27(6):1726-1741.e5
Cell reports 2019 May 7;27(6):1726-1741.e5
Pluripotency reprogramming by competent and incompetent POU factors uncovers temporal dependency for Oct4 and Sox2.
Malik V, Glaser LV, Zimmer D, Velychko S, Weng M, Holzner M, Arend M, Chen Y, Srivastava Y, Veerapandian V, Shah Z, Esteban MA, Wang H, Chen J, Schöler HR, Hutchins AP, Meijsing SH, Pott S, Jauch R
Nature communications 2019 Aug 2;10(1):3477
Nature communications 2019 Aug 2;10(1):3477
Caspase-11 regulates the tumour suppressor function of STAT1 in a murine model of colitis-associated carcinogenesis.
Flood B, Manils J, Nulty C, Flis E, Kenealy S, Barber G, Fay J, Mills KHG, Kay EW, Creagh EM
Oncogene 2019 Apr;38(14):2658-2674
Oncogene 2019 Apr;38(14):2658-2674
β-Catenin maintains lung epithelial progenitors after lung specification.
Ostrin EJ, Little DR, Gerner-Mauro KN, Sumner EA, Ríos-Corzo R, Ambrosio E, Holt SE, Forcioli-Conti N, Akiyama H, Hanash SM, Kimura S, Huang SXL, Chen J
Development (Cambridge, England) 2018 Mar 9;145(5)
Development (Cambridge, England) 2018 Mar 9;145(5)
Early lineage segregation of multipotent embryonic mammary gland progenitors.
Wuidart A, Sifrim A, Fioramonti M, Matsumura S, Brisebarre A, Brown D, Centonze A, Dannau A, Dubois C, Van Keymeulen A, Voet T, Blanpain C
Nature cell biology 2018 Jun;20(6):666-676
Nature cell biology 2018 Jun;20(6):666-676
Differential requirements of androgen receptor in luminal progenitors during prostate regeneration and tumor initiation.
Chua CW, Epsi NJ, Leung EY, Xuan S, Lei M, Li BI, Bergren SK, Hibshoosh H, Mitrofanova A, Shen MM
eLife 2018 Jan 15;7
eLife 2018 Jan 15;7
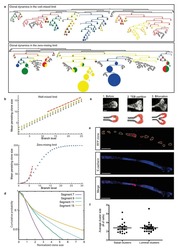
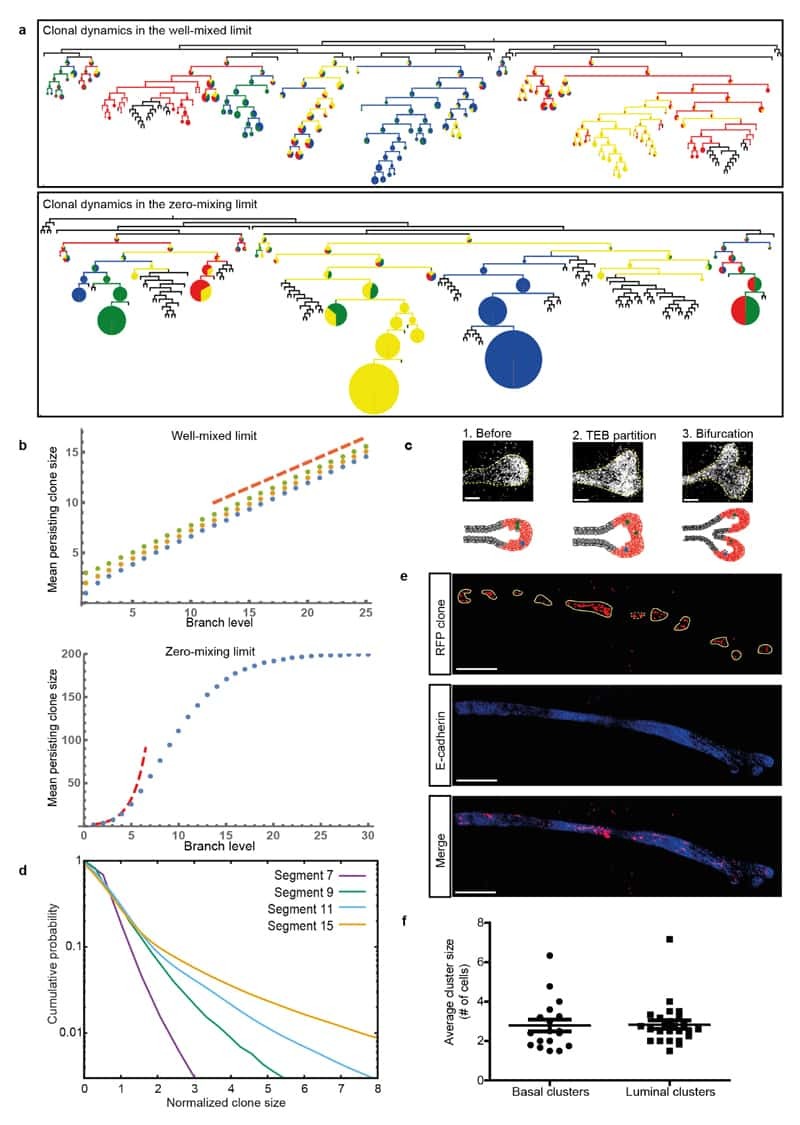
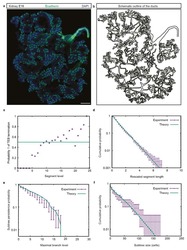
A Unifying Theory of Branching Morphogenesis.
Hannezo E, Scheele CLGJ, Moad M, Drogo N, Heer R, Sampogna RV, van Rheenen J, Simons BD
Cell 2017 Sep 21;171(1):242-255.e27
Cell 2017 Sep 21;171(1):242-255.e27
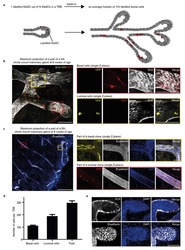
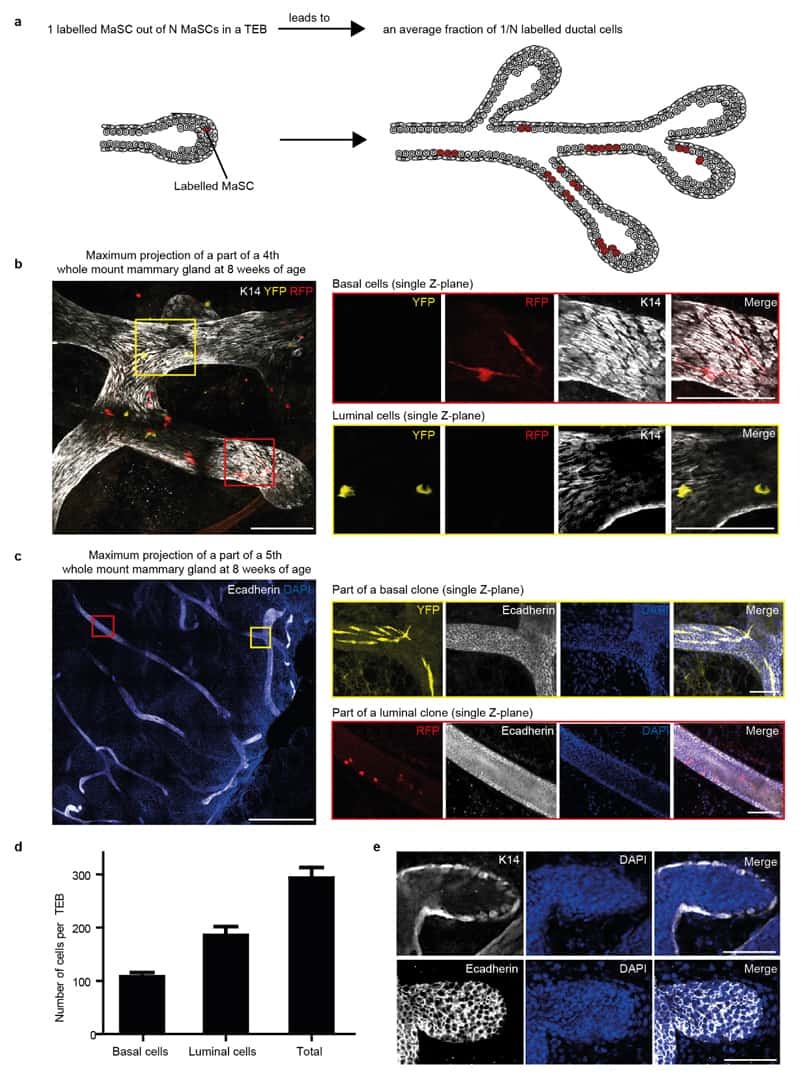
Identity and dynamics of mammary stem cells during branching morphogenesis.
Scheele CL, Hannezo E, Muraro MJ, Zomer A, Langedijk NS, van Oudenaarden A, Simons BD, van Rheenen J
Nature 2017 Feb 16;542(7641):313-317
Nature 2017 Feb 16;542(7641):313-317
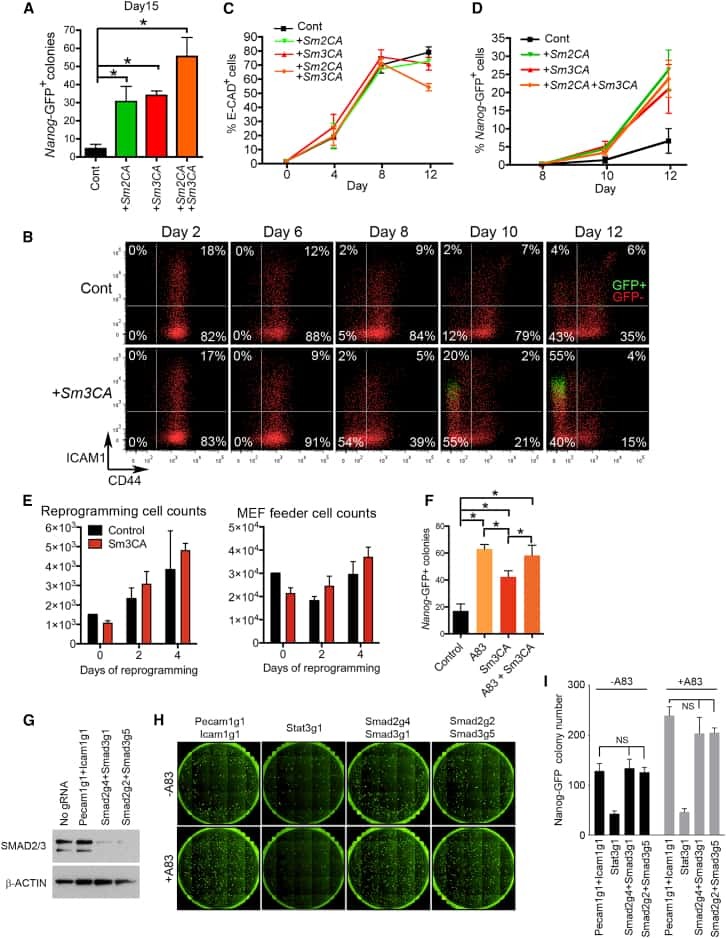
Constitutively Active SMAD2/3 Are Broad-Scope Potentiators of Transcription-Factor-Mediated Cellular Reprogramming.
Ruetz T, Pfisterer U, Di Stefano B, Ashmore J, Beniazza M, Tian TV, Kaemena DF, Tosti L, Tan W, Manning JR, Chantzoura E, Ottosson DR, Collombet S, Johnsson A, Cohen E, Yusa K, Linnarsson S, Graf T, Parmar M, Kaji K
Cell stem cell 2017 Dec 7;21(6):791-805.e9
Cell stem cell 2017 Dec 7;21(6):791-805.e9
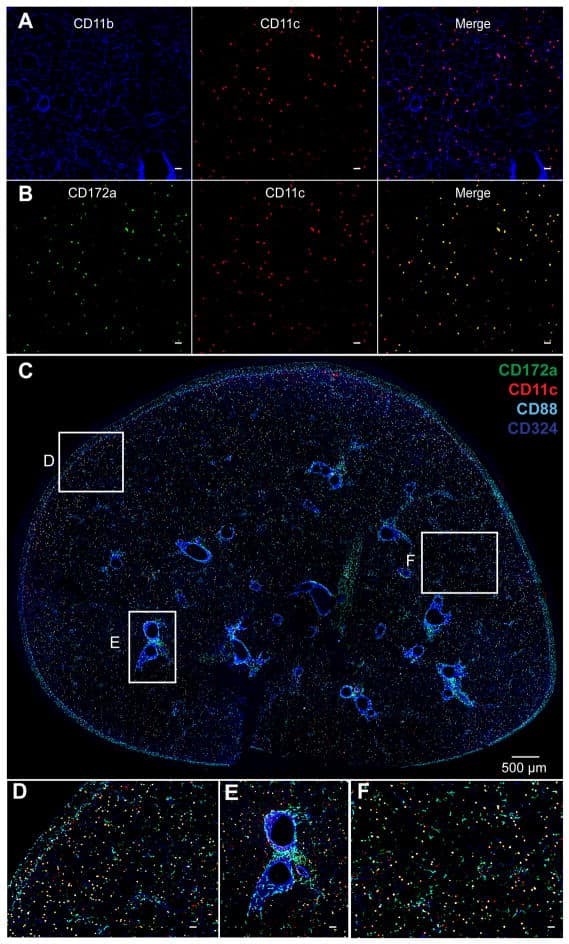
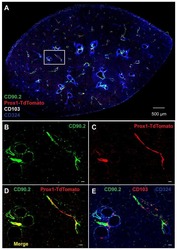
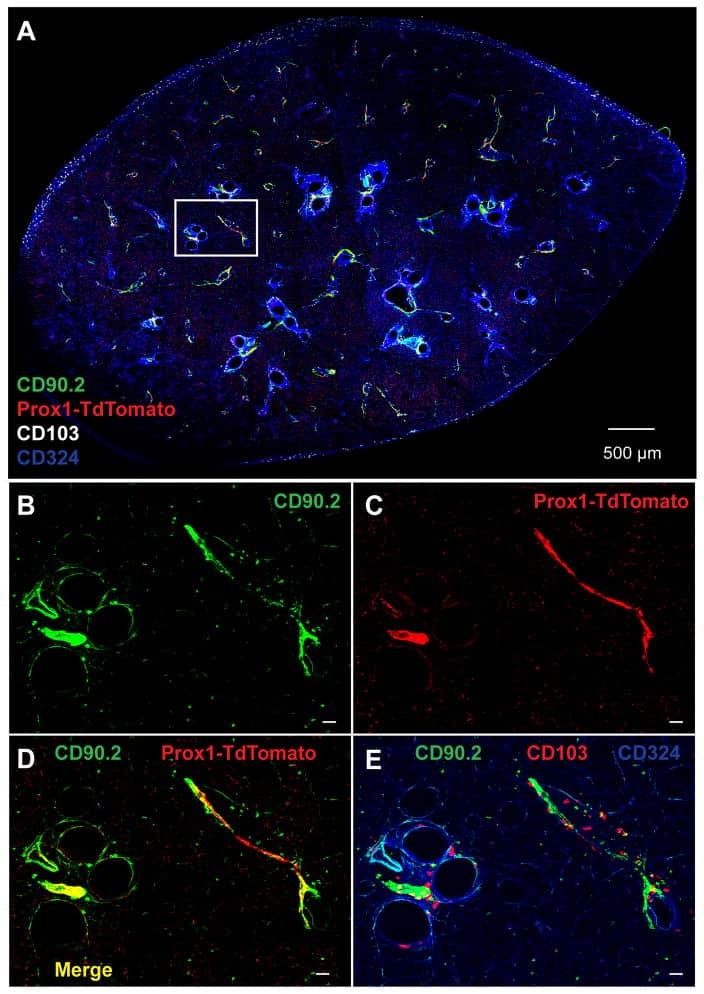
Precision-cut Mouse Lung Slices to Visualize Live Pulmonary Dendritic Cells.
Lyons-Cohen MR, Thomas SY, Cook DN, Nakano H
Journal of visualized experiments : JoVE 2017 Apr 5;(122)
Journal of visualized experiments : JoVE 2017 Apr 5;(122)
Alternative Routes to Induced Pluripotent Stem Cells Revealed by Reprogramming of the Neural Lineage.
Jackson SA, Olufs ZP, Tran KA, Zaidan NZ, Sridharan R
Stem cell reports 2016 Mar 8;6(3):302-11
Stem cell reports 2016 Mar 8;6(3):302-11
Quantitative lineage tracing strategies to resolve multipotency in tissue-specific stem cells.
Wuidart A, Ousset M, Rulands S, Simons BD, Van Keymeulen A, Blanpain C
Genes & development 2016 Jun 1;30(11):1261-77
Genes & development 2016 Jun 1;30(11):1261-77
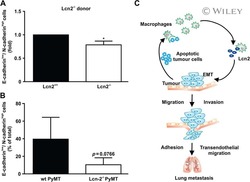
Tumour stroma-derived lipocalin-2 promotes breast cancer metastasis.
Ören B, Urosevic J, Mertens C, Mora J, Guiu M, Gomis RR, Weigert A, Schmid T, Grein S, Brüne B, Jung M
The Journal of pathology 2016 Jul;239(3):274-85
The Journal of pathology 2016 Jul;239(3):274-85
Epithelial-to-mesenchymal transition induces cell cycle arrest and parenchymal damage in renal fibrosis.
Lovisa S, LeBleu VS, Tampe B, Sugimoto H, Vadnagara K, Carstens JL, Wu CC, Hagos Y, Burckhardt BC, Pentcheva-Hoang T, Nischal H, Allison JP, Zeisberg M, Kalluri R
Nature medicine 2015 Sep;21(9):998-1009
Nature medicine 2015 Sep;21(9):998-1009
Reprogramming Roadblocks Are System Dependent.
Chantzoura E, Skylaki S, Menendez S, Kim SI, Johnsson A, Linnarsson S, Woltjen K, Chambers I, Kaji K
Stem cell reports 2015 Sep 8;5(3):350-64
Stem cell reports 2015 Sep 8;5(3):350-64
Epithelial-to-mesenchymal transition is dispensable for metastasis but induces chemoresistance in pancreatic cancer.
Zheng X, Carstens JL, Kim J, Scheible M, Kaye J, Sugimoto H, Wu CC, LeBleu VS, Kalluri R
Nature 2015 Nov 26;527(7579):525-530
Nature 2015 Nov 26;527(7579):525-530
Foxm1 regulates resolution of hyperoxic lung injury in newborns.
Xia H, Ren X, Bolte CS, Ustiyan V, Zhang Y, Shah TA, Kalin TV, Whitsett JA, Kalinichenko VV
American journal of respiratory cell and molecular biology 2015 May;52(5):611-21
American journal of respiratory cell and molecular biology 2015 May;52(5):611-21
Quantifying Memory CD8 T Cells Reveals Regionalization of Immunosurveillance.
Steinert EM, Schenkel JM, Fraser KA, Beura LK, Manlove LS, Igyártó BZ, Southern PJ, Masopust D
Cell 2015 May 7;161(4):737-49
Cell 2015 May 7;161(4):737-49
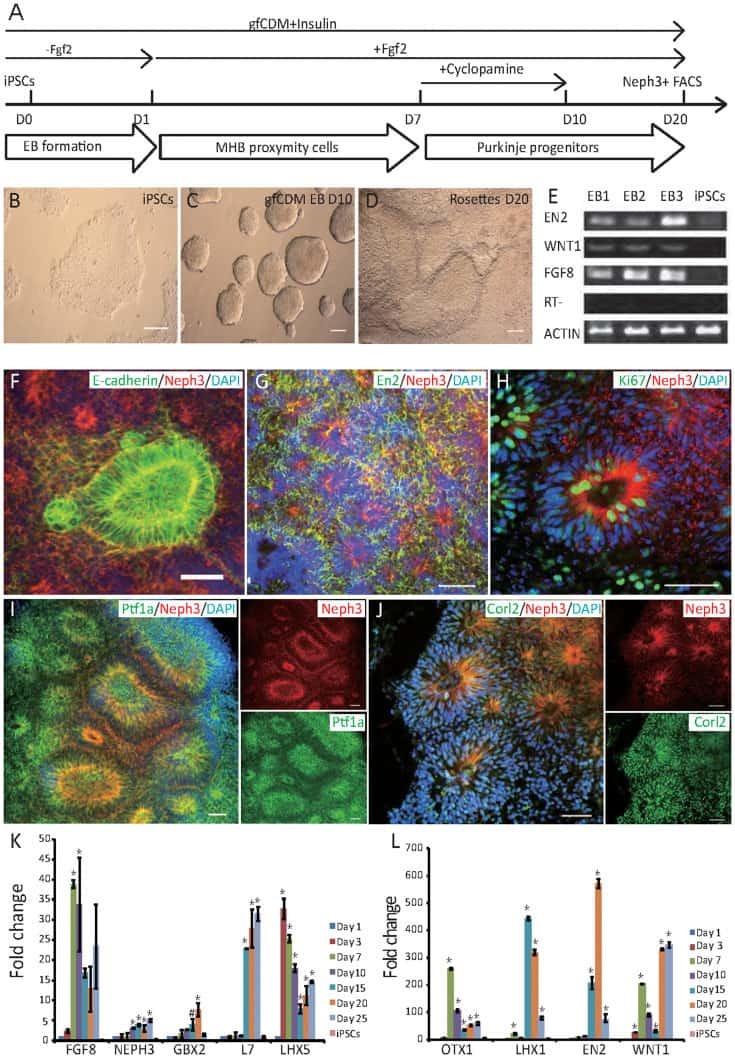
Differentiation of human induced pluripotent stem cells to mature functional Purkinje neurons.
Wang S, Wang B, Pan N, Fu L, Wang C, Song G, An J, Liu Z, Zhu W, Guan Y, Xu ZQ, Chan P, Chen Z, Zhang YA
Scientific reports 2015 Mar 18;5:9232
Scientific reports 2015 Mar 18;5:9232
Blocking the epithelial-to-mesenchymal transition pathway abrogates resistance to anti-folate chemotherapy in lung cancer.
Liang SQ, Marti TM, Dorn P, Froment L, Hall SR, Berezowska S, Kocher G, Schmid RA, Peng RW
Cell death & disease 2015 Jul 16;6(7):e1824
Cell death & disease 2015 Jul 16;6(7):e1824
Single luminal epithelial progenitors can generate prostate organoids in culture.
Chua CW, Shibata M, Lei M, Toivanen R, Barlow LJ, Bergren SK, Badani KK, McKiernan JM, Benson MC, Hibshoosh H, Shen MM
Nature cell biology 2014 Oct;16(10):951-61, 1-4
Nature cell biology 2014 Oct;16(10):951-61, 1-4
FGF2 mediates mouse spermatogonial stem cell self-renewal via upregulation of Etv5 and Bcl6b through MAP2K1 activation.
Ishii K, Kanatsu-Shinohara M, Toyokuni S, Shinohara T
Development (Cambridge, England) 2012 May;139(10):1734-43
Development (Cambridge, England) 2012 May;139(10):1734-43
E-cadherin inhibits cell surface localization of the pro-migratory 5T4 oncofetal antigen in mouse embryonic stem cells.
Spencer HL, Eastham AM, Merry CL, Southgate TD, Perez-Campo F, Soncin F, Ritson S, Kemler R, Stern PL, Ward CM
Molecular biology of the cell 2007 Aug;18(8):2838-51
Molecular biology of the cell 2007 Aug;18(8):2838-51
Recruitment and activation of Rac1 by the formation of E-cadherin-mediated cell-cell adhesion sites.
Nakagawa M, Fukata M, Yamaga M, Itoh N, Kaibuchi K
Journal of cell science 2001 May;114(Pt 10):1829-38
Journal of cell science 2001 May;114(Pt 10):1829-38
Expression of the homotypic adhesion molecule E-cadherin by immature murine thymocytes and thymic epithelial cells.
Lee MG, Sharrow SO, Farr AG, Singer A, Udey MC
Journal of immunology (Baltimore, Md. : 1950) 1994 Jun 15;152(12):5653-9
Journal of immunology (Baltimore, Md. : 1950) 1994 Jun 15;152(12):5653-9
E-cadherin is the major mediator of human melanocyte adhesion to keratinocytes in vitro.
Tang A, Eller MS, Hara M, Yaar M, Hirohashi S, Gilchrest BA
Journal of cell science 1994 Apr;107 ( Pt 4):983-92
Journal of cell science 1994 Apr;107 ( Pt 4):983-92
Identification of a putative cell adhesion domain of uvomorulin.
Vestweber D, Kemler R
The EMBO journal 1985 Dec 16;4(13A):3393-8
The EMBO journal 1985 Dec 16;4(13A):3393-8
No comments: Submit comment
Supportive validation
- Submitted by
- Invitrogen Antibodies (provider)
- Main image
- Experimental details
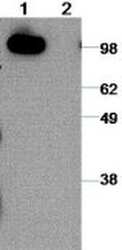
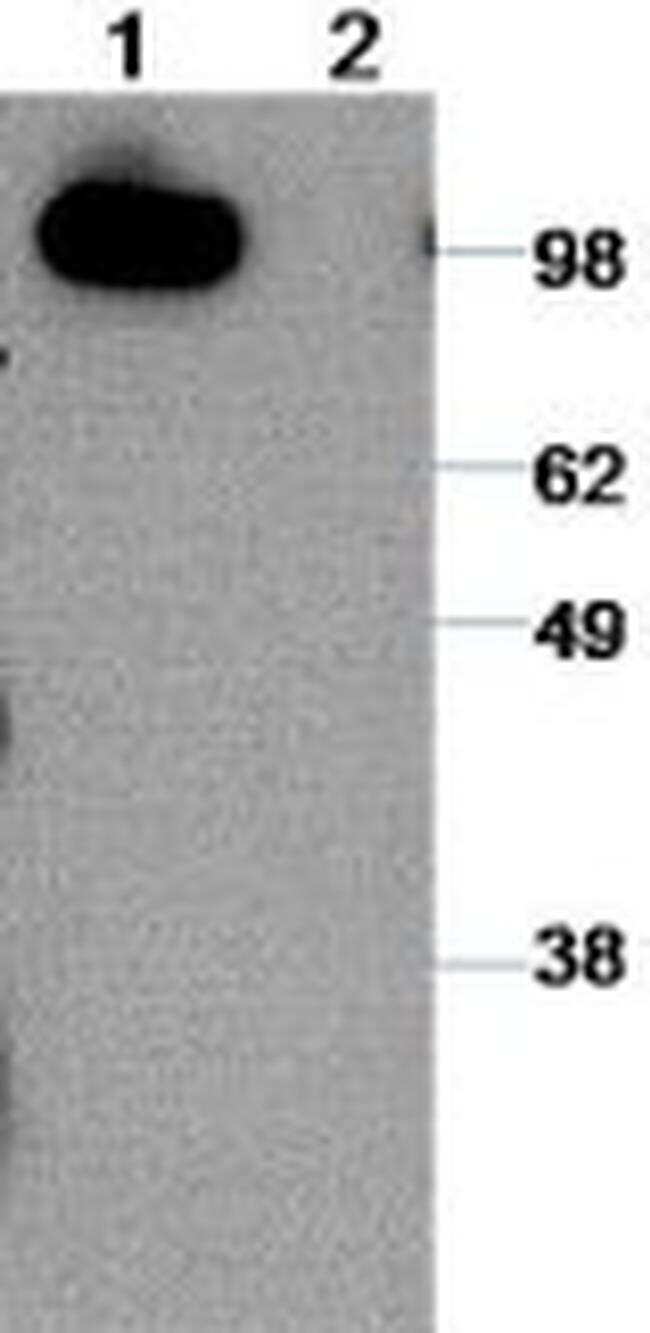
- Immunoblot analysis of reduced MDCK cell line lysates with 2 µg/mL of Anti-Human CD324 (E-Cadherin) Purified and revealed with Anti-Rat IgG HRP. Lane 1: EDTA treated cells and Lane 2: Trypsin treated cells to remove from tissue culture dish.
Supportive validation
- Submitted by
- Invitrogen Antibodies (provider)
- Main image

- Experimental details
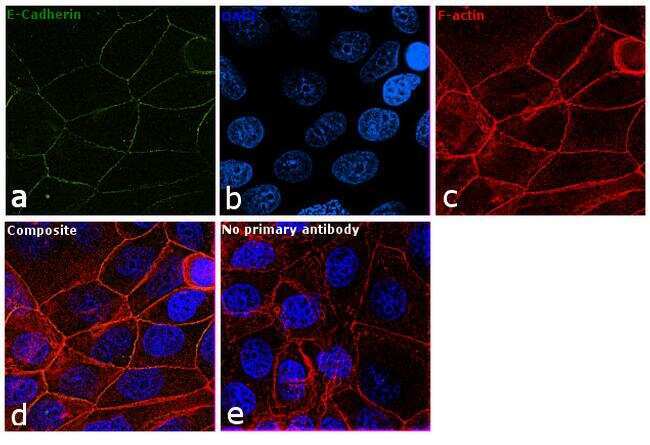
- Immunofluorescence analysis of E-cadherin was performed using 90% confluent log phase MCF7 cells. The cells were fixed with 4% paraformaldehyde for 10 minutes, permeabilized with 0.1% Triton™ X-100 for 15 minutes, and blocked with 1% BSA for 1 hour at room temperature. The cells were labeled with CD324 (E-Cadherin) Monoclonal Antibody (DECMA-1) (Product # 14-3249-82) at 5 µg/mL in 0.1% BSA, incubated at 4 degree Celsius overnight and then labeled with Goat anti-Rat IgG (H+L) Superclonal™ Secondary Antibody, Alexa Fluor® 488 conjugate (Product # A-11006) at a dilution of 1:2000 for 45 minutes at room temperature (Panel a: green). Nuclei (Panel b: blue) were stained with SlowFade® Gold Antifade Mountant with DAPI (Product # S36938). F-actin (Panel c: red) was stained with Rhodamine Phalloidin (Product # R415, 1:300). Panel d represents the merged image showing plasma membrane localization. Panel e represents control cells with no primary antibody to assess background. The images were captured at 60X magnification.
Supportive validation
- Submitted by
- Invitrogen Antibodies (provider)
- Main image

- Experimental details
- NULL
- Submitted by
- Invitrogen Antibodies (provider)
- Main image

- Experimental details
- NULL
- Submitted by
- Invitrogen Antibodies (provider)
- Main image
- Experimental details
- NULL
- Submitted by
- Invitrogen Antibodies (provider)
- Main image
- Experimental details
- NULL
- Submitted by
- Invitrogen Antibodies (provider)
- Main image
- Experimental details
- NULL
- Submitted by
- Invitrogen Antibodies (provider)
- Main image
- Experimental details
- NULL

- Submitted by
- Invitrogen Antibodies (provider)
- Main image
- Experimental details
- NULL
- Submitted by
- Invitrogen Antibodies (provider)
- Main image

- Experimental details
- NULL
- Submitted by
- Invitrogen Antibodies (provider)
- Main image
- Experimental details
- NULL
- Submitted by
- Invitrogen Antibodies (provider)
- Main image
- Experimental details
- NULL
- Submitted by
- Invitrogen Antibodies (provider)
- Main image
- Experimental details
- NULL

- Submitted by
- Invitrogen Antibodies (provider)
- Main image
- Experimental details
- NULL
- Submitted by
- Invitrogen Antibodies (provider)
- Main image
- Experimental details
- NULL
- Submitted by
- Invitrogen Antibodies (provider)
- Main image
- Experimental details
- NULL
- Submitted by
- Invitrogen Antibodies (provider)
- Main image
- Experimental details
- NULL
- Submitted by
- Invitrogen Antibodies (provider)
- Main image
- Experimental details
- NULL

- Submitted by
- Invitrogen Antibodies (provider)
- Main image
- Experimental details
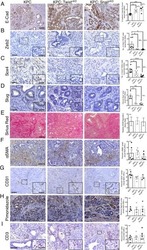
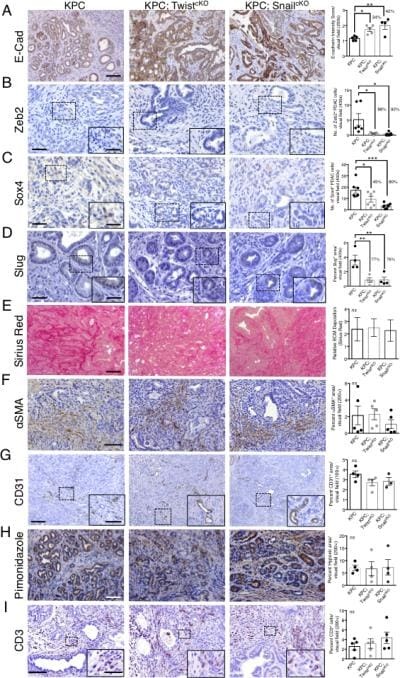
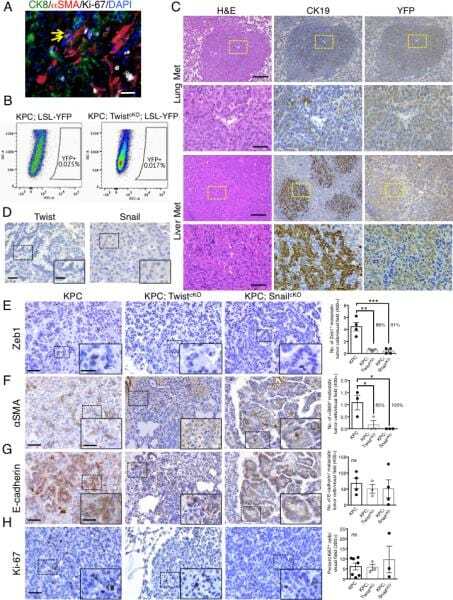
- Extended Figure 2 A E-Cadherin immunolabeling and quantification of primary KPC (n = 5 mice), KPC; Twist cKO (n = 5 mice) and KPC; Snail cKO (n = 4 mice) (scale, 100 mum). B Zeb2 immunolabeling and quantification of primary KPC (n = 6 mice), KPC; Twist cKO (n = 5 mice) and KPC; Snail cKO (n = 7 mice) (scale, 50 mum; inset scale, 20 mum). C Sox4 immunolabeling and quantification of primary KPC (n = 7 mice), KPC; Twist cKO (n = 6 mice) and KPC; Snail cKO (n = 8 mice) (scale, 50 mum; inset scale, 20 mum). D Slug immunolabeling and quantification of primary KPC (n = 4 mice), KPC; Twist cKO (n = 4 mice) and KPC; Snail cKO (n = 4 mice) tumors (scale, 50 mum; inset scale, 20 mum). E Sirius Red staining and quantification of primary KPC (n = 21 mice), KPC;Twist cKO (n = 8 mice) and KPC;Snail cKO (n = 11 mice) (scale, 200 mum; s.d.) F alphaSMA immunolabeling and quantification of primary KPC (n = 5 mice), KPC;Twist cKO (n = 5 mice) and KPC;Snail cKO (n = 5 mice) (scale, 100 mum). G CD31 immunolabeling and quantification of primary KPC (n = 4 mice), KPC;Twist cKO (n = 4 mice) and KPC;Snail cKO (n = 3 mice) (scale, 200 mum, inset scale, 100 mum). H Pimonidazole staining and quantification of primary KPC (n = 4 mice), KPC; Twist cKO (n = 4 mice) and KPC; Snail cKO (n = 4 mice) (scale, 100 mum). I CD3 immunolabeling and quantification of primary KPC (n = 5 mice), KPC;Twist cKO (n = 5 mice) and KPC;Snail cKO (n = 5 mice) (scale, 100 mum; inset scale, 25 mum). Unless otherwise indicated err
- Submitted by
- Invitrogen Antibodies (provider)
- Main image
- Experimental details
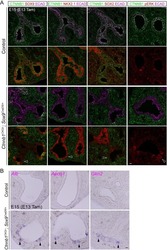
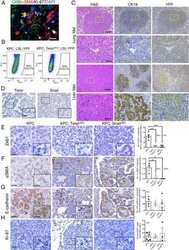
- Extended Figure 3 A Immunolabeling of primary tumors (n = 3 mice) for alphaSMA (red), CK8 (green), Ki-67 (white) and DAPI (blue); yellow arrows point to EMT + cells (scale, 20 mum). B Representative dot plots of circulating YFP + cells. C Images of serial sections of KPC; LSL-YFP lung and liver metastasis stained for H&E or immunolabeled for CK19 or YFP. Yellow dashed box represents magnified areas in panel below (scale, 200 mum; magnification scale, 100 mum). D KPC metastatic tumors stained for Twist and Snail (n = 3 mice; scale, 50 mum; inset scale, 20 mum). E Zeb1 immunolabeling and quantification of metastatic KPC (n = 4 mice), KPC; Twist cKO (n = 3 mice) and KPC; Snail cKO (n = 4 mice) (scale, 50 mum; inset scale, 20 mum). F alphaSMA immunolabeling and quantification of metastatic KPC (n = 3 mice), KPC; Twist cKO (n = 3 mice) and KPC; Snail cKO (n = 3 mice) (scale, 50 mum; inset scale, 20 mum). G E-Cadherin staining on serial sections of alphaSMA immunolabeling and quantification of metastatic KPC (n = 4 mice), KPC; Twist cKO (n = 3 mice) and KPC; Snail cKO (n = 4 mice) (scale, 50 mum; inset scale, 20 mum). H Ki-67 immunolabeling and quantification of metastatic KPC (n = 7 mice), KPC; Twist cKO (n = 3 mice) and KPC; Snail cKO (n = 3 mice) (scale, 50 mum). Unless otherwise indicated error bars represent s.e.m, percentages indicated represent percent decrease from control, and significance determined by One-way ANOVA. * P
- Submitted by
- Invitrogen Antibodies (provider)
- Main image

- Experimental details
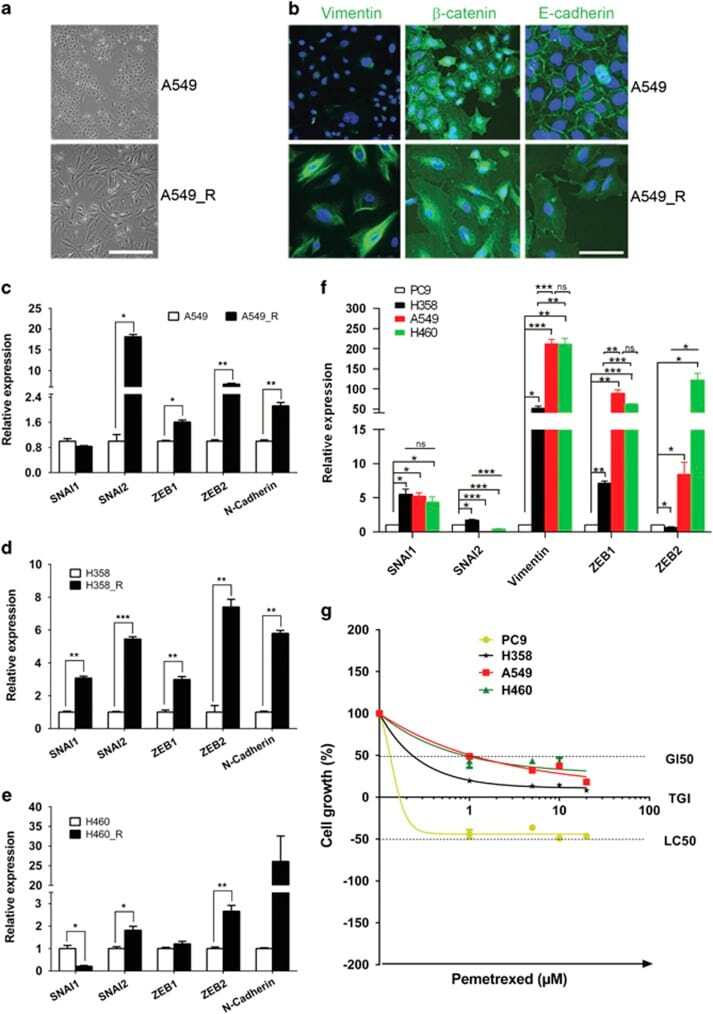
- Figure 2 Chemoresistant NSCLC cells exhibit an activated EMT pathway. ( a ) Morphological images of chemoresistant A549_R and parental A549 cells. Scale bar, 100 mu m. ( b ) A549_R and A549 cells were immunostained for Vimentin, beta -catenin and E-cadherin (green). Nuclei were counterstained with DAPI (blue). Scale bar, 25 mu m ( c-e ) mRNA levels of EMT-TFs and CDH2/N-cadherin in A549_R, H358_R and H460_R cells and the corresponding parental cells (A549, H358 and H460) were analyzed by qPCR. Data are shown as mean+-S.D. of three independent experiments ( n =3). ( f ) Different NSCLC cells are at distinct stages along the EMT. mRNA levels of EMT-TFs and Vimentin in PC9, H358, A549 and H460 cells were analyzed by qPCR and results are shown in mean+-S.D. of three independent experiments ( n =3). ( g ) NSCLC cells at distinct EMT stages exhibit differential sensitivity to MTA. PC9, H358, A549 and H460 cells treated with the indicated MTA doses for 5 days were analyzed by XTT assay. The results are shown as mean+-S.D. of triplicate experiments. * P
- Submitted by
- Invitrogen Antibodies (provider)
- Main image
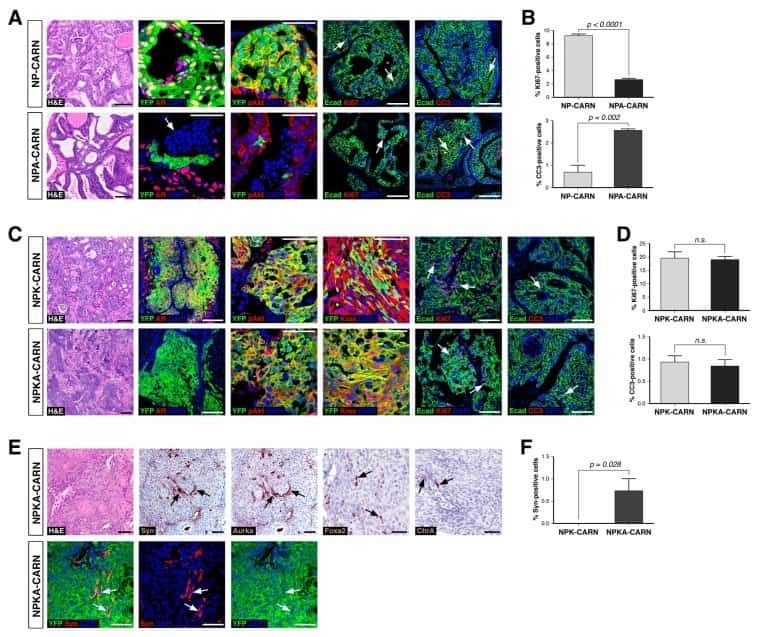
- Experimental details
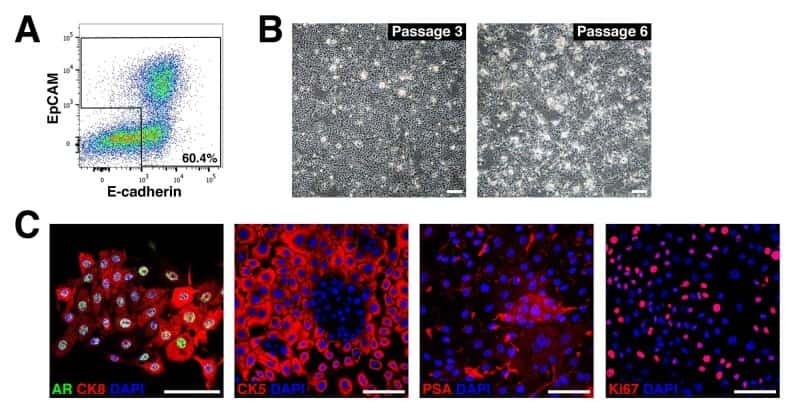
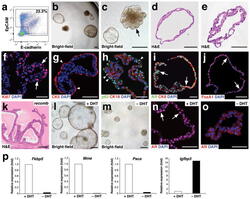
- Figure 2 Growth and androgen-responsiveness of prostate organoids from normal prostate epithelium. ( a ) Flow-sorting strategy to eliminate EpCAM - E-cadherin - cells from dissociated prostate tissue for organoid culture. ( b ) Low-power view of organoids at 20 days after plating, showing heterogeneity of phenotype. ( c ) Higher-power view showing hollow and filled budding organoid (arrow). ( d,e ) H&E staining of sections from a hollow organoid ( d ) and a multi-layered organoid ( e ). ( f ) Many proliferating cells are detectable by Ki67 immunostaining (arrows). ( g ) Organoids have an outer layer that expresses the basal marker CK5 (arrowheads). ( h ) Outer cells express the basal marker p63 (arrowheads), while interior cells are positive for the luminal marker CK18. ( i ) Nuclear immunostaining of AR (arrows) in organoids cultured in standard conditions with DHT. ( j ) Nuclear immunostaining for Foxa1 (arrows). ( k ) Tissue recombination of normal organoids with rat embryonic urogenital mesenchyme followed by renal grafting results in reconstitution of prostate tissue. ( l,m ) Organoids at passage 4 were passaged as single-cell suspensions and plated in the presence of DHT ( l ) or absence of DHT ( m ). ( n,o ) Strong nuclear AR immunostaining in the presence of DHT ( n ) and weak cytoplasmic AR immunostaining in the absence of DHT ( o ). ( p ) qPCR analysis of expression of AR downstream genes in organoids cultured in the presence or absence of DHT. Results are from a si

- Submitted by
- Invitrogen Antibodies (provider)
- Main image
- Experimental details
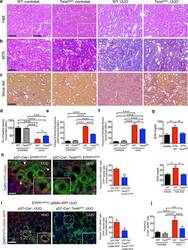
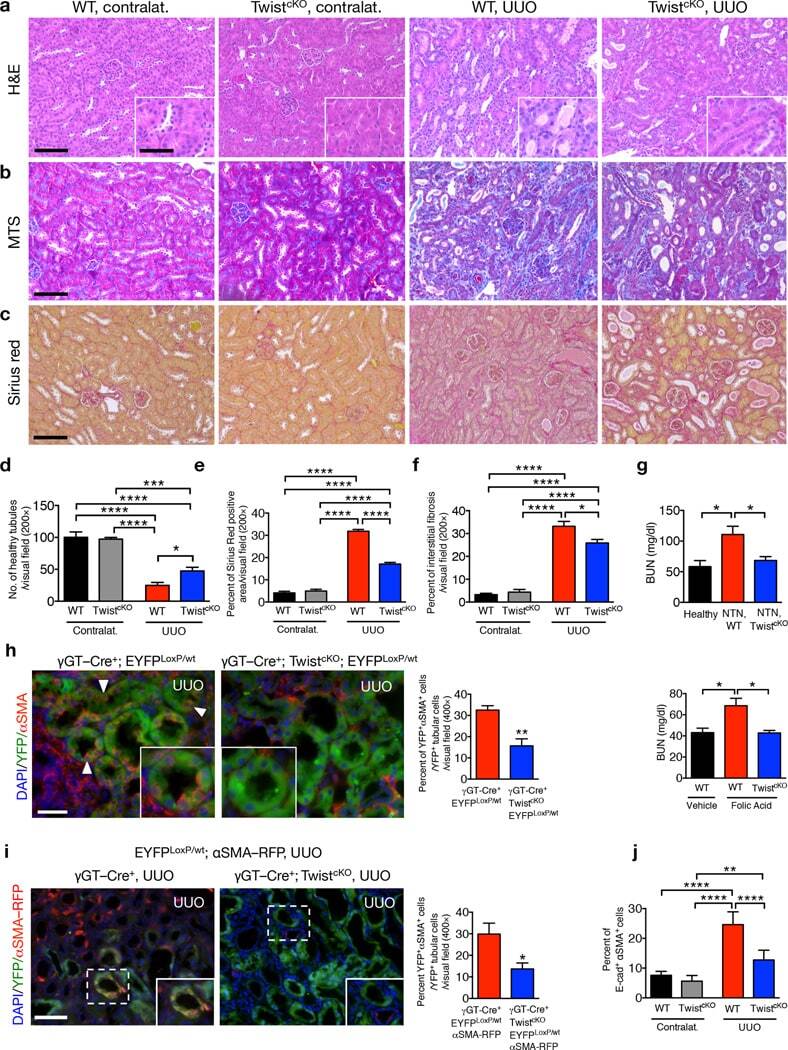
- Figure 1 Genetic targeting of EMT reduces renal fibrosis and improves tubular health. ( a-c ) Representative images (8 visual fields for each tissue analyzed) of H&E ( a ), MTS ( b ) and Sirius Red ( c ) staining of kidneys from the indicated experimental groups. Scale bar, 100 ~m; insert, 25 ~m. ( d ) Number of healthy tubules. WT contralat., n = 4; Twist cKO contralat., n = 3; WT UUO, n = 9; Twist cKO UUO, n = 9. ( e-f ) Interstitial fibrosis, based on MTS ( e ) and Sirius Red ( f ) staining. WT contralat., n = 4; Twist cKO contralat., n = 4; WT UUO, n = 9; Twist cKO UUO, n = 9. ( g ) Blood urea nitrogen (BUN) levels. Healthy, n = 3; WT NTN, n = 7; Twist cKO NTN; n = 7. WT vehicle, n = 4; WT FA, n = 4; Twist cKO FA, n = 4. ( h ) Representative images (8 visual fields for each tissue analyzed) of immunolabeling for alphaSMA and YFP (left) and quantification of the percent YFP + alphaSMA + cells per total number of YFP + tubular epithelial cells (right). WT UUO, n = 3; Twist cKO UUO, n = 4. Scale bar, 20 ~m. White arrowheads, YFP + /alphaSMA + cells. ( i ) Representative images (3 visual fields for each tissue analyzed) of YFP + proximal tubules and alphaSMA-RFP + myofibroblasts in UUO-treated mice (left) and quantification of the percent of YFP + RFP + cells (right). gammaGT-Cre; LSL -EYFP LoxP/+ ; alphaSMA-RFP, n = 3; gammaGT-Cre; LSL -EYFP LoxP/+ ; alphaSMA-RFP; Twist cKO , n = 4. Scale bar, 20 ~m. ( j ) Percent E-cadherin + alphaSMA + cells (as measured by flow cytometry)
- Submitted by
- Invitrogen Antibodies (provider)
- Main image
- Experimental details
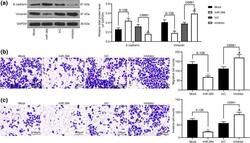
- Fig. 3 miR-384 mimic inhibits EMT, migration and invasion of NPC cells. a levels of mesenchyme marker protein Vimentin and epithelium-marker protein E-cadherin in cells measured by western blot analysis; b , c number of migrated ( b ) and invaded ( c ) cells determined by Transwell assays. Data are exhibited as mean +- SD from three independent experiments; in panel ( a ), data were analyzed using two-way ANOVA, while data in panels ( b ) and ( c ) were analyzed by one-way ANOVA, and Tukey''s multiple comparison test was used for the post-hoc test after ANOVA; * p < 0.05; ** p < 0.01 vs. the Mock group; # p < 0.05 vs. the InC group

- Submitted by
- Invitrogen Antibodies (provider)
- Main image
- Experimental details
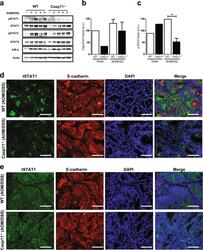
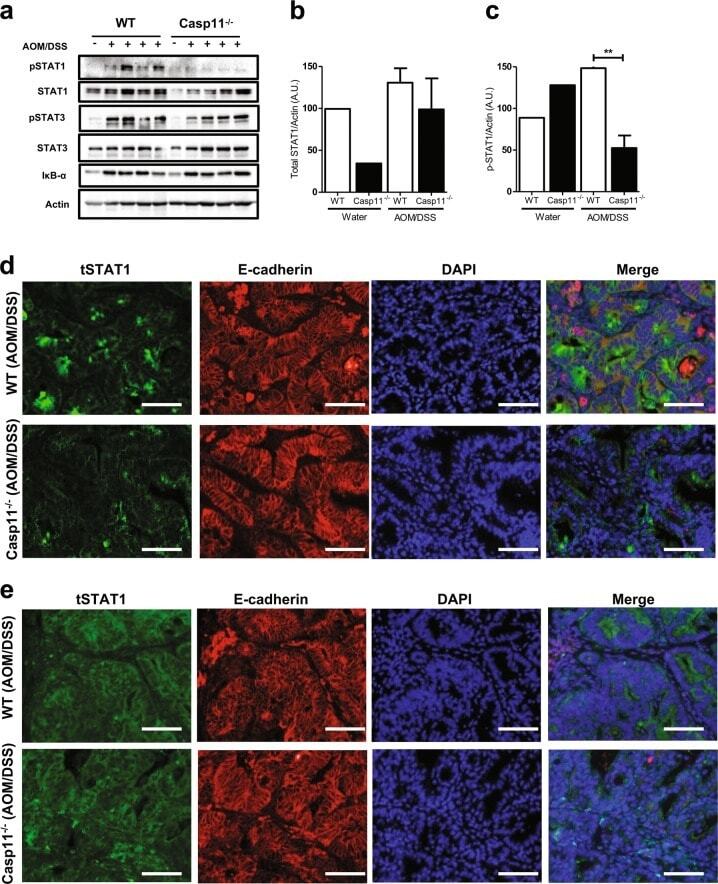
- Fig. 4 Caspase-11 mediates STAT1 activation during CAC. a Western blot analysis of phosho-/total STAT1, STAT3, IkappaBalpha, and actin (loading control) in colon homogenates from AOM/DSS-treated WT and Casp11 -/- mice on day 105 post initial AOM IP injection. Each lane represents an individual mouse. b Total STAT1 and c pSTAT1 expression densitometry (relative to actin) in colon homogenates from AOM/DSS-treated WT and Casp11 -/- mice. ** p < 0.01 (two-tailed unpaired t-test). Representative immunofluorescent images of d pSTAT1; and e total STAT1; co-stained for the epithelial marker E-cadherin (red) and DAPI (blue) in distal colon sections from AOM/DSS-treated WT and Casp11 -/- mice at day 105 (scale bar = 20 mum)
- Submitted by
- Invitrogen Antibodies (provider)
- Main image

- Experimental details
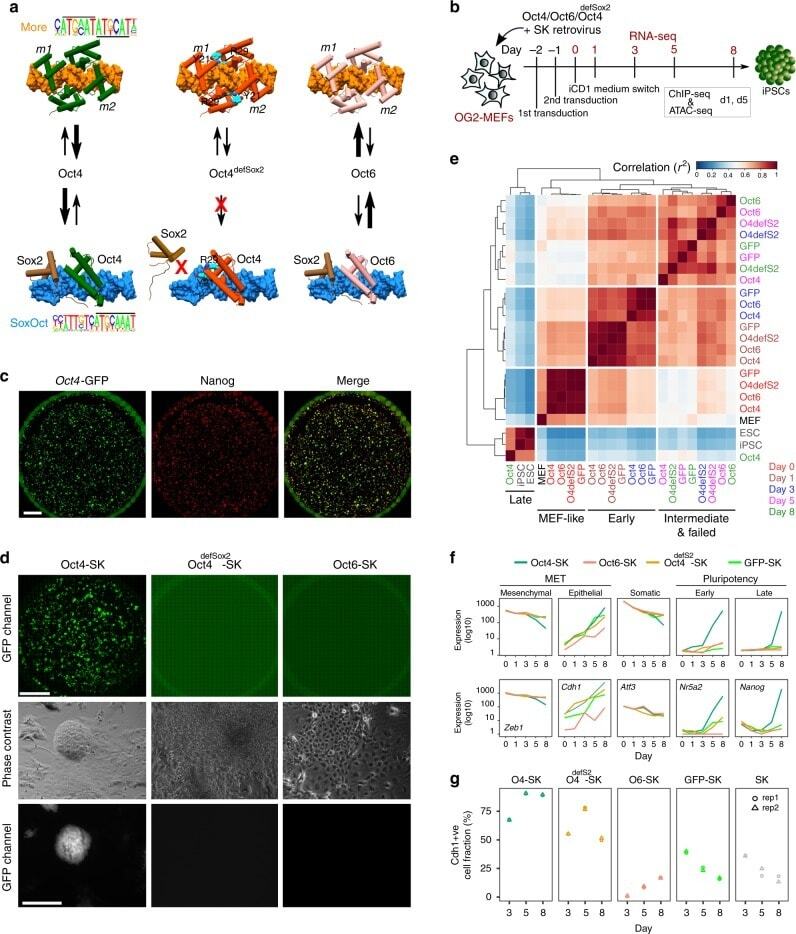
- Fig. 1 Reprogramming trajectories of cocktails containing Oct4, Oct6, Oct4 defSox2 , or GFP in chemically defined medium. a The cartoons represent the preferences of the POU proteins for the DNA-dependent homodimerization on MORE versus heterodimerization with Sox2 on SoxOct elements determined using quantitative biochemical assays . MORE DNA is shown in orange and SoxOct DNA in blue; m1 is monomer 1 and m2 is monomer2. The thickness of the arrows illustrates the DNA binding preferences. b Experimental design of reprogramming and RNA-seq, ATAC-seq, and ChIP-seq experiments. c Whole-well scans from a 6-well plate using GFP channel ( Oct4 -GFP), Nanog immunofluorescence and merged panels; for OG2-MEF cells reprogrammed with Oct4-SK at day 8; scale 5 mm. d Whole-well scans (upper panel) of wells from 12-well plate using GFP channel for three POU factors (Oct4, Oct4 defSox2 , and Oct6); scale 5 mm. Representative phase contrast (middle panel) and corresponding Oct4 -GFP fluorescence (lower panel) images of reprogramming experiments; time-point: day 8 post transduction; scale 200 mum. e Hierarchically clustered heatmap based on r2 correlation coefficients using RNA-seq reads as input. iPSCs and ESCs expression data are from GSE93029 . f Mean gene expression trajectories for indicated categories (upper panel) or a representative gene from each category (lower panel) in four reprogramming conditions. See Supplementary Fig. 1E for a larger panel of genes for each category. g Fraction
- Submitted by
- Invitrogen Antibodies (provider)
- Main image

- Experimental details
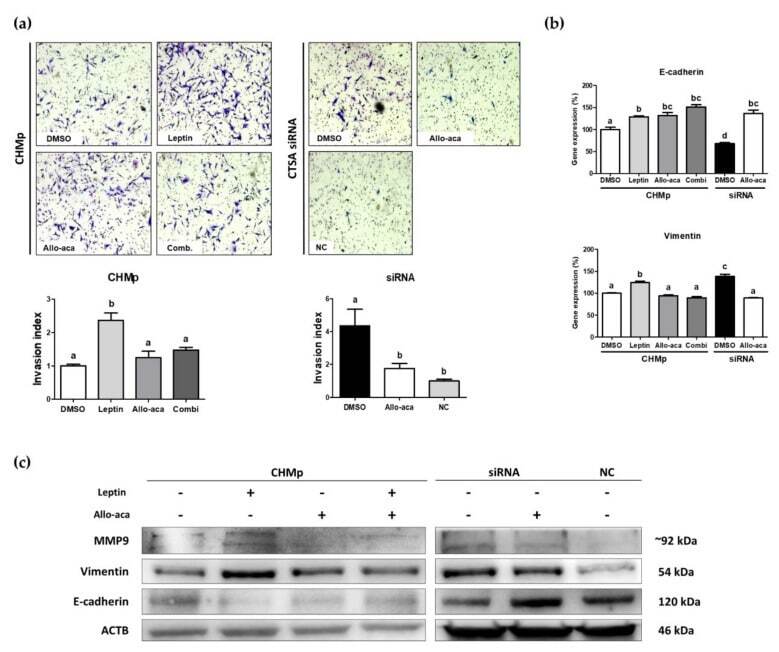
- Figure 3 Leptin stimulated epithelial-mesenchymal transition (EMT) in CHMp cells. ( a ) Matrigel invasion assay and calculated invasion index of CHMp and siRNA-transfected cells. Invaded cells were counted under light microscopy (40x) using ImageJ software. ( b ) Comparison of EMT-related gene ( E-cadherin and vimentin ) expression using real-time PCR analysis among experimental groups. ( c ) Western blot analysis of tumor invasion-related genes. All graphs are visualized as mean +- SEM with at least three replicates. The column bars with different alphabetical letters indicate significant difference among groups ( p < 0.05). Combi: combination of leptin and Allo-aca; NC: negative control siRNA.
- Submitted by
- Invitrogen Antibodies (provider)
- Main image
- Experimental details
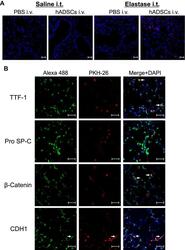
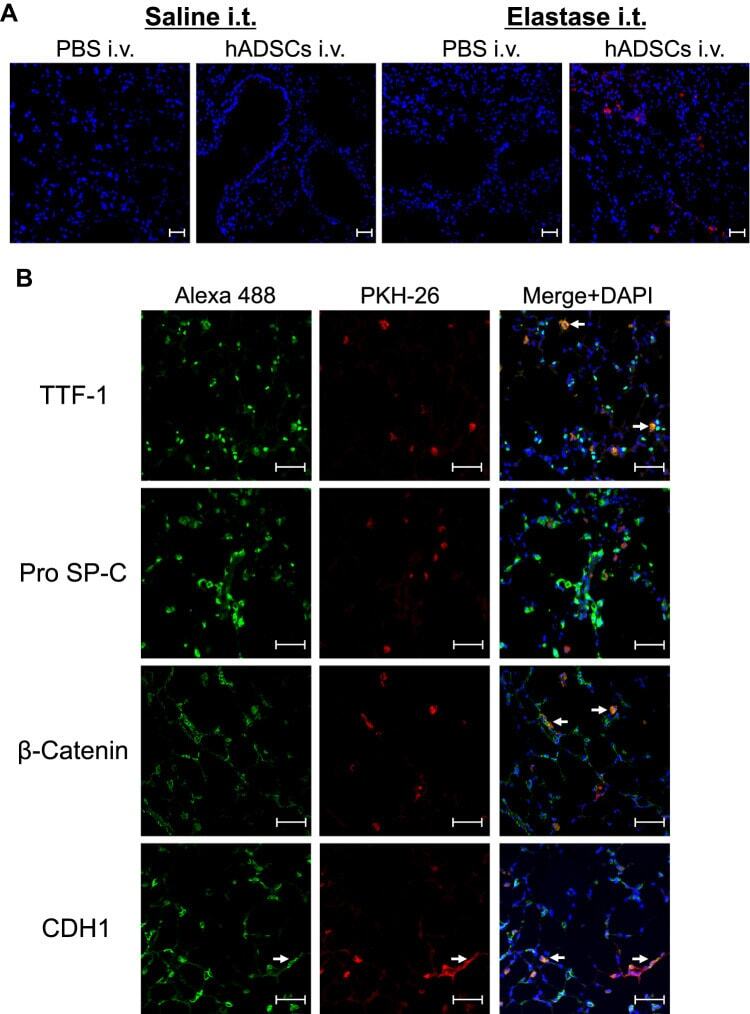
- Figure 4 Fluorescence staining of epithelial markers in the lungs. Notes: Lung sections from SCID-beige mice administered intravenously with PKH26-labeled hADSCs were observed under aconfocal laser microscope. ( A ) Fluorescence of PKH-26 (red) was observed with nuclear counterstaining by DAPI (blue) (x200). ( B ) Expression of epithelial cells markers TTF-1, Pro SP-C, beta-Catenin, and CDH1 visualized by Alexa Fluor 488 (green) in PKH26-labeled hADSCs (red) (x400). Arrow shows Alexa Flour 488 and PKH-26 merged cells. Scale bar shows 50 mum. Data are representative of more than three independent experiments. Abbreviations: hADSCs, human adipose-derived mesenchymal stem cells; DAPI, 4',6-diamidino-2-phenylindole; TTF-1, thyroid transcription factor-1; SP-C, surfactant protein C; CDH1, cadherin-1.
- Submitted by
- Invitrogen Antibodies (provider)
- Main image
- Experimental details
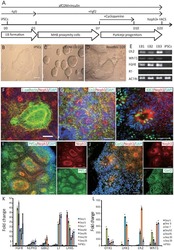
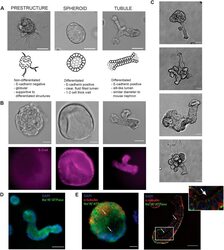
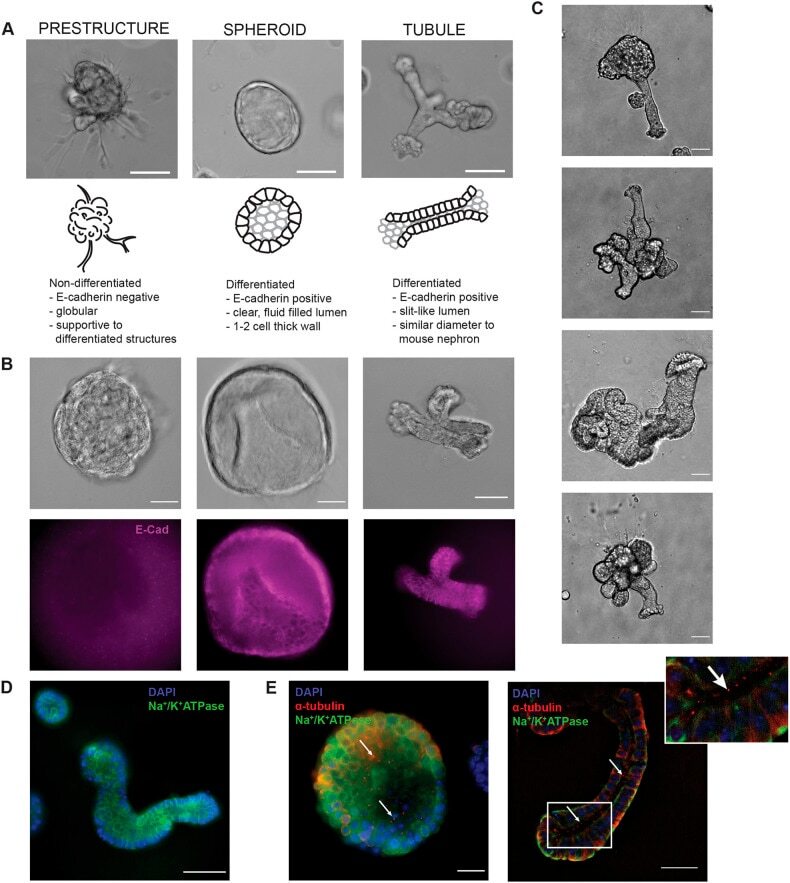
- Fig. 2. Characterization of unique 3D structures. (A) Representative bright-field image, schematic, and description for each class (prestructure, spheroid, and tubule) of organoid structures. Scale bars: 100 mum. (B) Bright-field images and corresponding immunofluorescence staining for E-cadherin (purple) in non-differentiated (E-cadherin negative; prestructures) and differentiated (E-cadherin positive; spheroids and tubules) structures. Scale bars: 50 mum. (C) Representative bright-field images of tubule development in the culture model. Tubules are often part of more complex 3D structures, including the globular, supportive prestructures. Scale bars: 25 mum. (D) Differentiated tubule structures demonstrate basolateral localization of Na + /K + -ATPase (green). Nuclei are stained with DAPI (blue). Scale bar: 50 mum. (E) Spheroids and tubules additionally demonstrate primary cilia, as indicated by acetyl-alpha-tubulin (red) puncta on the apical membrane. Basolateral Na + /K + -ATPase (green) and nuclear DAPI staining (blue) are also shown. Arrows indicate cilia, positively stained by acetyl-alpha-tubulin. Scale bars: 25 mum.
- Submitted by
- Invitrogen Antibodies (provider)
- Main image
- Experimental details
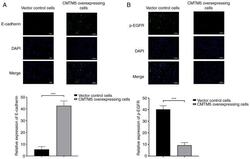
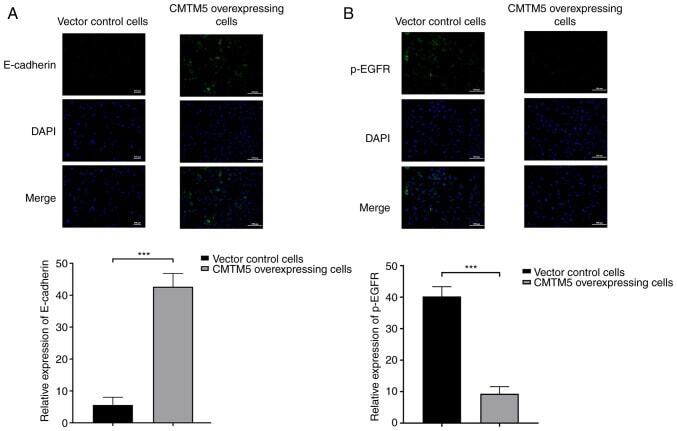
- Figure 4. Immunofluorescence analysis with DAPI staining on DU145 cells. (A) Expression of E-cadherin in CMTM5-overexpressing cells and vector control cells. (B) Expression of p-EGFR in CMTM5-overexpressing cells and vector control cells. Scale bar, 100 um. ***P
- Submitted by
- Invitrogen Antibodies (provider)
- Main image
- Experimental details
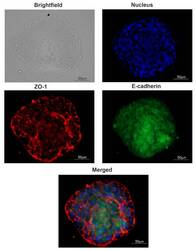
- Figure 4 Tight junction proteins distribution in spheroids. A typical image of a spheroid. The presence of junction markers zona occludens-1 (ZO-1) and E-cadherin were confirmed via immunofluorescent staining: red, ZO-1; green, E-cadherin; blue, nuclei (DAPI).
- Submitted by
- Invitrogen Antibodies (provider)
- Main image
- Experimental details
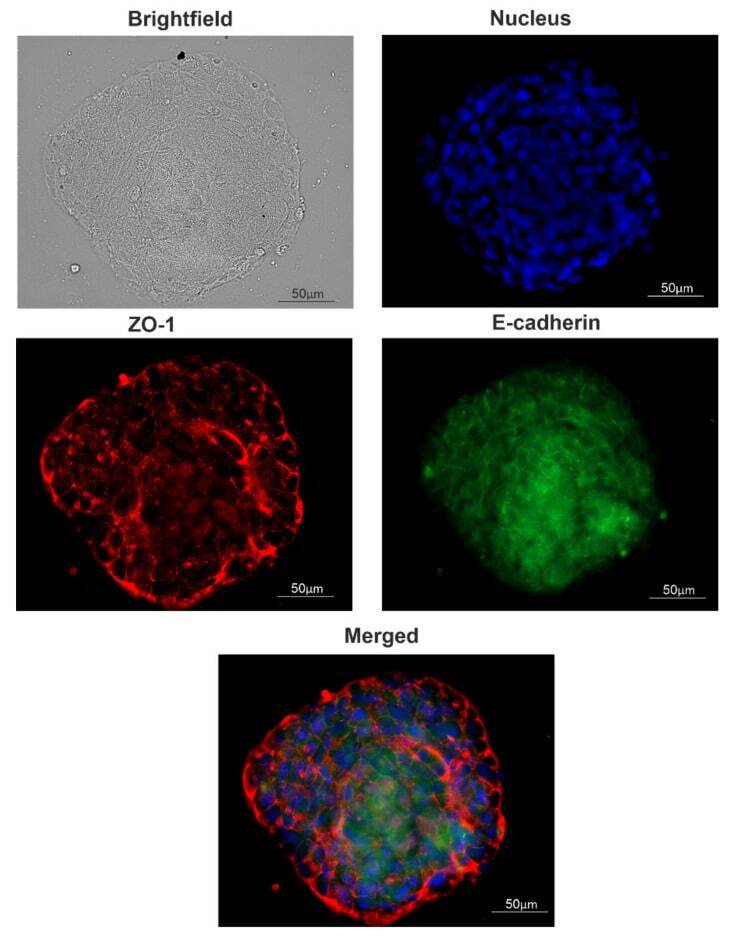
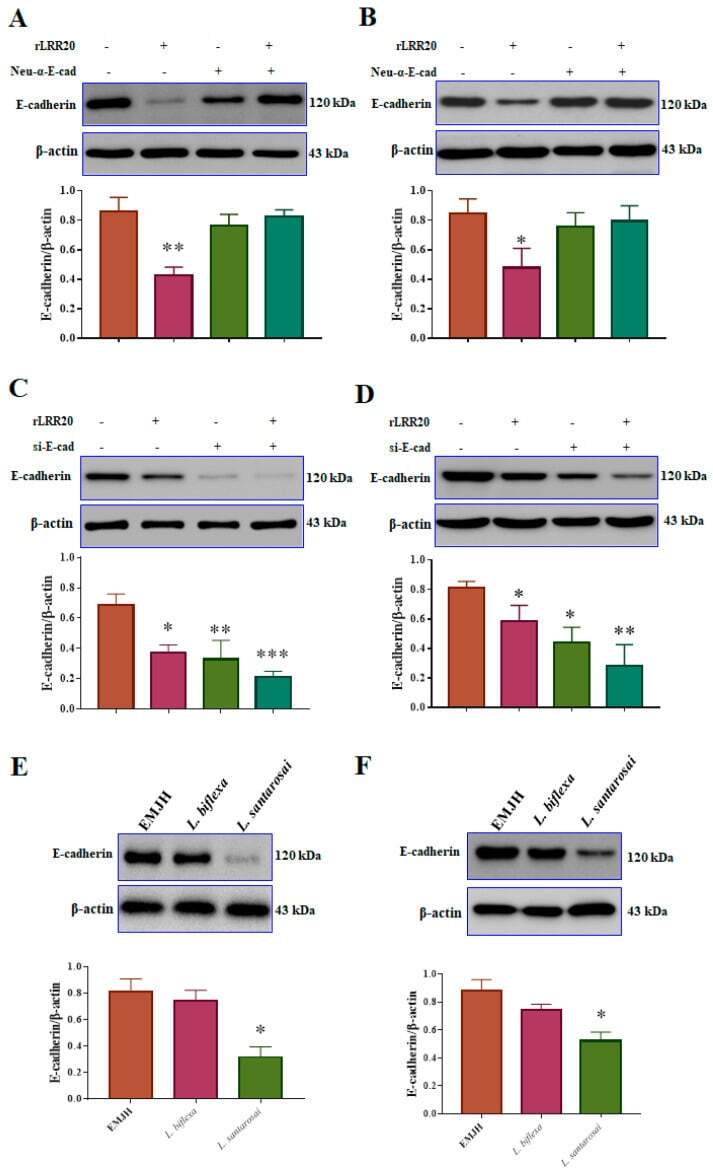
- Figure 3 rLRR20 and Leptospira infection downregulated E-cadherin expression. Neutralizing anti-E-cadherin antibody (Neu-alpha-E-cad) and short interfering RNA against E-cadherin (si-E-cad) were used to verify the regulatory effects of rLRR20 on E-cadherin expression in HK2s and hRPTECs. Effect of alpha-E-cad, which inhibits the interaction between rLRR20 and E-cadherin, on the rLRR20-mediated degradation of E-cadherin in HK2s ( A ) and hRPTECs ( B ). Effect of si-E-cad on the rLRR20-mediated degradation of E-cadherin in HK2s ( C ) and hRPTECs ( D ). Effect of pathogenic ( L. santarosai ) and non-pathogenic ( L. biflexa ) Leptospira species on the E-cadherin levels in HK2s ( E ) and hRPTECs ( F ). beta-actin was used as the internal control. EMJH, Ellinghausen-McCullough-Johnson-Harris medium. *** p < 0.001; ** p < 0.01; * p < 0.05.
- Submitted by
- Invitrogen Antibodies (provider)
- Main image
- Experimental details
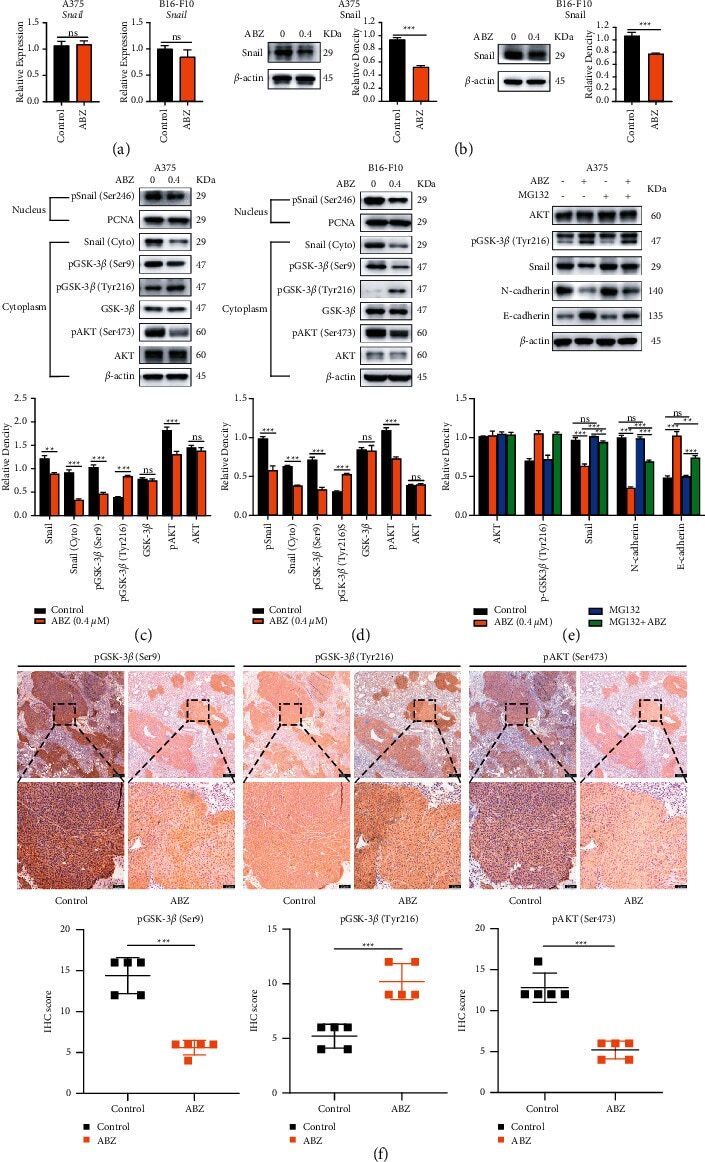
- Figure 4 ABZ treatment downregulates the snail expression in melanoma cells by increasing the accumulation of phosphorylated GSK-3 beta /Tyr216. (a) The relative transcription levels of Snail in the ABZ-treated (0.4 mu M) and control groups of A375 (left) and B16-F10 (right) melanoma cells were measured by RT-qPCR, with beta -actin as the internal control. (b) The expression of transcription factor Snail in A375 (left) and B16-F10 (right) cells was detected by western blot analysis, with beta -actin as the internal reference protein. (c-d) The expression levels of cytoplasmic proteins AKT, pAKT, GSK-3 beta , pGSK-3 beta (Ser9/Tyr216) and Snail, and nuclear protein pSnail in A375 and B16-F10 cells were also determined by western blotting, with beta -actin and PCNA as the internal controls for the cytoplasmic and nuclear proteins, respectively. The histograms show the relative density of AKT/pAKT, GSK-3 beta /pGSK-3 beta (Ser9/Tyr216), and Snail/p-Snail. (e) A375 cells were cotreated with or without MG132 and 0.4 mu M ABZ for 24 h western blot (up) was used to detect the expression levels of AKT, pGSK-3 beta /Tyr216, Snail, N-cadherin, and E-cadherin in the cytoplasm of A375 cells. The histogram (bottom) shows the relative density of AKT, pGSK-3 beta /Tyr216, Snail, E-cadherin, and N-cadherin. (f) Histogram showing the relative expression intensity of pGSK-3 beta (Ser9/Tyr216) and pAKT after immunohistochemical staining of mouse metastatic lung cancer tissues. Scale bars = 100
- Submitted by
- Invitrogen Antibodies (provider)
- Main image
- Experimental details
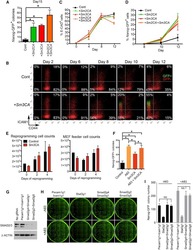
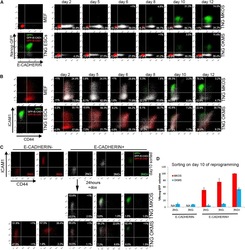
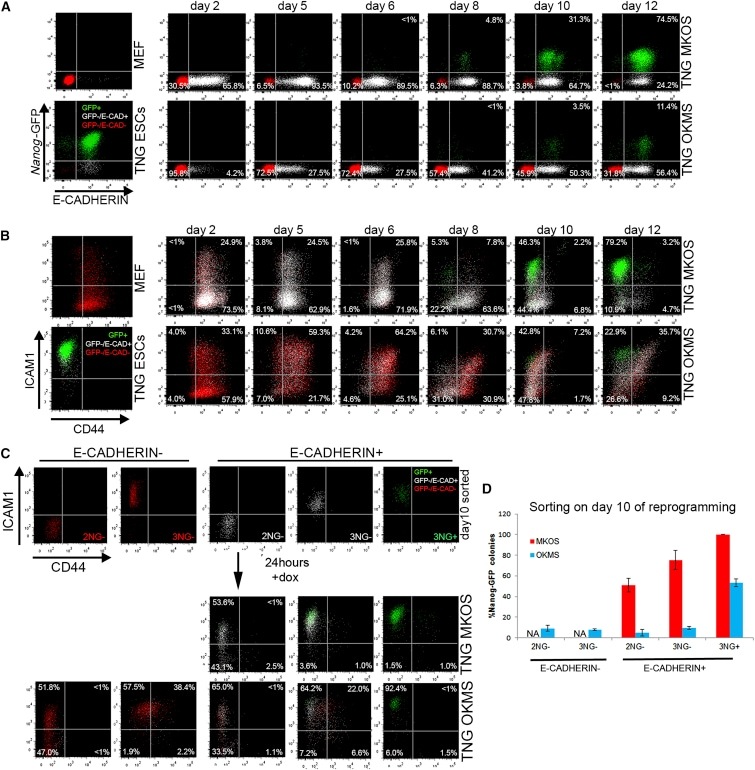
- Figure 3 Inefficient Reprogramming Progression of OKMS Reprogramming Intermediates (A) E-CAD and Nanog -GFP expression changes during TNG MKOS/OKMS reprogramming. Red indicates E-CAD - Nanog -GFP - , white indicates E-CAD + Nanog -GFP - , and green indicates E-CAD + Nanog -GFP + . (B) CD44 and ICAM1 expression changes during TNG MKOS/OKMS reprogramming with E-CAD, Nanog -GFP expression color codes in (A). (C) Flow cytometry analysis of sorted day-10 E-CAD -/+ 2NG- ( Nanog -GFP - CD44 - ICAM1 - ), 3NG - ( Nanog -GFP - CD44 - ICAM1 + ), and 3NG + ( Nanog -GFP + CD44 - ICAM1 + ) cells after a 24-hr culture. dox, doxycycline. (D) E-CAD -/+ 2NG - , 3NG - , and 3NG + ( Nanog -GFP + CD44 - ICAM1 + ) cells on day 10 were seeded at clonal density, and Nanog -GFP + iPSC colonies were counted after 10 days of further culture. The graph depicts the relative Nanog -GFP + CFA compared to that of MKOS 3NG + cells. Error bars represent SD; n = 3 independent experiments.
- Submitted by
- Invitrogen Antibodies (provider)
- Main image
- Experimental details
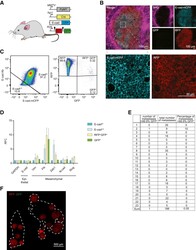
- Figure 1 Epithelial-to-Mesenchymal Transition Reported by Historical Lineage-Tracing Reporter and Current E-Cadherin Status in Murine Metastatic Mammary Carcinoma Model (A) Schematic of fluorescent transgenic mouse model, carrying polyoma middle-T (PyMT) oncogene driven by the mammary gland specific MMTV promoter, Cre recombinase under the control of the fsp1 promoter, endogenous E-cad labeled with mCFP, and ubiquitous expression from the R26 locus of membranous RFP-STOP, which is flanked by lox P sites, leading to excision and subsequent expression of membranous GFP upon Cre expression. (B) Top panel: representative multi-photon images of the fluorescent PyMT mammary tumors from recipient mice. Scale bar, 100 mum. Bottom panel: high-magnification images of the E-cad-mCFP and RFP channel of the boxed area in the top left image. Scale bar, 50 mum. (C) Representative scatterplot from flow cytometry analysis of primary tumor of recipient mice for either absence of endogenous E-cad-mCFP expression and antibody staining (E-cad LO ) or presence of high expression of E-cad and staining for Ab (E-cad HI tumor cells) or subdivision of RFP + or GFP + cells. (D) Relative mRNA expression of classical EMT marker genes (E-cad, Vimentin [Vim], fibronectin [FN], Zeb1, N-cad [N-cadherin], Slug) determined using qPCR of sorted RFP + E-cad Hi , RFP + E-cad LO , RFP + GFP + , and GFP + cells from primary tumors. Plotted mean and SD of n = 3 mice. (E) Quantification of lung metastases of all tran

- Submitted by
- Invitrogen Antibodies (provider)
- Main image

- Experimental details
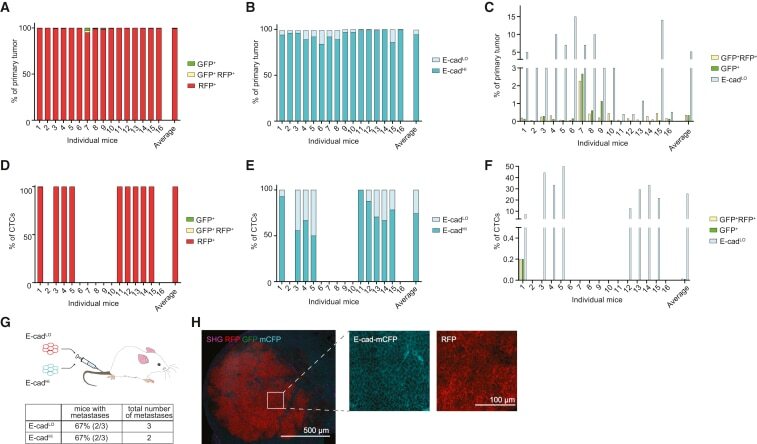
- Figure 2 Mesenchymal E-cad LO Population Exceeds fsp1 -Lineage-Traced Population in Primary Tumor and Circulation and Has Metastatic Potential (A) Percentage of GFP + (green), GFP + RFP + (yellow), and RFP + (red) tumor cells in primary tumors of recipient mice. n = 16 mice. (B) Percentage of E-cad HI (blue), E-cad LO (light blue) tumor cells in primary tumors of recipient mice. n = 16 mice. (C) Comparison of percentage of E-cad LO (light blue) with GFP + (green) and GFP + RFP + (yellow) tumor cells in primary tumors of recipient mice. n = 16 mice. (D) Percentage of GFP + (green), GFP + RFP + (yellow), and RFP + (red) circulating tumor cells collected from the right cardiac chamber of recipient mice. n = 16 mice. (E) Percentage of E-cad HI (blue), E-cad LO (light blue) circulating tumor cells collected from the right cardiac chamber of recipient mice. n = 16 mice. (F) Comparison of percentage of E-cad LO (light blue) with GFP + (green) and GFP + RFP + (yellow) circulating tumor cells collected from the right cardiac chamber of recipient mice. n = 16 mice. (G) Top panel: schematic overview of experimental setup: fluorescence-activated cell sorting (FACS)-sorted E-cad HI or E-cad LO cells of orthotopically transplanted mice were injected in the tail vein of acceptor mice. Bottom panel: quantification of lung metastases of all transplanted mice. n = 3 mice per condition. (H) Representative multi-photon image of lung metastasis from (G). Scale bar, 500 mum. Right panels: zoom of
- Submitted by
- Invitrogen Antibodies (provider)
- Main image

- Experimental details
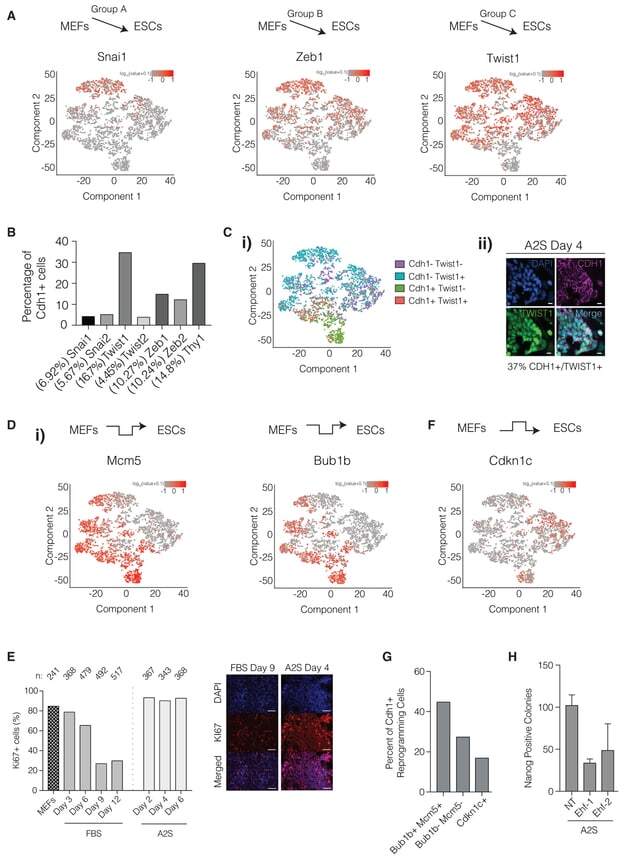
- Figure 3. Reprogramming-Specific Gene Expression Patterns Are Important for Conversion to iPSCs (A) t-SNE plots based on Figure 2A highlighting the expression of MEF-associated mesenchymal genes that are downregulated as cells transition from MEFs to pluripotency. Top schematic indicates the pattern of expression. (B) Percentage of Cdh1+ cells that also co-express the indicated MEF genes on the x axis. The percentage of MEF gene-expressing cells that express Cdh1 is presented in brackets on the x axis. Note that because of the limit of detection of single-cell transcriptional analysis, co-expression may be underestimated. (C) (i) t-SNE plots based on Figure 2A illustrating co-expression of Cdh1 with Twist1. Note that because of the limit of detection of single-cell transcriptional analysis, co-expression may be underestimated. (ii) Immunofluorescent staining for CDH1 and TWIST1. Percentage of CDH1+/TWIST1+ colonies on A2S day 4 shown below image. Scale bar, 10 mum. (D) t-SNE plots based on Figure 2A highlighting the expression of DNA replication and cell-cycle-associated genes. Top schematic indicates the pattern of expression. (E) Left: percentage of cells that are Ki67+ at each indicated reprogramming time point in FBS or A2S systems. Right: immunofluorescent staining of Ki67 during FBS and A2S reprogramming (day 9 and day 4, respectively). Scale bar, 50 mum. (F) t-SNE plot based on Figure 2A for the anti-proliferation gene Cdkn1c. Top schematic indicates the patter
- Submitted by
- Invitrogen Antibodies (provider)
- Main image
- Experimental details
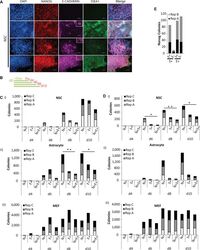
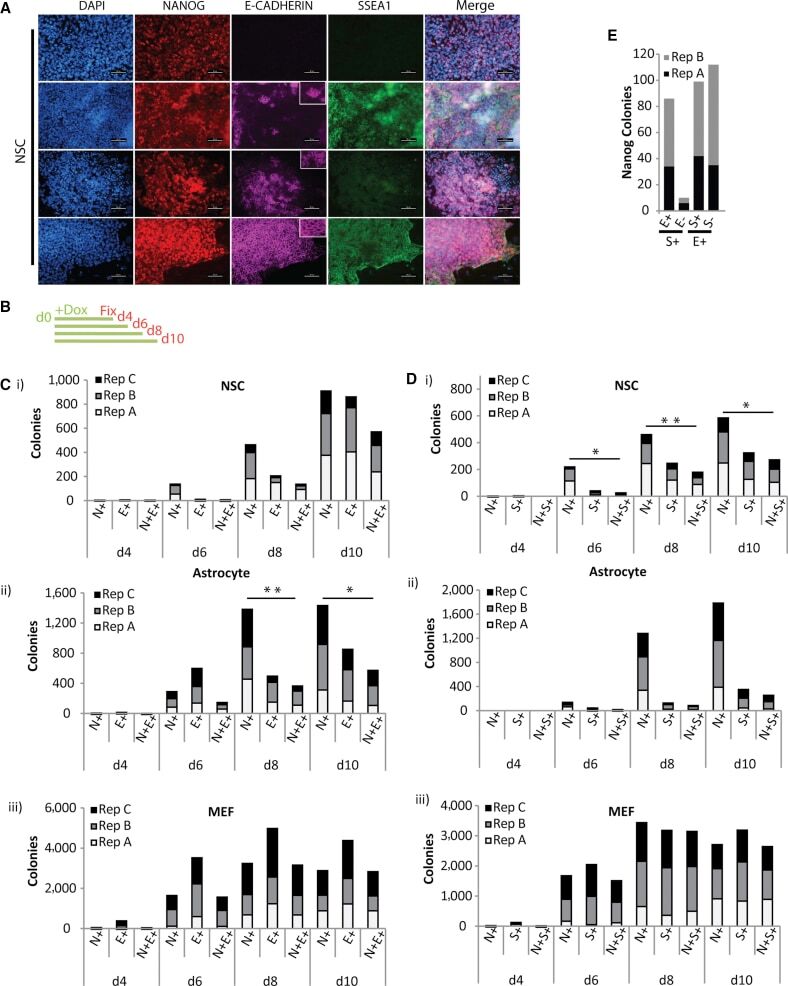
- Figure 1 Nanog+ Colonies from Neural Stem Cell and Astrocyte Reprogramming Can Emerge Independent of E-Cadherin or SSEA1 (A) Immunofluorescence (IF) images of NANOG colonies on day 10 of reprogramming NSC with E-cadherin and/or SSEA1. Scale bar, 50 mum. Insets, magnification of field. (B) Scheme of experiment presented in (C) and (D). Dox was added to cells on day 0 (d0) and reprogramming cultures were fixed on indicated days. (C) Counts of Nanog+ (N+), E-cadherin+ (E+) and Nanog+/E-cadherin+ (N+E+) colonies from (i) NSC, (ii) astrocyte, and (iii) MEF reprogramming cultures, fixed on days indicated on X axis. Counts from three independent experiments are stacked. Statistical significance of difference between N+ and N+E+ colonies by paired two-tailed t test; * p < 0.05, ** p < 0.01. Non-significant differences are not marked. (D) As in (C) above except for SSEA1+. SSEA1 = S+, Nanog+/SSEA1 = N+S+. t test; * p < 0.05, ** p < 0.01. (E) Combined counts of NANOG+/SSEA1+/E-cadherin. Counts from two independent experiments are stacked. Note that the number of S+E+ colonies and E+S+ colonies differ because of scoring between large fields of SSEA containing multiple E-cadherin+ colonies.
- Submitted by
- Invitrogen Antibodies (provider)
- Main image
- Experimental details
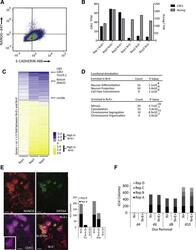
- Figure 3 Late Reprogramming Markers Are Enriched in the N+E+ Population (A) Flow cytometry plot of reprogramming culture stained with Nanog-647 and E-cadherin-488. (B) RNA-Seq read counts (transcripts per million [TPM]) for E-cadherin, labeled Cdh1 in figure, (left, Y axis) and Nanog (right, Y axis) for N+E+ and N+E- populations from three independent experiments. (C) Heatmap of genes 1.5-fold differentially expressed between N+E+ and N+E- populations (set to 1) ranked by average TPM from three independent experiments. (D) Functional annotation of gene expression in N+E+ and N+E- populations. (E) Left: Immunofluorescence images of NANOG, E-cadherin, and DPPA4 on d11 of NSC reprogramming. Right: Counts from two independent experiments of Dppa4+ colonies in N+E+ and N+E- colonies are stacked. Scale bar, 50 mum. Insets, magnification of field. (F) Comparison of d14 N+ and N+E+ colonies following withdrawal of dox on the day indicated on the X axis. Counts from four independent experiments are stacked. No significant difference between N+ and N+E+ colonies by paired two-tailed t test.
