Explore
 Validate
 Learn
Learn Western blot
Antibody data
- Antibody Data
- Antigen structure
- References [5]
- Comments [0]
- Validations
- Western blot [3]
- Immunocytochemistry [1]
- Flow cytometry [1]
- Other assay [5]
Submit
Validation data
Reference
Comment
Report error
- Product number
- PA5-16571 - Provider product page

- Provider
- Invitrogen Antibodies
- Product name
- PDGFRA Polyclonal Antibody
- Antibody type
- Polyclonal
- Antigen
- Synthetic peptide
- Description
- PA5-16571 targets PDGFR alpha in IHC applications and shows reactivity with mouse, Rat, and Human samples.
- Concentration
- 1 mg/mL
Submitted references Mechanoreceptor Piezo1 Is Downregulated in Multiple Sclerosis Brain and Is Involved in the Maturation and Migration of Oligodendrocytes in vitro.
Duchenne muscular dystrophy trajectory in R-DMDdel52 preclinical rat model identifies COMP as biomarker of fibrosis.
Characterizing the Low-Dose Effects of Methylmercury on the Early Stages of Embryo Development Using Cultured Human Embryonic Stem Cells.
EBI2 Is Temporarily Upregulated in MO3.13 Oligodendrocytes during Maturation and Regulates Remyelination in the Organotypic Cerebellar Slice Model.
Intervertebral disc herniation effects on multifidus muscle composition and resident stem cell populations.
Velasco-Estevez M, Koch N, Klejbor I, Caratis F, Rutkowska A
Frontiers in cellular neuroscience 2022;16:914985
Frontiers in cellular neuroscience 2022;16:914985
Duchenne muscular dystrophy trajectory in R-DMDdel52 preclinical rat model identifies COMP as biomarker of fibrosis.
Taglietti V, Kefi K, Bronisz-Budzyńska I, Mirciloglu B, Rodrigues M, Cardone N, Coulpier F, Periou B, Gentil C, Goddard M, Authier FJ, Pietri-Rouxel F, Malfatti E, Lafuste P, Tiret L, Relaix F
Acta neuropathologica communications 2022 Apr 25;10(1):60
Acta neuropathologica communications 2022 Apr 25;10(1):60
Characterizing the Low-Dose Effects of Methylmercury on the Early Stages of Embryo Development Using Cultured Human Embryonic Stem Cells.
Li B, Qiao C, Jin X, Chan HM
Environmental health perspectives 2021 Jul;129(7):77007
Environmental health perspectives 2021 Jul;129(7):77007
EBI2 Is Temporarily Upregulated in MO3.13 Oligodendrocytes during Maturation and Regulates Remyelination in the Organotypic Cerebellar Slice Model.
Velasco-Estevez M, Koch N, Klejbor I, Laurent S, Dev KK, Szutowicz A, Sailer AW, Rutkowska A
International journal of molecular sciences 2021 Apr 21;22(9)
International journal of molecular sciences 2021 Apr 21;22(9)
Intervertebral disc herniation effects on multifidus muscle composition and resident stem cell populations.
Agha O, Mueller-Immergluck A, Liu M, Zhang H, Theologis AA, Clark A, Kim HT, Liu X, Feeley BT, Bailey JF
JOR spine 2020 Jun;3(2):e1091
JOR spine 2020 Jun;3(2):e1091
No comments: Submit comment
Supportive validation
- Submitted by
- Invitrogen Antibodies (provider)
- Main image
- Experimental details
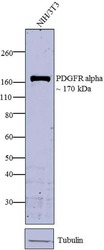
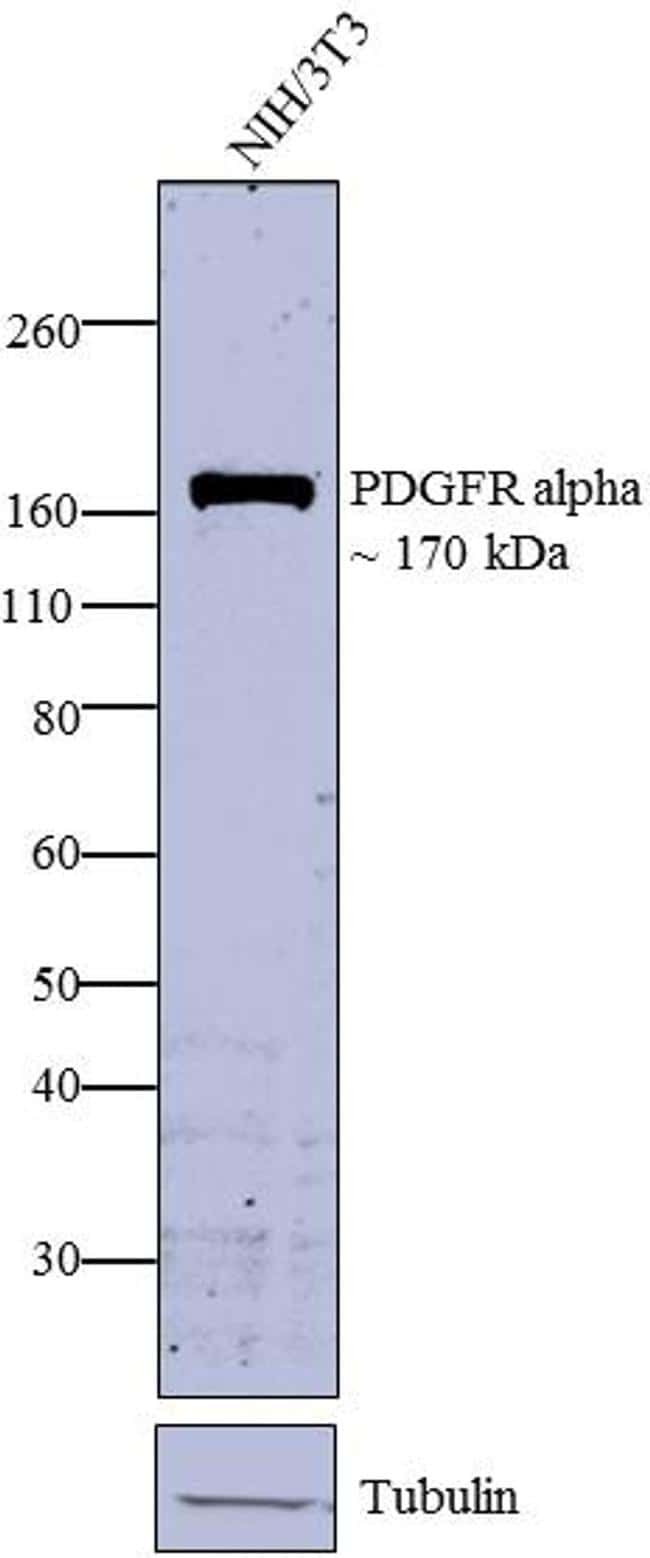
- Western blot analysis was performed on membrane enriched extract (30 µg) of NIH/3T3 cells. The blots were probed with PDGFR alpha Rabbit Polyclonal Antibody (Product # PA5-16571, 2µg/mL) and detected by chemiluminescence using Goat anti-Rabbit IgG (H+L) Superclonal™ Secondary Antibody, HRP conjµgate (Product # A27036, 0.4µg/mL, 1:2500 dilution). A ~ 170 kDa band corresponding to PDGFR alpha was observed. Known quantity of protein samples were electrophoresed using Novex® NuPAGE® 4-12 % Bis-Tris gel (Product # NP0321BOX), XCell SureLock™ Electrophoresis System (Product # EI0002) and Novex® Sharp Pre-Stained Protein Standard (Product # LC5800). Resolved proteins were then transferred onto a nitrocellulose membrane by overnight transfer method. The membrane was probed with the relevant primary and secondary Antibody following blocking with 5 % skimmed milk. Chemiluminescent detection was performed using Pierce™ ECL Western Blotting Substrate (Product # 32106).
- Submitted by
- Invitrogen Antibodies (provider)
- Main image
- Experimental details
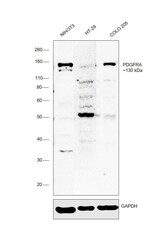
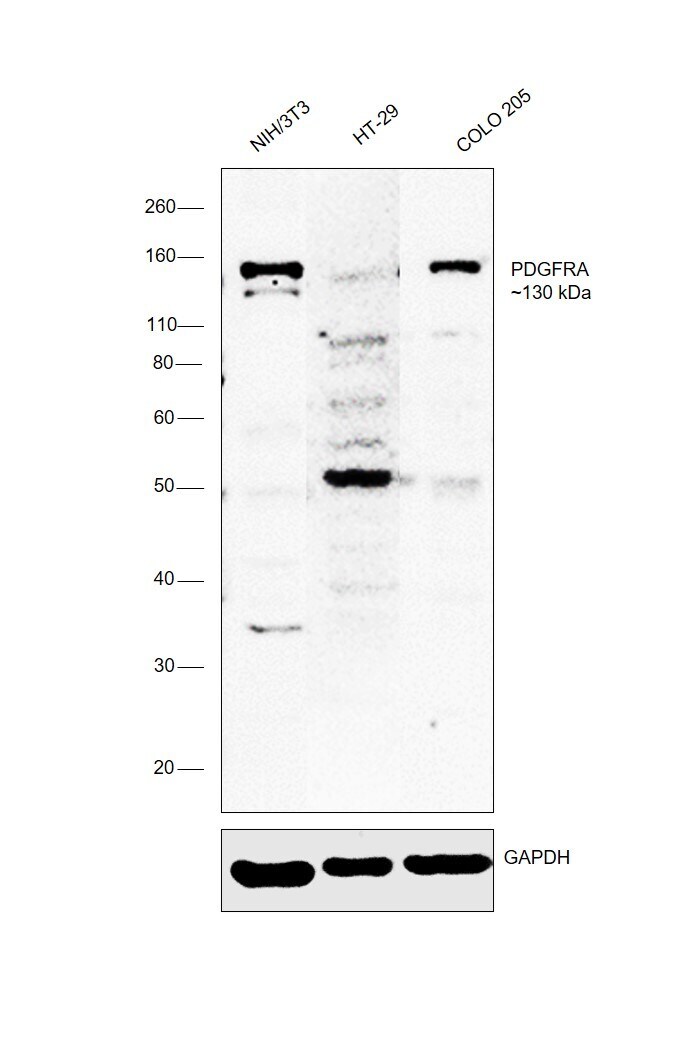
- Western blot was performed using Anti-PDGFRA Polyclonal Antibody (Product # PA5-16571) and a 130 kDa band corresponding to Platelet-derived growth factor receptor alpha was observed across cell lines tested. Membrane enriched extracts (30 µg lysate) of NIH/3T3 (Lane 1), HT-29 (Lane 2), COLO 205 (Lane 3) were electrophoresed using NuPAGE™ 4-12% Bis-Tris Protein Gel (Product # NP0321BOX). Resolved proteins were then transferred onto a Nitrocellulose membrane (Product # IB23001) by iBlot® 2 Dry Blotting System (Product # IB21001). The blot was probed with the primary antibody (2 µg/mL) and detected by chemiluminescence with Goat anti-Rabbit IgG (H+L) Superclonal™ Recombinant Secondary Antibody, HRP (Product # A27036, 1:6000 dilution) using the iBright FL 1000 (Product # A32752). Chemiluminescent detection was performed using SuperSignal™ West Dura Extended Duration Substrate (Product # 34076). Few uncharacterized bands were observed in HT-29 cell line.
- Submitted by
- Invitrogen Antibodies (provider)
- Main image
- Experimental details
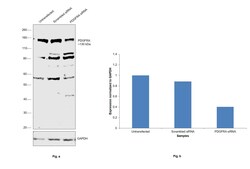
- Knockdown of Platelet-derived growth factor receptor alpha was achieved by transfecting HT-29 with Platelet-derived growth factor receptor alpha specific siRNAs (Silencer® select Product # s10236, s10234). Western blot analysis (Fig. a) was performed using Membrane enriched extracts from the Platelet-derived growth factor receptor alpha knockdown cells (lane 3), non-targeting scrambled siRNA transfected cells (lane 2) and untransfected cells (lane 1). The blot was probed with PDGFRA Polyclonal Antibody (Product # PA5-16571, 2 µg/mL) and Goat anti-Rabbit IgG (H+L) Superclonal™ Recombinant Secondary Antibody, HRP (Product # A27036, 1:6000 dilution). Densitometric analysis of this western blot is shown in histogram (Fig. b). Decrease in signal upon siRNA mediated knock down confirms that antibody is specific to Platelet-derived growth factor receptor alpha. Few uncharacterized bands were observed at ~55 and 85 kDa.

Supportive validation
- Submitted by
- Invitrogen Antibodies (provider)
- Main image
- Experimental details
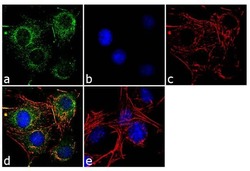
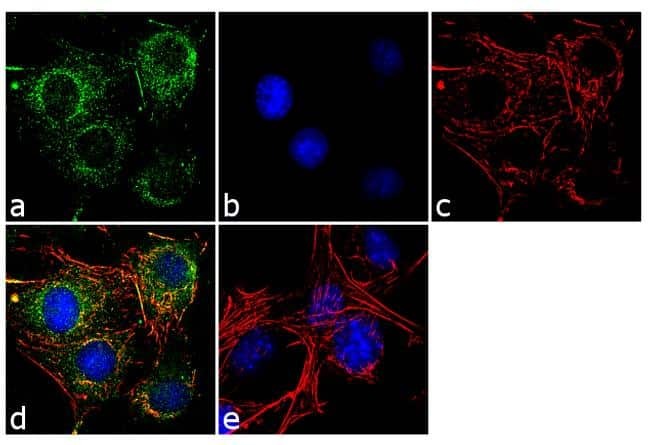
- Immunofluorescence analysis of PDGFR alpha was performed using 70% confluent log phase NIH/3T3 cells. The cells were fixed with 4% paraformaldehyde for 10 minutes, permeabilized with 0.1% Triton™ X-100 for 10 minutes, and blocked with 1% BSA for 1 hour at room temperature. The cells were labeled with PDGFR alpha Rabbit Polyclonal Antibody (Product # PA5-16571) at 2µg/mL in 0.1% BSA and incubated for 3 hours at room temperature and then labeled with Goat anti-Rabbit IgG (H+L) Superclonal™ Secondary Antibody, Alexa Fluor® 488 conjµgate (Product # A27034) at a dilution of 1:2000 for 45 minutes at room temperature (Panel a: green). Nuclei (Panel b: blue) were stained with SlowFade® Gold Antifade Mountant with DAPI (Product # S36938). F-actin (Panel c: red) was stained with Alexa Fluor® 555 Rhodamine Phalloidin (Product # R415, 1:300). Panel d represents the merged image showing punctated cytoplasmic localization. Panel e shows the no primary antibody control. The images were captured at 60X magnification.
Supportive validation
- Submitted by
- Invitrogen Antibodies (provider)
- Main image
- Experimental details
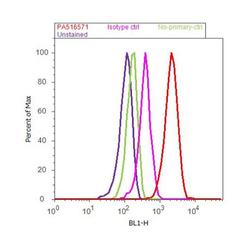
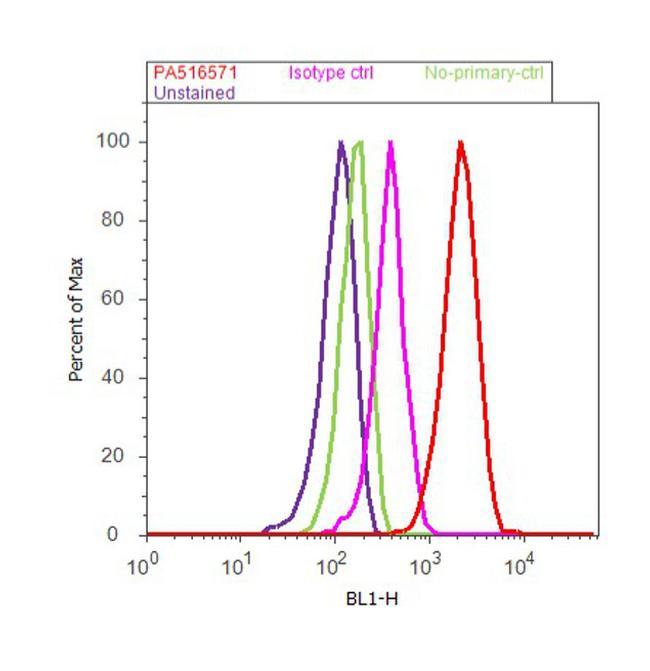
- Flow cytometry analysis of PDGFR alpha was done on U-87 MG cells. Cells were fixed with 70% ethanol for 10 minutes, permeabilized with 0.25% Triton™ X-100 for 20 minutes, and blocked with 5% BSA for 30 minutes at room temperature. Cells were labeled with PDGFR alpha Rabbit Polyclonal Antibody (Product # PA5-16571, red histogram) or with rabbit isotype control (pink histogram) at 3-5 µg/million cells in 2.5% BSA. After incubation at room temperature for 2 hours, the cells were labeled with Alexa Fluor® 488 Goat Anti-Rabbit Secondary Antibody (Product # A11008) at a dilution of 1:400 for 30 minutes at room temperature. The representative 10,000 cells were acquired and analyzed for each sample using an Attune® Acoustic Focusing Cytometer. The purple histogram represents unstained control cells and the green histogram represents no-primary-antibody control..
Supportive validation
- Submitted by
- Invitrogen Antibodies (provider)
- Main image
- Experimental details
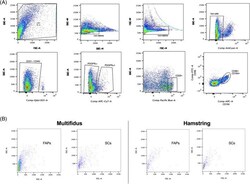
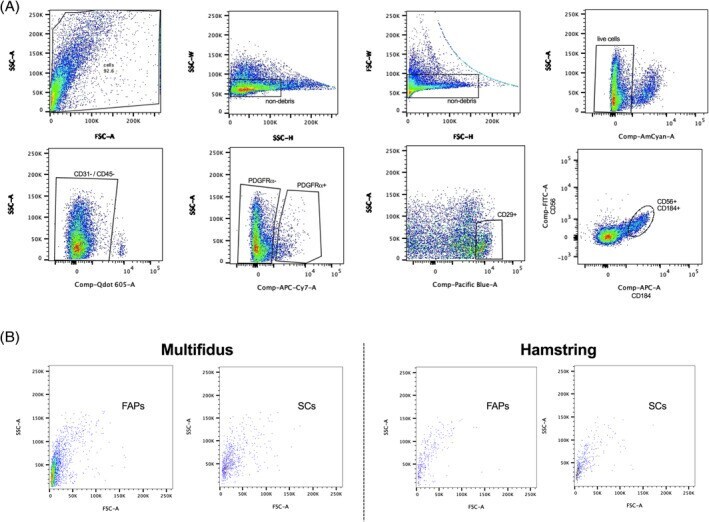
- FIGURE 2 A, Full gating of FACS cell sorting. Gates were set based on each antibodies' FMO for every run. FAP and SC quantity were reported as a percentage of nondebris live cells. Sorting order is from top left to top right to bottom left to bottom right with the final FAP population defined as CD31-/CD45-/CD29-/CD56-/PDGFRalpha+/CD184-, and final SC population defined as CD31-/CD45-/CD29+/CD56+/PDGFRalpha-/CD184+. B, Forward and side scatter plots of final FAP and SC populations from the multifidus and hamstring. FAP, fibro-adipogenic progenitor; FMO, fluorescence minus one; PDGFRalpha, platelet-derived growth factor receptor alpha; SC, satellite cell
- Submitted by
- Invitrogen Antibodies (provider)
- Main image
- Experimental details
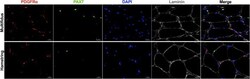
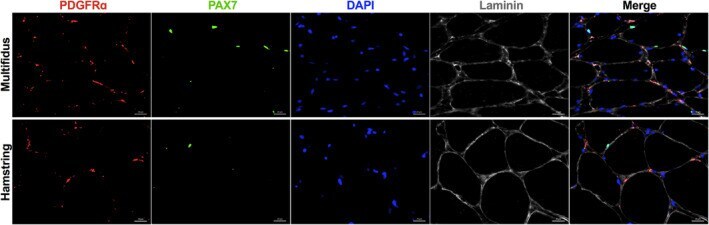
- FIGURE 4 Representative immunostaining of multifidus and hamstring muscle demonstrating respective relative proportions of FAPs and SCs residing in the muscle, x40 magnification, scale bar represents 20 mum. Red, PDGFRalpha - FAP marker. Green, PAX7 - SC marker. Blue, DAPI. Gray, laminin. FAP, fibro-adipogenic progenitor; PDGFRalpha, platelet-derived growth factor receptor alpha; SC, satellite cell
- Submitted by
- Invitrogen Antibodies (provider)
- Main image

- Experimental details
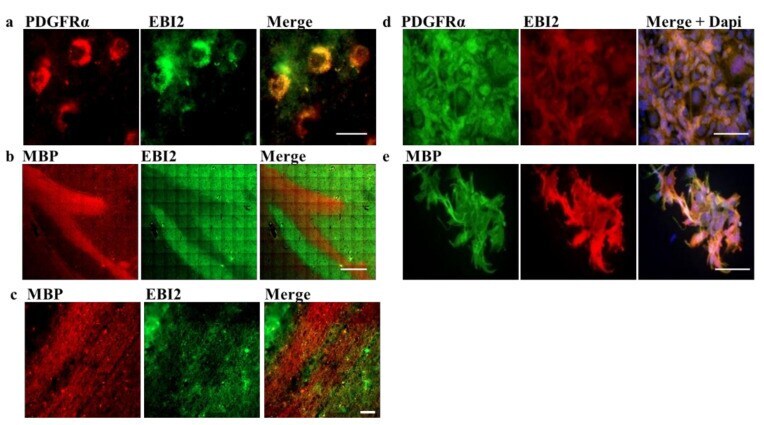
- Figure 1 EBI2 is expressed in OPCs in the human brain. ( a ) EBI2 is expressed in the human brain in OPCs as indicated by double staining with anti-PDGFRalpha (red) and anti-EBI2 (green) antibody. Scale 20 mum. ( b ) EBI2 expression is not detectable in mature myelin sheets. The images show MBP positive (red) myelinated tracts with no EBI2 (green) staining. MBP images were taken at low magnification to show a large portion of the myelinated nerve tract (corpus callosum). Scale 600 mum. ( c ) Higher magnification of the corpus callosum myelinated tracts. Scale 40 mum. Representative images of N = 3 human brains. ( d ) EBI2 is expressed at protein level in PDGFRalpha-expressing and ( e ) MBP-expressing human MO3.13 oligodendrocytes (N = 3). Scale 100 mum.
- Submitted by
- Invitrogen Antibodies (provider)
- Main image

- Experimental details
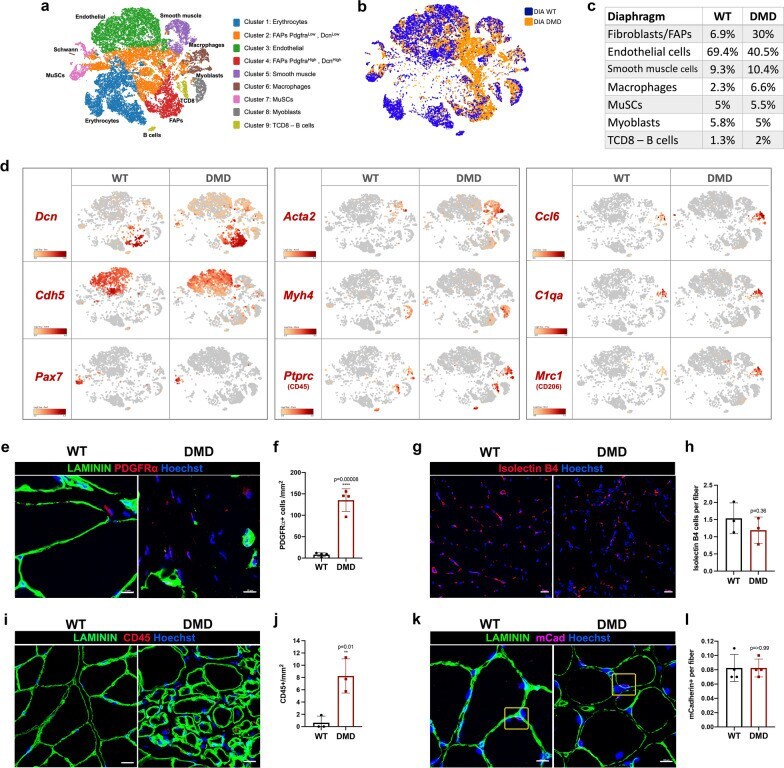
- Fig. 6 scRNAseq on 12-month-old R-DMDdel52 diaphragm compared to WT. a T-SNE clustering of rat muscle single-cell into nine populations. b Clustering overlay of WT and DMD muscle single-cells. c Proportion of major cell time of rat WT and DMD muscle cells. d Profiles of known markers in each cell population cluster ( Dcn, Cdh5, Pax7, Acta2, Myh4, Ptprc, Ccl6, C1qa, Mrc1 ). e Representative immunofluorescence for PDGFRalpha (red) and LAMININ (green) in WT and DMD diaphragms at 12 months of age. Nuclei are counterstained with Hoechst (blue) (scale bar = 10 mum). f Quantification of the number of PDGFRalpha-positive cells per mm 2 in WT and DMD diaphragms at 12 months of age. g Representative staining for ISOLECTIN B4 (red) and nuclei (blue) in diaphragms isolated from WT and DMD rats aged 12 months (scale bar = 20 mum). h Quantification of ISOLECTIN B4-positive vessels per fibre in TA of WT and DMD rats aged 12 months. i Representative immunofluorescence for CD45 (red) and LAMININ (green) in WT and DMD diaphragms at 12 months of age. Nuclei are counterstained with Hoechst (blue) (scale bar = 10 mum). j Quantifications of CD45-positive cells per mm 2 in WT and DMD diaphragms at 12 months of age. k Representative immunofluorescence for mCADHERIN (purple) and LAMININ (green) in WT and DMD diaphragms at 12 months of age. Nuclei are counterstained with Hoechst (blue) (scale bar = 10 mum). l Quantifications of the number of mCADHERIN-positive satellite cells per fibre in diaphragms i
- Submitted by
- Invitrogen Antibodies (provider)
- Main image
- Experimental details
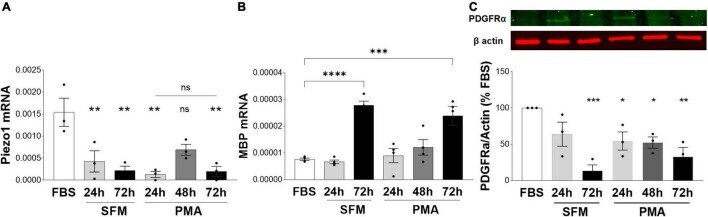
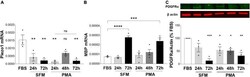
- FIGURE 4 Expression of Piezo1 decreases in MO3.13 oligodendrocytes during maturation. (A) The mRNA expression of Piezo1 receptor in MO3.13 oligodendrocytes is downregulated already after 24 h of both, serum-free media (SFM) (28 +- 16% SFM 24 h vs. FBS) and SFM supplemented with PMA (8 +- 4% PMA 24 h vs. FBS). At 48 h of treatment with PMA (data not collected for 48 h SFM) Piezo1 mRNA briefly increases (45 +- 8% PMA 48 h vs. FBS, p = 0.0522) indicating a temporary upregulation of Piezo1 signaling during oligodendrocyte maturation. Data presented as mean +- SEM, One-way analysis of variance with Sidak's multiple comparison's test, p = 0.013, N = 3 independent experiments. ** p < 0.01 (B) SFM (365 +- 20% SFM 72 h vs. FBS) and PMA (314 +- 46% OMA 72 h vs. FBS) treatment induce MO3.13 oligodendrocyty maturation. Data presented as mean +- SEM, One-way analysis of variance with Sidak's multiple comparison's test, p < 0.0001, N = 4 independent experiments. *** p < 0.001, **** p < 0.0001 (C) Representative WB image of OPC marker PDGFRalpha shows steadily decreasing levels of PDGFRalpha protein in MO3.13 oligodendrocytes stimulated with PMA or cultured in SFM. Data presented as mean +- SEM, One-way analysis of variance with Dunnett's multiple comparison's test, p < 0.0026, N = 3 independent experiments. * p < 0.05, ** p < 0.01, *** p < 0.001.