Explore
 Validate
 Learn
LearnPA1-090
antibody from Invitrogen Antibodies
Targeting: SLC9A3R1
EBP50, NHERF, NHERF1
 Western blot
 Immunocytochemistry
 Immunoprecipitation Immunohistochemistry Flow cytometry Other assay
Antibody data
- Antibody Data
- Antigen structure
- References [41]
- Comments [0]
- Validations
- Immunocytochemistry [2]
- Immunohistochemistry [1]
- Flow cytometry [1]
- Other assay [23]
Submit
Validation data
Reference
Comment
Report error
- Product number
- PA1-090 - Provider product page

- Provider
- Invitrogen Antibodies
- Product name
- EBP50 Polyclonal Antibody
- Antibody type
- Polyclonal
- Antigen
- Other
- Description
- PA1-090 detects ezrin-radixin-moesin (ERM) binding phosphoprotein of 50 kDa (EBP50) from mouse tissues, human T84 and Calu3 cells as well as recombinant human protein. PA1-090 has been successfully used in Western blot, Immunohistochemistry, immunofluorescence and immunoprecipitation procedures. By Western blot, this antibody detects an ~50 kDa protein representing EBP50 from T84 cell extract. Immunohistochemical staining of EBP50 in mouse airway results in staining of the epithelium. The PA1-090 immunogen is recombinant human His-tagged EBP50 obtained from bacteria. All His-tag specific antibody has been removed. This product was epitope affinity purified using a synthetic peptide to residues C R(286) S A S S D T S E E L N S Q D S P(302) of human EBP50.
- Reactivity
- Human, Mouse
- Host
- Rabbit
- Isotype
- IgG
- Vial size
- 100 μg
- Concentration
- 1 mg/mL
- Storage
- -20°C, Avoid Freeze/Thaw Cycles
Submitted references βA3/A1-crystallin regulates apical polarity and EGFR endocytosis in retinal pigmented epithelial cells.
Ezrin-Radixin-Moesin Binding Phosphoprotein 50: A Potential Novel Biomarker in Human Papilloma Virus-Associated Head and Neck Squamous Cell Carcinomas.
Establishment of three novel cell lines derived from African American patients with colorectal carcinoma: A unique tool for assessing racial health disparity.
NHERF1 and tumor microenvironment: a new scene in invasive breast carcinoma.
Hierarchical clustering analysis identifies metastatic colorectal cancers patients with more aggressive phenotype.
Similar expression pattern of NHERF1 and EZRIN in papillary but not in solid areas of human serous ovarian carcinomas.
β-catenin interaction with NHERF1 and RASSF1A methylation in metastatic colorectal cancer patients.
Correctors of mutant CFTR enhance subcortical cAMP-PKA signaling through modulating ezrin phosphorylation and cytoskeleton organization.
NHERF1/EBP50 Suppresses Wnt-β-Catenin Pathway-Driven Intestinal Neoplasia.
The potential predictive role of nuclear NHERF1 expression in advanced gastric cancer patients treated with epirubicin/oxaliplatin/capecitabine first line chemotherapy.
Immunoprofile from tissue microarrays to stratify familial breast cancer patients.
Fine Needle Aspiration Cytology: A Tool to Study NHERF1 Expression as a Potential Marker of Aggressiveness in Lung Cancer.
The tight-junction protein claudin-6 induces epithelial differentiation from mouse F9 and embryonic stem cells.
Characterization of CFTR High Expresser cells in the intestine.
Nuclear NHERF1 expression as a prognostic marker in breast cancer.
High density of tryptase-positive mast cells in human colorectal cancer: a poor prognostic factor related to protease-activated receptor 2 expression.
Involvement of nuclear NHERF1 in colorectal cancer progression.
PTEN, NHERF1 and PHLPP form a tumor suppressor network that is disabled in glioblastoma.
Peritumoral vascular invasion and NHERF1 expression define an immunophenotype of grade 2 invasive breast cancer associated with poor prognosis.
Overexpression of nuclear NHERF1 in advanced colorectal cancer: association with hypoxic microenvironment and tumor invasive phenotype.
Ezrin-anchored protein kinase A coordinates phosphorylation-dependent disassembly of a NHERF1 ternary complex to regulate hormone-sensitive phosphate transport.
Na+/H+ exchanger regulatory factor 1 (NHERF1) directly regulates osteogenesis.
Human epidermal growth factor receptor 2, Na+/H+ exchanger regulatory factor 1, and breast cancer susceptibility gene-1 as new biomarkers for familial breast cancers.
Na+/H+ exchanger regulatory factor 1 expression levels in blood and tissue predict breast tumour clinical behaviour.
Quantitative protein and mRNA profiling shows selective post-transcriptional control of protein expression by vasopressin in kidney cells.
Ezrin and EBP50 redistribute apically in rat uterine epithelial cells at the time of implantation and in response to cell contact.
Expression of NHERF1 in colonic tumors induced by 1,2-dimethylhydrazine in rats is independent of plasma ovarian steroids.
A hierarchy of signals regulates entry of membrane proteins into the ciliary membrane domain in epithelial cells.
Estrogens regulate the expression of NHERF1 in normal colon during the reproductive cycle of Wistar rats.
Na/H exchanger regulatory factors control parathyroid hormone receptor signaling by facilitating differential activation of G(alpha) protein subunits.
Biological role of NHERF1 protein expression in breast cancer.
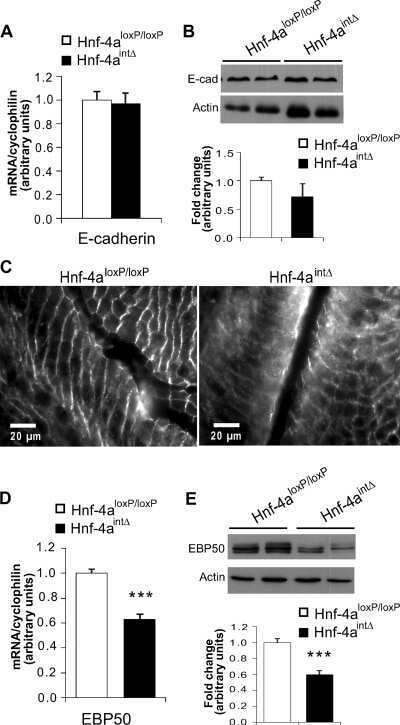
Hepatocyte nuclear factor 4alpha, a key factor for homeostasis, cell architecture, and barrier function of the adult intestinal epithelium.
Proteomic analysis of peripheral blood mononuclear cells: selective protein processing observed in patients with rheumatoid arthritis.
Expression and clinicopathological significance of oestrogen-responsive ezrin-radixin-moesin-binding phosphoprotein 50 in breast cancer.
Expression of ion transport-associated proteins in human efferent and epididymal ducts.
Receptor activity-modifying protein (RAMP) isoform-specific regulation of adrenomedullin receptor trafficking by NHERF-1.
Activation-independent parathyroid hormone receptor internalization is regulated by NHERF1 (EBP50).
A macromolecular complex of beta 2 adrenergic receptor, CFTR, and ezrin/radixin/moesin-binding phosphoprotein 50 is regulated by PKA.
Foxj1 is required for apical localization of ezrin in airway epithelial cells.
Ezrin-radixin-moesin-binding phosphoprotein 50 is expressed at the apical membrane of rat liver epithelia.
Evidence for ezrin-radixin-moesin-binding phosphoprotein 50 (EBP50) self-association through PDZ-PDZ interactions.
Shang P, Stepicheva N, Teel K, McCauley A, Fitting CS, Hose S, Grebe R, Yazdankhah M, Ghosh S, Liu H, Strizhakova A, Weiss J, Bhutto IA, Lutty GA, Jayagopal A, Qian J, Sahel JA, Samuel Zigler J Jr, Handa JT, Sergeev Y, Rajala RVS, Watkins S, Sinha D
Communications biology 2021 Jul 8;4(1):850
Communications biology 2021 Jul 8;4(1):850
Ezrin-Radixin-Moesin Binding Phosphoprotein 50: A Potential Novel Biomarker in Human Papilloma Virus-Associated Head and Neck Squamous Cell Carcinomas.
Shankar A, Crouch DH, Macluskey M
Head and neck pathology 2019 Jun;13(2):188-197
Head and neck pathology 2019 Jun;13(2):188-197
Establishment of three novel cell lines derived from African American patients with colorectal carcinoma: A unique tool for assessing racial health disparity.
Paredes J, Ji P, Lacomb JF, Shroyer KR, Martello LA, Williams JL
International journal of oncology 2018 Oct;53(4):1516-1528
International journal of oncology 2018 Oct;53(4):1516-1528
NHERF1 and tumor microenvironment: a new scene in invasive breast carcinoma.
Saponaro C, Vagheggini A, Scarpi E, Centonze M, Catacchio I, Popescu O, Pastena MI, Giotta F, Silvestris N, Mangia A
Journal of experimental & clinical cancer research : CR 2018 May 2;37(1):96
Journal of experimental & clinical cancer research : CR 2018 May 2;37(1):96
Hierarchical clustering analysis identifies metastatic colorectal cancers patients with more aggressive phenotype.
Opinto G, Silvestris N, Centonze M, Graziano G, Pinto R, Fucci L, Simone G, Mangia A
Oncotarget 2017 Oct 20;8(50):87782-87794
Oncotarget 2017 Oct 20;8(50):87782-87794
Similar expression pattern of NHERF1 and EZRIN in papillary but not in solid areas of human serous ovarian carcinomas.
Demacopulo B, Lema BE, Cabrini RL, Kreimann EL
Acta histochemica 2016 Oct;118(8):797-805
Acta histochemica 2016 Oct;118(8):797-805
β-catenin interaction with NHERF1 and RASSF1A methylation in metastatic colorectal cancer patients.
Schirosi L, Mazzotta A, Opinto G, Pinto R, Graziano G, Tommasi S, Fucci L, Simone G, Mangia A
Oncotarget 2016 Oct 18;7(42):67841-67850
Oncotarget 2016 Oct 18;7(42):67841-67850
Correctors of mutant CFTR enhance subcortical cAMP-PKA signaling through modulating ezrin phosphorylation and cytoskeleton organization.
Abbattiscianni AC, Favia M, Mancini MT, Cardone RA, Guerra L, Monterisi S, Castellani S, Laselva O, Di Sole F, Conese M, Zaccolo M, Casavola V
Journal of cell science 2016 Mar 15;129(6):1128-40
Journal of cell science 2016 Mar 15;129(6):1128-40
NHERF1/EBP50 Suppresses Wnt-β-Catenin Pathway-Driven Intestinal Neoplasia.
Georgescu MM, Gagea M, Cote G
Neoplasia (New York, N.Y.) 2016 Aug;18(8):512-23
Neoplasia (New York, N.Y.) 2016 Aug;18(8):512-23
The potential predictive role of nuclear NHERF1 expression in advanced gastric cancer patients treated with epirubicin/oxaliplatin/capecitabine first line chemotherapy.
Mangia A, Caldarola L, Dell'Endice S, Scarpi E, Saragoni L, Monti M, Santini D, Brunetti O, Simone G, Silvestris N
Cancer biology & therapy 2015;16(8):1140-7
Cancer biology & therapy 2015;16(8):1140-7
Immunoprofile from tissue microarrays to stratify familial breast cancer patients.
Schirosi L, De Summa S, Tommasi S, Paradiso A, Sambiasi D, Popescu O, Simone G, Mangia A
Oncotarget 2015 Sep 29;6(29):27865-79
Oncotarget 2015 Sep 29;6(29):27865-79
Fine Needle Aspiration Cytology: A Tool to Study NHERF1 Expression as a Potential Marker of Aggressiveness in Lung Cancer.
Mangia A, Partipilo G, Schirosi L, Saponaro C, Galetta D, Catino A, Scattone A, Simone G
Molecular biotechnology 2015 Jun;57(6):549-57
Molecular biotechnology 2015 Jun;57(6):549-57
The tight-junction protein claudin-6 induces epithelial differentiation from mouse F9 and embryonic stem cells.
Sugimoto K, Ichikawa-Tomikawa N, Satohisa S, Akashi Y, Kanai R, Saito T, Sawada N, Chiba H
PloS one 2013;8(10):e75106
PloS one 2013;8(10):e75106
Characterization of CFTR High Expresser cells in the intestine.
Jakab RL, Collaco AM, Ameen NA
American journal of physiology. Gastrointestinal and liver physiology 2013 Sep 15;305(6):G453-65
American journal of physiology. Gastrointestinal and liver physiology 2013 Sep 15;305(6):G453-65
Nuclear NHERF1 expression as a prognostic marker in breast cancer.
Paradiso A, Scarpi E, Malfettone A, Addati T, Giotta F, Simone G, Amadori D, Mangia A
Cell death & disease 2013 Nov 7;4(11):e904
Cell death & disease 2013 Nov 7;4(11):e904
High density of tryptase-positive mast cells in human colorectal cancer: a poor prognostic factor related to protease-activated receptor 2 expression.
Malfettone A, Silvestris N, Saponaro C, Ranieri G, Russo A, Caruso S, Popescu O, Simone G, Paradiso A, Mangia A
Journal of cellular and molecular medicine 2013 Aug;17(8):1025-37
Journal of cellular and molecular medicine 2013 Aug;17(8):1025-37
Involvement of nuclear NHERF1 in colorectal cancer progression.
Mangia A, Saponaro C, Malfettone A, Bisceglie D, Bellizzi A, Asselti M, Popescu O, Reshkin SJ, Paradiso A, Simone G
Oncology reports 2012 Sep;28(3):889-94
Oncology reports 2012 Sep;28(3):889-94
PTEN, NHERF1 and PHLPP form a tumor suppressor network that is disabled in glioblastoma.
Molina JR, Agarwal NK, Morales FC, Hayashi Y, Aldape KD, Cote G, Georgescu MM
Oncogene 2012 Mar 8;31(10):1264-74
Oncogene 2012 Mar 8;31(10):1264-74
Peritumoral vascular invasion and NHERF1 expression define an immunophenotype of grade 2 invasive breast cancer associated with poor prognosis.
Malfettone A, Saponaro C, Paradiso A, Simone G, Mangia A
BMC cancer 2012 Mar 22;12:106
BMC cancer 2012 Mar 22;12:106
Overexpression of nuclear NHERF1 in advanced colorectal cancer: association with hypoxic microenvironment and tumor invasive phenotype.
Malfettone A, Silvestris N, Paradiso A, Mattioli E, Simone G, Mangia A
Experimental and molecular pathology 2012 Jun;92(3):296-303
Experimental and molecular pathology 2012 Jun;92(3):296-303
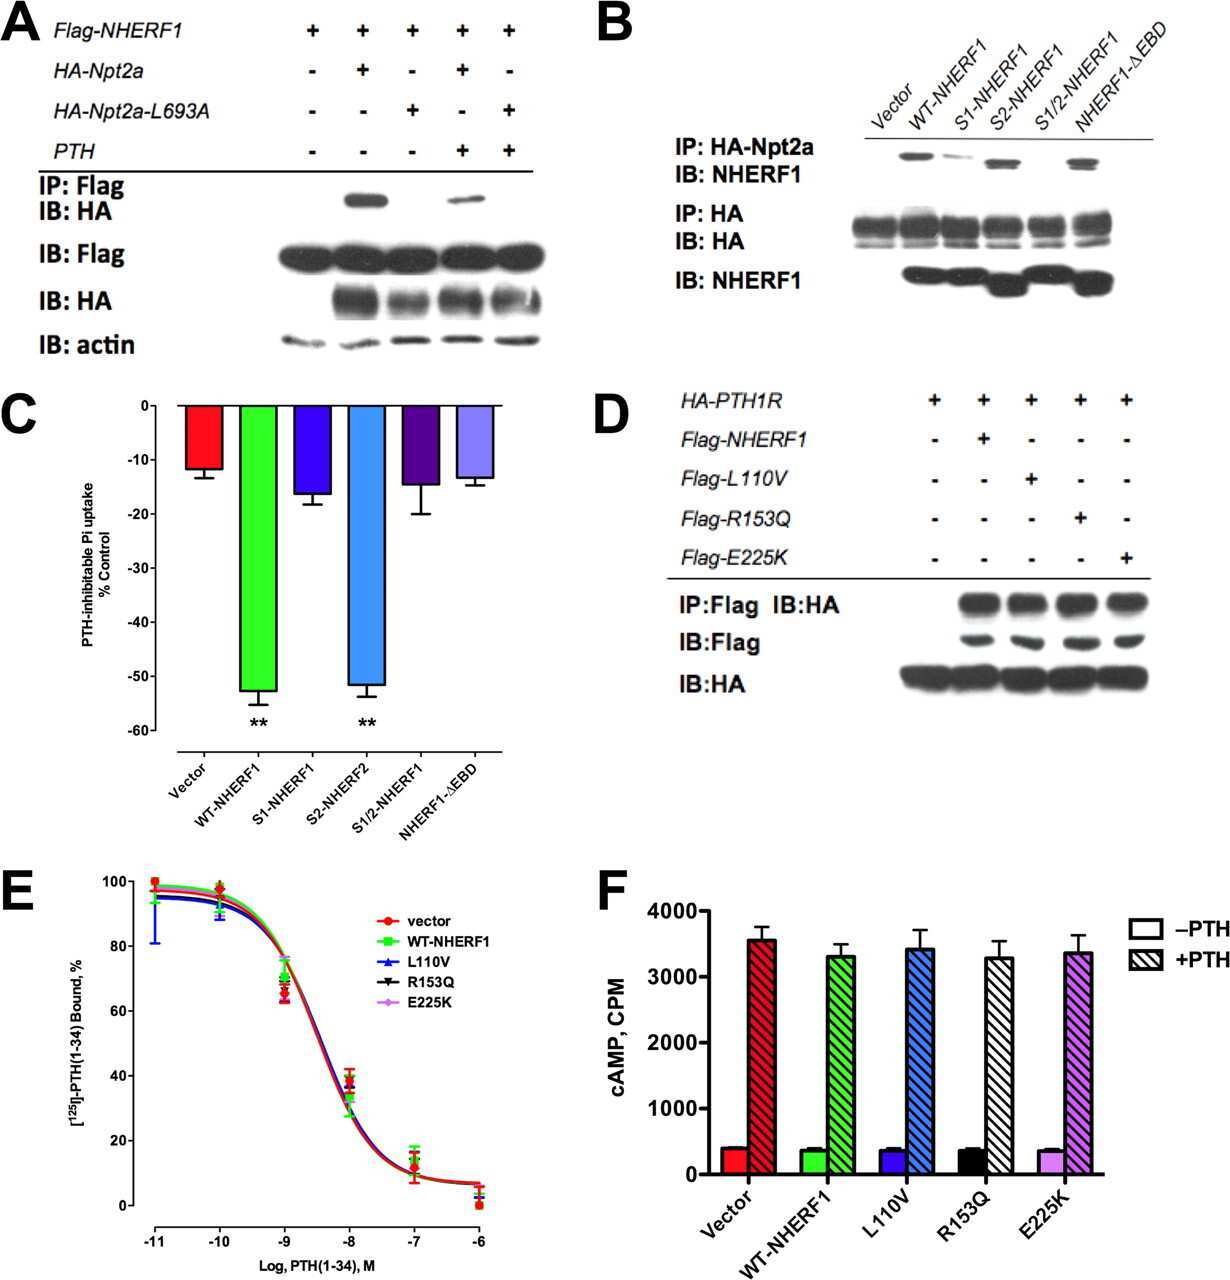
Ezrin-anchored protein kinase A coordinates phosphorylation-dependent disassembly of a NHERF1 ternary complex to regulate hormone-sensitive phosphate transport.
Wang B, Means CK, Yang Y, Mamonova T, Bisello A, Altschuler DL, Scott JD, Friedman PA
The Journal of biological chemistry 2012 Jul 13;287(29):24148-63
The Journal of biological chemistry 2012 Jul 13;287(29):24148-63
Na+/H+ exchanger regulatory factor 1 (NHERF1) directly regulates osteogenesis.
Liu L, Alonso V, Guo L, Tourkova I, Henderson SE, Almarza AJ, Friedman PA, Blair HC
The Journal of biological chemistry 2012 Dec 21;287(52):43312-21
The Journal of biological chemistry 2012 Dec 21;287(52):43312-21
Human epidermal growth factor receptor 2, Na+/H+ exchanger regulatory factor 1, and breast cancer susceptibility gene-1 as new biomarkers for familial breast cancers.
Mangia A, Malfettone A, Saponaro C, Tommasi S, Simone G, Paradiso A
Human pathology 2011 Nov;42(11):1589-95
Human pathology 2011 Nov;42(11):1589-95
Na+/H+ exchanger regulatory factor 1 expression levels in blood and tissue predict breast tumour clinical behaviour.
Bellizzi A, Mangia A, Malfettone A, Cardone RA, Simone G, Reshkin SJ, Paradiso A
Histopathology 2011 Jun;58(7):1086-95
Histopathology 2011 Jun;58(7):1086-95
Quantitative protein and mRNA profiling shows selective post-transcriptional control of protein expression by vasopressin in kidney cells.
Khositseth S, Pisitkun T, Slentz DH, Wang G, Hoffert JD, Knepper MA, Yu MJ
Molecular & cellular proteomics : MCP 2011 Jan;10(1):M110.004036
Molecular & cellular proteomics : MCP 2011 Jan;10(1):M110.004036
Ezrin and EBP50 redistribute apically in rat uterine epithelial cells at the time of implantation and in response to cell contact.
Lecce L, Lindsay LA, Murphy CR
Cell and tissue research 2011 Feb;343(2):445-53
Cell and tissue research 2011 Feb;343(2):445-53
Expression of NHERF1 in colonic tumors induced by 1,2-dimethylhydrazine in rats is independent of plasma ovarian steroids.
Troncoso M, Cuello Carrión FD, Guiñazu E, Fanelli MA, Montt-Guevara M, Cabrini RL, Carón RW, Kreimann EL
Hormones & cancer 2011 Aug;2(4):214-23
Hormones & cancer 2011 Aug;2(4):214-23
A hierarchy of signals regulates entry of membrane proteins into the ciliary membrane domain in epithelial cells.
Francis SS, Sfakianos J, Lo B, Mellman I
The Journal of cell biology 2011 Apr 4;193(1):219-33
The Journal of cell biology 2011 Apr 4;193(1):219-33
Estrogens regulate the expression of NHERF1 in normal colon during the reproductive cycle of Wistar rats.
Cuello-Carrión FD, Troncoso M, Guiñazu E, Valdez SR, Fanelli MA, Ciocca DR, Kreimann EL
Histochemistry and cell biology 2010 Dec;134(6):623-30
Histochemistry and cell biology 2010 Dec;134(6):623-30
Na/H exchanger regulatory factors control parathyroid hormone receptor signaling by facilitating differential activation of G(alpha) protein subunits.
Wang B, Ardura JA, Romero G, Yang Y, Hall RA, Friedman PA
The Journal of biological chemistry 2010 Aug 27;285(35):26976-26986
The Journal of biological chemistry 2010 Aug 27;285(35):26976-26986
Biological role of NHERF1 protein expression in breast cancer.
Mangia A, Chiriatti A, Bellizzi A, Malfettone A, Stea B, Zito FA, Reshkin SJ, Simone G, Paradiso A
Histopathology 2009 Nov;55(5):600-8
Histopathology 2009 Nov;55(5):600-8
Hepatocyte nuclear factor 4alpha, a key factor for homeostasis, cell architecture, and barrier function of the adult intestinal epithelium.
Cattin AL, Le Beyec J, Barreau F, Saint-Just S, Houllier A, Gonzalez FJ, Robine S, Pinçon-Raymond M, Cardot P, Lacasa M, Ribeiro A
Molecular and cellular biology 2009 Dec;29(23):6294-308
Molecular and cellular biology 2009 Dec;29(23):6294-308
Proteomic analysis of peripheral blood mononuclear cells: selective protein processing observed in patients with rheumatoid arthritis.
Schulz M, Dotzlaw H, Mikkat S, Eggert M, Neeck G
Journal of proteome research 2007 Sep;6(9):3752-9
Journal of proteome research 2007 Sep;6(9):3752-9
Expression and clinicopathological significance of oestrogen-responsive ezrin-radixin-moesin-binding phosphoprotein 50 in breast cancer.
Song J, Bai J, Yang W, Gabrielson EW, Chan DW, Zhang Z
Histopathology 2007 Jul;51(1):40-53
Histopathology 2007 Jul;51(1):40-53
Expression of ion transport-associated proteins in human efferent and epididymal ducts.
Kujala M, Hihnala S, Tienari J, Kaunisto K, Hästbacka J, Holmberg C, Kere J, Höglund P
Reproduction (Cambridge, England) 2007 Apr;133(4):775-84
Reproduction (Cambridge, England) 2007 Apr;133(4):775-84
Receptor activity-modifying protein (RAMP) isoform-specific regulation of adrenomedullin receptor trafficking by NHERF-1.
Bomberger JM, Spielman WS, Hall CS, Weinman EJ, Parameswaran N
The Journal of biological chemistry 2005 Jun 24;280(25):23926-35
The Journal of biological chemistry 2005 Jun 24;280(25):23926-35
Activation-independent parathyroid hormone receptor internalization is regulated by NHERF1 (EBP50).
Sneddon WB, Syme CA, Bisello A, Magyar CE, Rochdi MD, Parent JL, Weinman EJ, Abou-Samra AB, Friedman PA
The Journal of biological chemistry 2003 Oct 31;278(44):43787-96
The Journal of biological chemistry 2003 Oct 31;278(44):43787-96
A macromolecular complex of beta 2 adrenergic receptor, CFTR, and ezrin/radixin/moesin-binding phosphoprotein 50 is regulated by PKA.
Naren AP, Cobb B, Li C, Roy K, Nelson D, Heda GD, Liao J, Kirk KL, Sorscher EJ, Hanrahan J, Clancy JP
Proceedings of the National Academy of Sciences of the United States of America 2003 Jan 7;100(1):342-6
Proceedings of the National Academy of Sciences of the United States of America 2003 Jan 7;100(1):342-6
Foxj1 is required for apical localization of ezrin in airway epithelial cells.
Huang T, You Y, Spoor MS, Richer EJ, Kudva VV, Paige RC, Seiler MP, Liebler JM, Zabner J, Plopper CG, Brody SL
Journal of cell science 2003 Dec 15;116(Pt 24):4935-45
Journal of cell science 2003 Dec 15;116(Pt 24):4935-45
Ezrin-radixin-moesin-binding phosphoprotein 50 is expressed at the apical membrane of rat liver epithelia.
Fouassier L, Duan CY, Feranchak AP, Yun CH, Sutherland E, Simon F, Fitz JG, Doctor RB
Hepatology (Baltimore, Md.) 2001 Jan;33(1):166-76
Hepatology (Baltimore, Md.) 2001 Jan;33(1):166-76
Evidence for ezrin-radixin-moesin-binding phosphoprotein 50 (EBP50) self-association through PDZ-PDZ interactions.
Fouassier L, Yun CC, Fitz JG, Doctor RB
The Journal of biological chemistry 2000 Aug 11;275(32):25039-45
The Journal of biological chemistry 2000 Aug 11;275(32):25039-45
No comments: Submit comment
Supportive validation
- Submitted by
- Invitrogen Antibodies (provider)
- Main image

- Experimental details
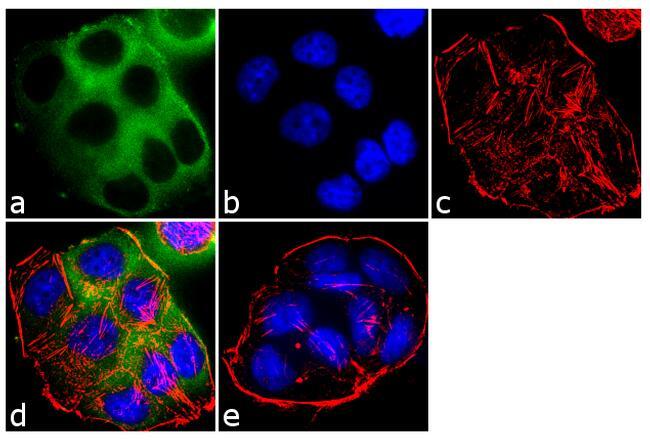
- Immunofluorescent analysis of EBP50 was performed using 70% confluent log phase T-47D cells. The cells were fixed with 4% paraformaldehyde for 10 minutes, permeabilized with 0.1% Triton™ X-100 for 10 minutes, and blocked with 1% BSA for 1 hour at room temperature. The cells were labeled with EBP50 Rabbit Polyclonal Antibody (Product # PA1-090) at 2 µg/mL in 0.1% BSA and incubated for 3 hours at room temperature and then labeled with Goat anti-Rabbit IgG (H+L) Superclonal™ Secondary Antibody, Alexa Fluor® 488 conjugate (Product # A27034) a dilution of 1:2000 for 45 minutes at room temperature (Panel a: green). Nuclei (Panel b: blue) were stained with SlowFade® Gold Antifade Mountant with DAPI (Product # S36938). F-actin (Panel c: red) was stained with Alexa Fluor® 555 Rhodamine Phalloidin (Product # R415, 1:300). Panel d represents the merged image showing cytoplasmic localization. Panel e shows the no primary antibody control. The images were captured at 60X magnification.

- Submitted by
- Invitrogen Antibodies (provider)
- Main image

- Experimental details
- Immunofluorescent analysis of EBP50 was performed using 70% confluent log phase T-47D cells. The cells were fixed with 4% paraformaldehyde for 10 minutes, permeabilized with 0.1% Triton™ X-100 for 10 minutes, and blocked with 1% BSA for 1 hour at room temperature. The cells were labeled with EBP50 Rabbit Polyclonal Antibody (Product # PA1-090) at 2 µg/mL in 0.1% BSA and incubated for 3 hours at room temperature and then labeled with Goat anti-Rabbit IgG (Heavy Chain) Superclonal™ Secondary Antibody, Alexa Fluor® 488 conjugate (Product # A27034) a dilution of 1:2000 for 45 minutes at room temperature (Panel a: green). Nuclei (Panel b: blue) were stained with SlowFade® Gold Antifade Mountant with DAPI (Product # S36938). F-actin (Panel c: red) was stained with Alexa Fluor® 555 Rhodamine Phalloidin (Product # R415, 1:300). Panel d represents the merged image showing cytoplasmic localization. Panel e shows the no primary antibody control. The images were captured at 60X magnification.
Supportive validation
- Submitted by
- Invitrogen Antibodies (provider)
- Main image
- Experimental details
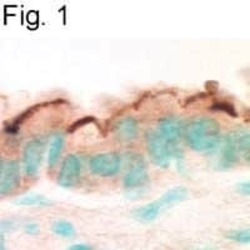
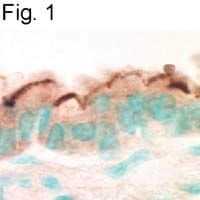
- Immunohistochemical staining of EBP50 in mouse airway using Product # PA1-090.
Supportive validation
- Submitted by
- Invitrogen Antibodies (provider)
- Main image
- Experimental details
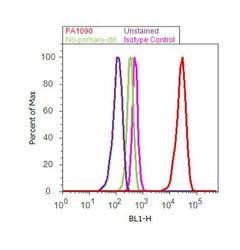
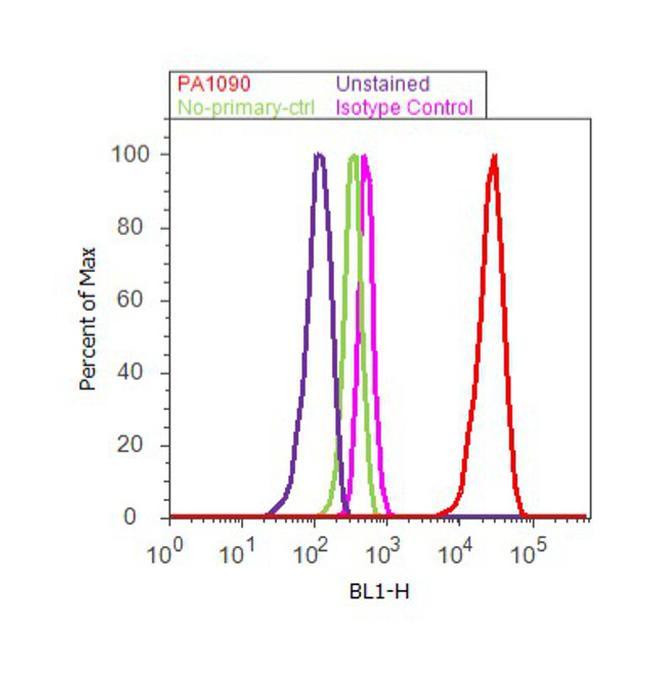
- Flow cytometry analysis of EBP50 was done on MCF7 cells. Cells were fixed with 70% ethanol for 10 minutes, permeabilized with 0.25% Triton™ X-100 for 20 minutes, and blocked with 5% BSA for 30 minutes at room temperature. Cells were labeled with EBP50 Rabbit Polyclonal Antibody (PA1-090, red histogram) or with rabbit isotype control (pink histogram) at 3-5 ug/million cells in 2.5% BSA. After incubation at room temperature for 2 hours, the cells were labeled with Alexa Fluor® 488 Goat Anti-Rabbit Secondary Antibody (A11008) at a dilution of 1:400 for 30 minutes at room temperature. The representative 10, 000 cells were acquired and analyzed for each sample using an Attune® Acoustic Focusing Cytometer. The purple histogram represents unstained control cells and the green histogram represents no-primary-antibody control.
Supportive validation
- Submitted by
- Invitrogen Antibodies (provider)
- Main image
- Experimental details
- NULL
- Submitted by
- Invitrogen Antibodies (provider)
- Main image
- Experimental details
- NULL
- Submitted by
- Invitrogen Antibodies (provider)
- Main image
- Experimental details
- NULL

- Submitted by
- Invitrogen Antibodies (provider)
- Main image
- Experimental details
- NULL
- Submitted by
- Invitrogen Antibodies (provider)
- Main image
- Experimental details
- NULL
- Submitted by
- Invitrogen Antibodies (provider)
- Main image

- Experimental details
- NULL
- Submitted by
- Invitrogen Antibodies (provider)
- Main image
- Experimental details
- NULL
- Submitted by
- Invitrogen Antibodies (provider)
- Main image

- Experimental details
- NULL
- Submitted by
- Invitrogen Antibodies (provider)
- Main image
- Experimental details
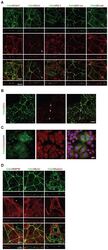
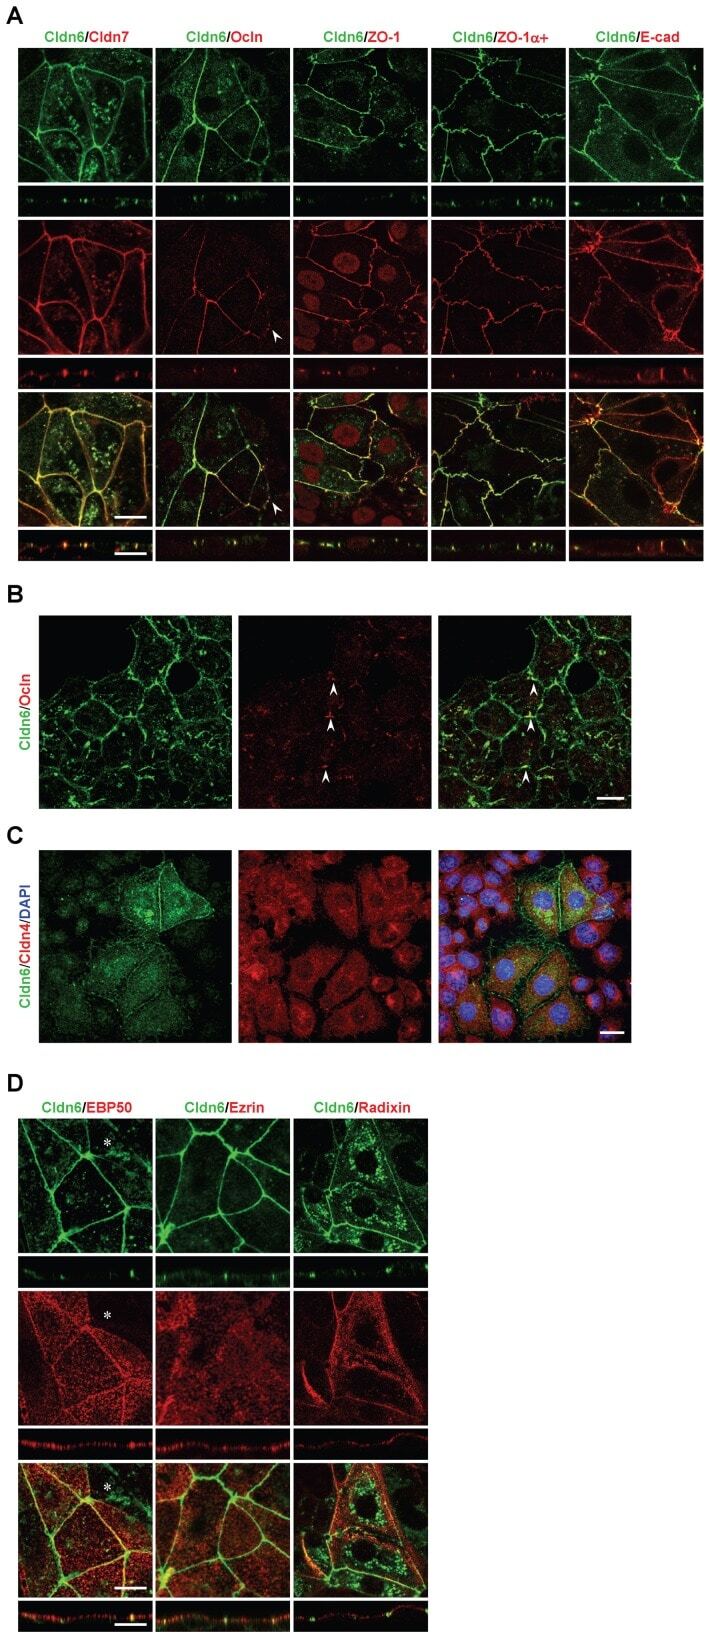
- Figure 2 Cldn6 induces the formation of cell-cell junctions and apicobasal cell polarity in F9 stem cells. (A and D) X-Y and Z projections of F9:Cldn6 cells stained for Cldn6 together with the tight-junction markers (Cldn7, Ocln, ZO-1, and ZO-1alpha+ variant), the basolateral maker (E-Cad), and the apical markers (ezrin, radixin, and EBP50). The arrowhead indicates the recruitment of Ocln to a part of Cldn6-positive premmature cell-cell junctions. The asterisk shows the absence of EBP50 on the apical surfaces of undifferentiated cells possessing Cldn6-positive premature cell-cell junctions. Scale bars, 20 um. (B) Confocal images of undifferentiated areas of F9:Cldn6 cells stained for Cldn6 together with Ocln. The arrowheads indicate the partial recruitment of Ocln to Cldn6-positive cell borders of undifferentiated cells. Scale bar, 20 um. (C) Confocal images of F9:Cldn6 cells stained for Cldn6 together with Cldn4 and DAPI. Scale bar, 20 um.
- Submitted by
- Invitrogen Antibodies (provider)
- Main image
- Experimental details
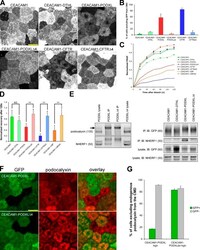
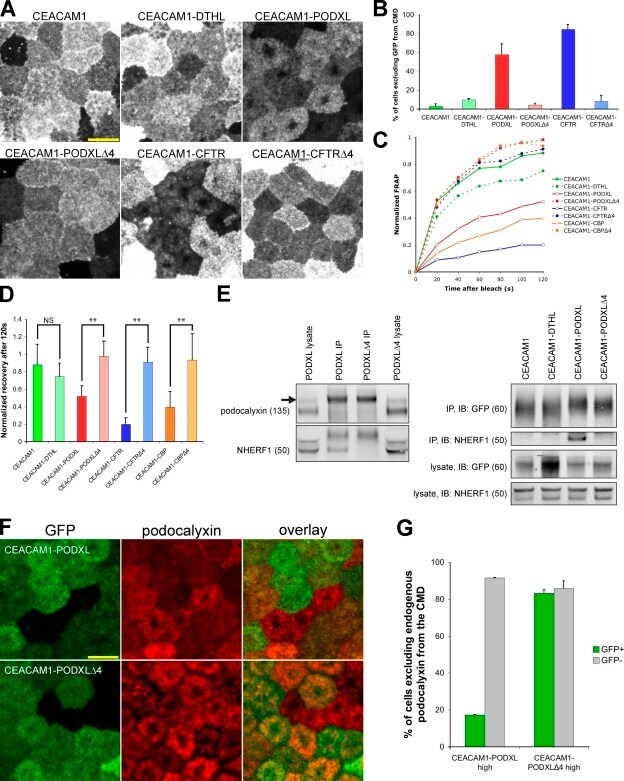
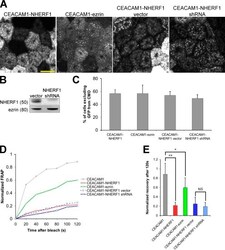
- Figure 5. CEACAM1 can be excluded from the CMD by adding tails from NHERF1-binding proteins. (A) GFP-CEACAM1-based constructs differ in their exclusion from the CMD 4 d after seeding. Images were collected with identical microscope settings to Fig. 1 C . (B) Cells were scored for GFP exclusion from the CMD as in Fig. 1 C . Only 5/169 cells appeared to exclude GFP-CEACAM1 from the CMD, and GFP-CEACAM1-DTHL (13/135), GFP-CEACAM1-PODXLDelta4 (10/237), and GFP-CEACAM1-CFTRDelta4 (12/148) were similar, whereas GFP-CEACAM1-PODXL (146/253) and GFP-CEACAM1-CFTR (94/111) were excluded from the CMD in most cells. (C) FRAP measurements indicated that GFP-CEACAM1 constructs that were excluded from the CMD were also less mobile in the apical membrane. (D) There was no significant difference between FRAP measurements of GFP-CEACAM1 and GFP-CEACAM1-DTHL after 120 s; however, there were significant differences between GFP-CEACAM1-PODXL and GFP-CEACAM1-PODXLDelta4, GFP-CEACAM1-CFTR and GFP-CEACAM1-CFTRDelta4, and GFP-CEACAM1-CBP and GFP-CEACAM1-CBPDelta4 (P < 0.005). (C and D) Each FRAP value is a mean of measurements from eight cells. Error bars represent standard deviation between measurements. (E) Cells expressing GFP constructs were grown on tissue culture plates and lysed when confluent. GFP constructs were immunoprecipitated from cell lysates, eluted, and Western blotted. Membranes were probed with anti-NHERF1 and either anti-GFP or anti-gp135 antibodies. The arrow to the left of the po
- Submitted by
- Invitrogen Antibodies (provider)
- Main image
- Experimental details
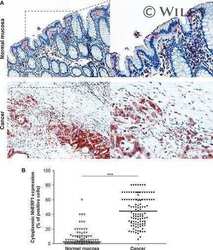
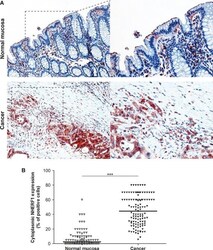
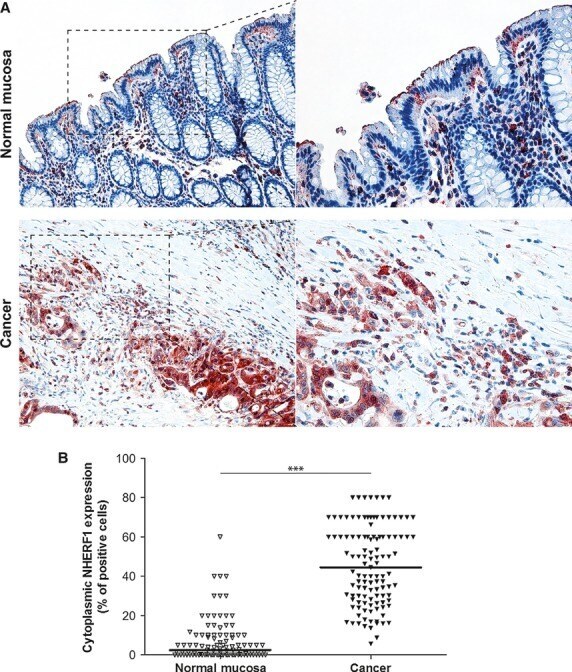
- Fig. 3 Expression analysis of cytoplasmic NHERF1 in human colorectal cancer. ( A ) Representative images of cytoplasmic NHERF1 immunoreactivity in the primary tumour matched with adjacent cancer-uninvolved colonic mucosa by immunohistochemistry (Original magnification on the left x100, enlargement on the right x200). ( B ) The distribution of cytoplasmic NHERF1(+) cells on normal mucosa and the tumour compartment of the same colonic lesion. (Horizontal bold line = median value; *** P < 0.0001).
- Submitted by
- Invitrogen Antibodies (provider)
- Main image
- Experimental details
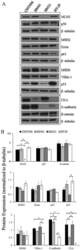
- Figure 3 The expression of proteins associated with colorectal carcinoma (CRC) tumorigenesis and metastasis was determined in the novel African American CRC lines by immunoblotting. (A) Qualitative analysis of CHTN06, SB501 and SB521 and HT-29, a Caucasian American CRC cell line, for protein expression of beta-catenin, p53, nuclear factor (NF)-kappaB (p50 and p65), villin-1, MSH2, MSH6, MLH1 and ezrin. (B) Semi-quantitative densitometry was performed by normalizing protein expression to the respective beta-tubulin loading control. Data were generated from three independent experiments. CEA, carcinoembryonic antigen.
- Submitted by
- Invitrogen Antibodies (provider)
- Main image
- Experimental details
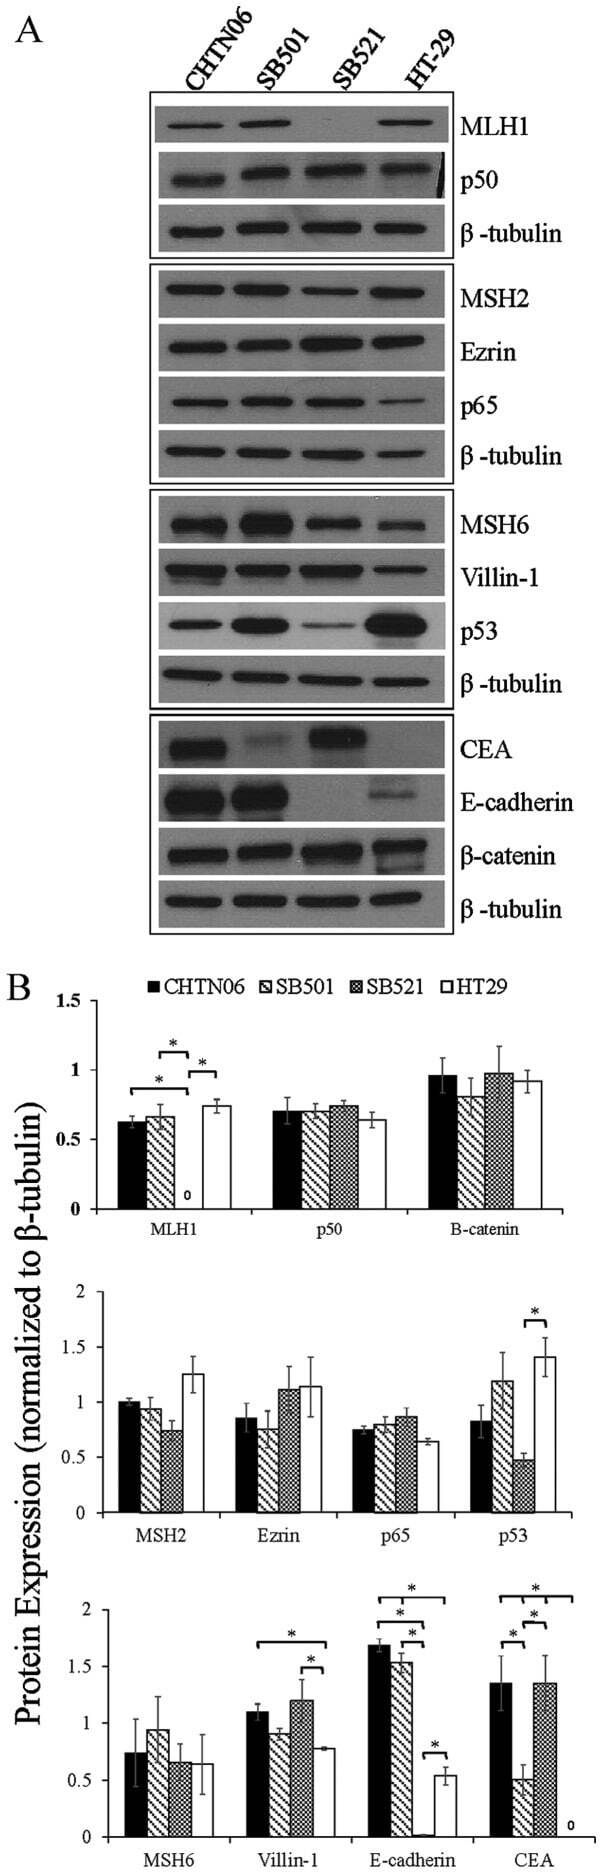
- Figure 3. CMD exclusion of GFP-PODXL is dependent on NHERF1. (A) NHERF1 was knocked down in GFP-PODXL cells (NHERF1 shRNA) using a retroviral shRNA system. Control cells expressing GFP-PODXL (vector) were retrovirally transduced with a puromycin resistance plasmid without an shRNA sequence. Cell lysates were blotted with anti-NHERF1 and antiezrin antibodies. Molecular mass is indicated in kilodaltons. (B) Live imaging of cells 4 d after seeding revealed that control cells (vector) exclude GFP-PODXL from the CMD but NHERF1 shRNA cells do not. Exclusion was quantified as in Fig. 1 C , and the percentage of cells excluding GFP-PODXL from the CMD appears on each image. 148/230 control cells (vector) excluded GFP-PODXL from the CMD, whereas very few cells expressing NHERF1 shRNA (8/186) excluded GFP-PODXL. Images were collected with identical microscope settings to Fig. 1 C . (C) Knocking down NHERF1 allowed GFP-PODXL to enter primary cilia. Cells were imaged live 12 d after seeding on filters. (top row) Z stacks of the apical membrane of control (vector) or NHERF1 shRNA live cells expressing GFP-PODXL were projected into a single image. Images were collected with identical microscope settings to Fig. 1 C , but at lower digital zoom. (bottom row) Single confocal sections above the apical membrane were taken from the z stacks in the top row, and image brightness was increased. Visible cilia are labeled with arrowheads. (D) 12 d after seeding, NHERF1 shRNA and control cells (vector)

- Submitted by
- Invitrogen Antibodies (provider)
- Main image
- Experimental details
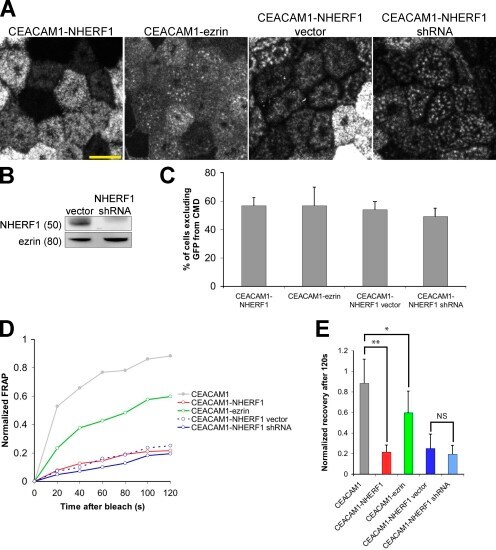
- Figure 6. CEACAM1 can be excluded from the CMD independently of NHERF1 by adding domains that bind more directly to the cytoskeleton. (A) Addition of NHERF1's ERM-binding domain or ezrin's actin-binding domain is sufficient to exclude GFP-CEACAM1 from the CMD 4 d after seeding. NHERF1 was knocked down in GFP-CEACAM1-NHERF1 cells (GFP-CEACAM1-NHERF1 shRNA), and exclusion was similar to control cells (GFP-CEACAM1-NHERF1 vector). Images were collected with identical microscope settings to Fig. 1 C . (B) GFP-CEACAM1-NHERF1 shRNA and GFP-CEACAM1-NHERF1 vector cell lysates were blotted with anti-NHERF1 and antiezrin antibodies. Molecular mass is indicated in kilodaltons. (C) Cells were scored for GFP exclusion from the CMD as in Fig. 1 C . 113/199 cells expressing GFP-CEACAM1-NHERF1 appeared to exclude the construct from the CMD, and similar results were seen for GFP-CEACAM1-ezrin (105/185). After shRNA knockdown of NHERF1, GFP-CEACAM1-NHERF1 was excluded from the CMD in 193/393 cells, a similar ratio to cells only treated with vector (125/232). Error bars represent standard deviation between experiments. (D) FRAP measurements indicated that GFP-CEACAM1 was less mobile in the apical membrane after addition of an ERM- or actin-binding domain, and this was independent of NHERF1 knockdown. (E) There are significant differences in the FRAP measurements between GFP-CEACAM1 and both GFP-CEACAM1-NHERF1 (**, P < 0.005) and GFP-CEACAM1-ezrin (*, P < 0.05) after 120 s. No significa
- Submitted by
- Invitrogen Antibodies (provider)
- Main image
- Experimental details
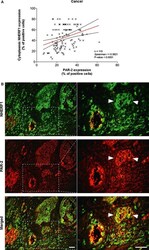
- Fig. 4 Analysis of PAR-2 and cytoplasmic NHERF1 in human colorectal cancer. As shown in ( A ), the correlation between protein expression of PAR-2 and cytoplasmic NHERF1 was evaluated by Spearman's rank correlation coefficient analysis, and a positive significant correlation was established. ( B ) A representative tissue sample stained with PAR-2 and EBP-50 antibodies and detected with Alexa Fluor 568 (red) and Alexa Fluor 488 (green) secondary antibodies, respectively, prior to fluorescence microscopy analysis. Overlaps between red and green signals (merged) point to co-localizations (in yellow). Arrowheads indicate invasive cells disseminated into the stroma close to a blood vessel with a high global expression of two proteins, where PAR-2 co-localized with NHERF1 on cytoplasmic and membranous compartments (scale bar = 20 mum).

- Submitted by
- Invitrogen Antibodies (provider)
- Main image
- Experimental details
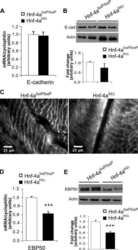
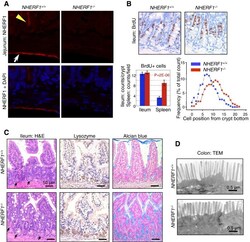
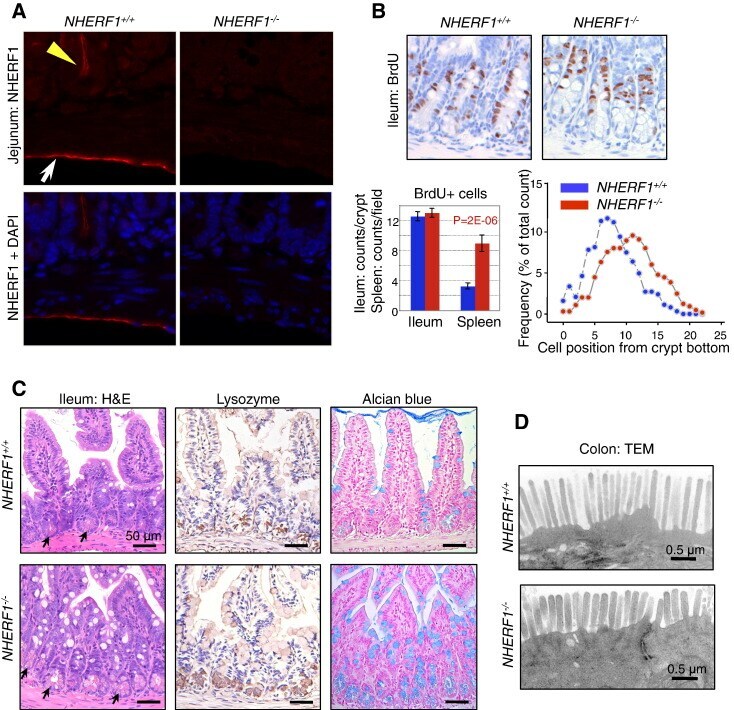
- Figure 2 Intestinal defects in NHERF1 -/- mice. (A) IF with NHERF1 antibody and DAPI for highlighting nuclei in NHERF1 -/- and NHERF1 +/+ mice shows high NHERF1 apical PM expression in intestinal epithelium (yellow arrowhead) and in the mesothelial lining of the serosa (arrow). (B) BrdU incorporation in 6-week-old NHERF1 +/+ and NHERF1 -/- female littermates showing similar numbers of BrdU+ cells in both genotypes and upper displacement of the BrdU+ progenitor cells in NHERF1 -/- crypts (right graph). Data are means +- SEM from 50 crypts. The cell position 0 was assigned for the bottom-most cell of every counted crypt. In contrast, NHERF1 -/- spleen BrdU+ counts show significantly enhanced proliferation. (C) H&E, lysozyme IHC for Paneth cells, and Alcian blue special stain for goblet cells of ileum sections show higher numbers of Paneth (arrows in H&E) and goblet cells in NHERF1 -/- versus NHERF1 +/+ mice. (D) Transmission electron microscopy (TEM) shows blunted microvilli in NHERF1 -/- colon epithelium.
- Submitted by
- Invitrogen Antibodies (provider)
- Main image
- Experimental details
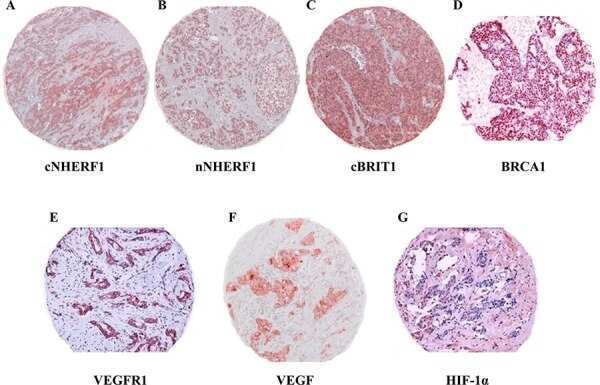
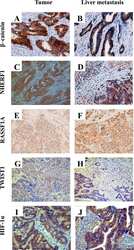
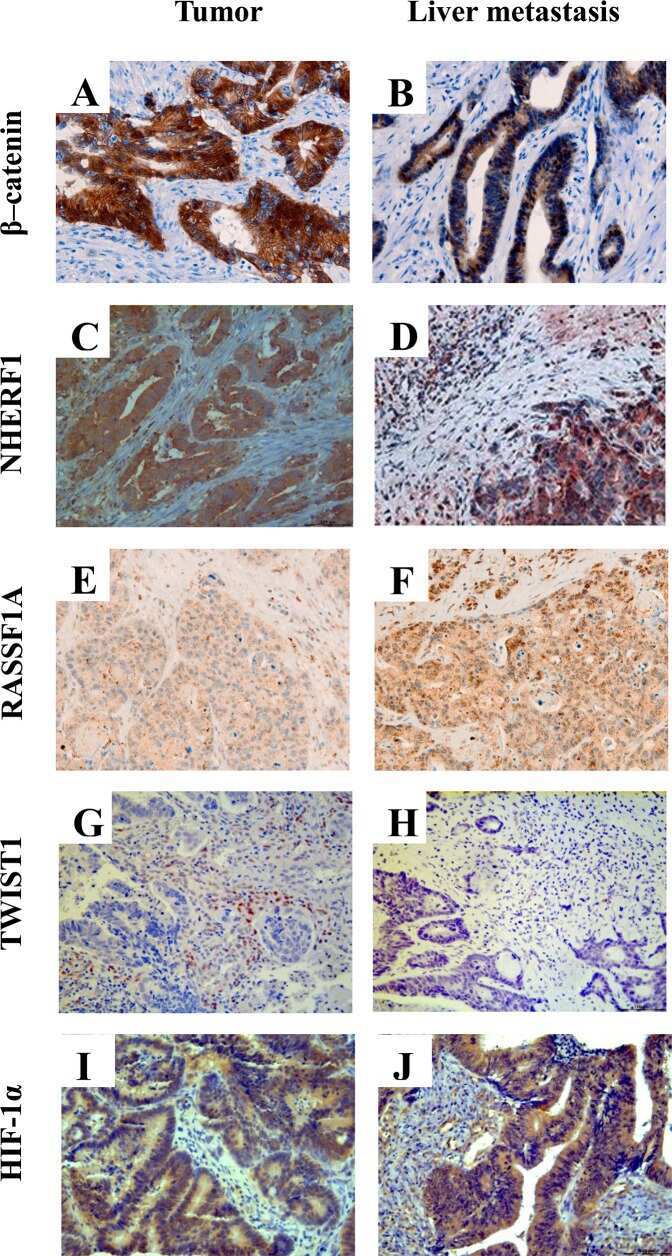
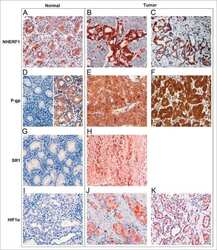
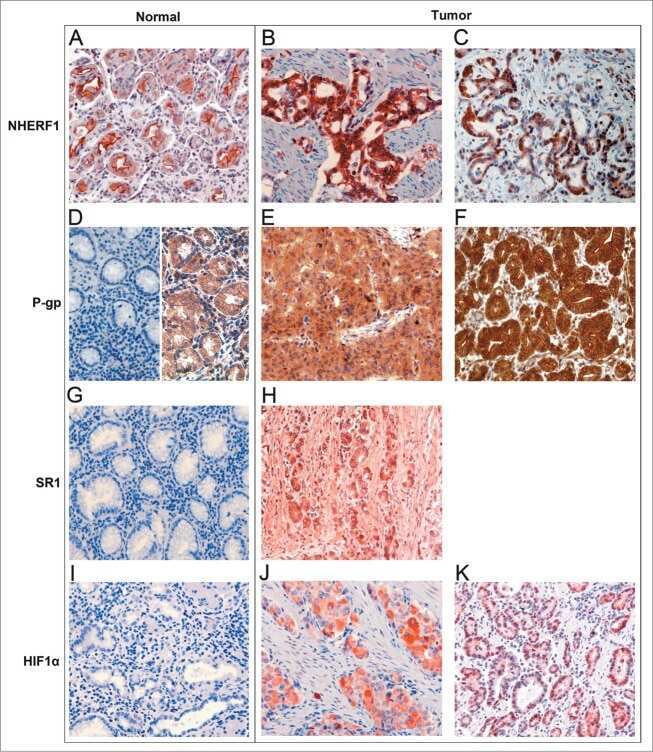
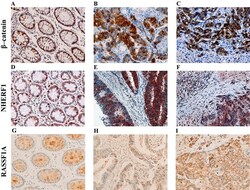
- Figure 1 Representative images of the immunoreactivity of beta-catenin, NHERF1 and RASSF1A Membrane and cytoplasmic localization of beta-catenin in ANT A. , membrane, cytoplasmic and nuclear expression in T B. , membrane, cytoplasmic and nuclear beta-catenin staining in LM C. NHERF1 immunoreactivity is present at the apical membrane, in cytoplasm and nucleus in ANT D. , while in T E. and LM F. it becomes mostly cytoplasmic and nuclear. Heterogeneous cytoplasmic staining intensity of RASSF1A in ANT G. , granular cytoplasmic staining in T H., cytoplasmic and nuclear immunoreactivity in LM I. (original magnification x200).

- Submitted by
- Invitrogen Antibodies (provider)
- Main image
- Experimental details
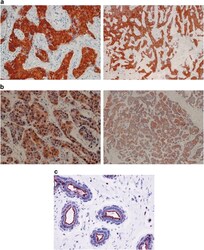
- Figure 1 Immunoreactivity and localization of NHERF1 in breast carcinoma. Representative images of immunohistochemical staining: ( a ) positive staining for cytoplasmic NHERF1 in tissue of poorly differentiated IDC (original magnification on the left x 20) and panoramic view of the tumor (original magnification on the right x 5); ( b ) NHERF1 antibody stained intensely in the cytoplasm and in the nucleus of the cells of poorly differentiated IDC (original magnification on the left x 20), and panoramic view of the tumor (original magnification on the right x 5); ( c ) apical membranous immunoreactivity of NHERF1 in non neoplastic epithelia cells (original magnification x 20)

- Submitted by
- Invitrogen Antibodies (provider)
- Main image
- Experimental details
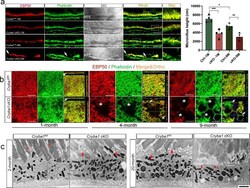
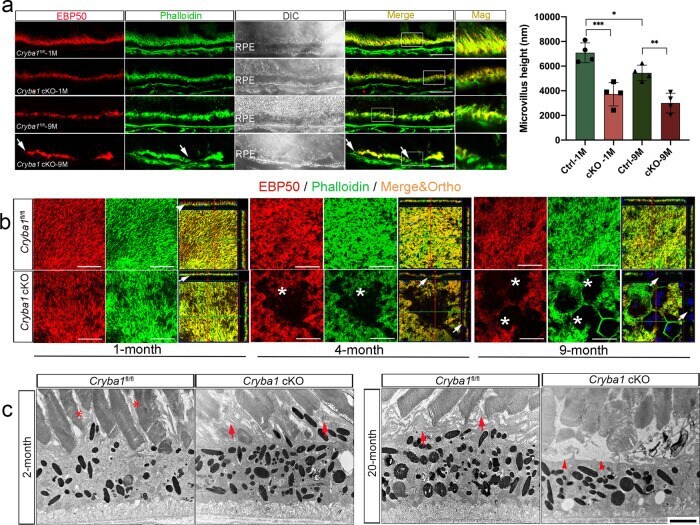
- Fig. 1 Cryba1 cKO RPE show age-related microvilli defects. a Immunostaining for EBP50 (red) and F-actin (phalloidin, green) on retina sections showed disorganized microvilli in 1-month-old cKO RPE cells, and microvilli loss (arrows) in RPE cells of 9-month-old cKO mice compared to age-matched control. Mag: magnified area outlined in merged image. DAPI (blue). Scale bar: 20 mum. Graph shows the average microvilli height in control and cKO retina sections measured by the length measurement tool in ZEN software based on the staining results. For each biological repeat, three representative values from different RPE locations (center, middle, peripheral) were averaged as the microvillus height. Differential interference contrast (DIC) microscopy showed the area of each sample for imaging. b Z-stack imaging for EBP50 (red) and F-actin (phalloidin, green) with an orthogonal projection showing upright and abundant microvilli in 1-month-old control (arrowhead), but not in cKO RPE cells (arrow). In 4-month-old mice, some cKO RPE cells presented collapsed microvilli indicated by sinking F-actin and EBP50 in the z -direction (arrows). Some RPE cells of 9-month-old cKO mice (asterisks) lacked microvilli completely. Scale bar: 20 mum. c TEM images of cKO and control retina sections. Two-month-old control mice exhibited microvilli very well interdigitated with photoreceptor outer segments (asterisks). Arrows show disorganized microvilli of RPE cells in 2-month-old cKO and 20-month-old cont
- Submitted by
- Invitrogen Antibodies (provider)
- Main image
- Experimental details
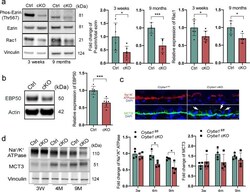
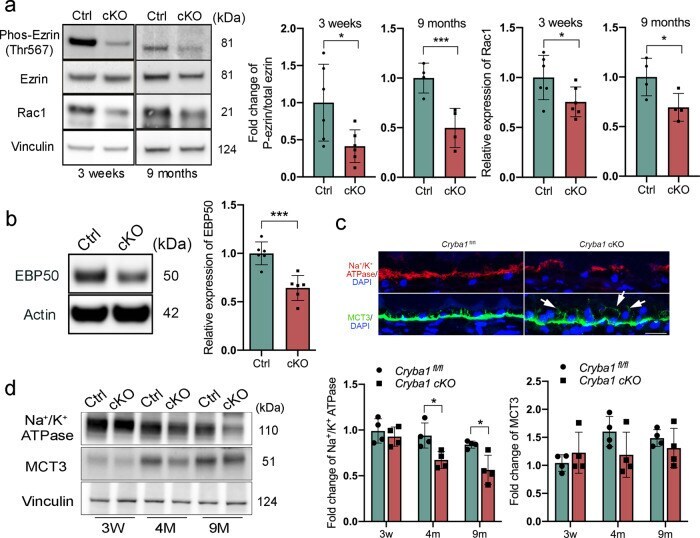
- Fig. 2 Disrupted apical-basal polarity in RPE cells lacking Cryba1 . a Western blot analysis of 3-week and 9-month-old RPE extracts showing that ezrin phosphorylation and Rac1 expression were reduced in cKO RPE cells at both ages. b Western blot analysis of 4-month-old RPE extracts confirmed downregulation of EBP50 protein in cKO RPE cells. c Immunostaining for Na + /K + ATPase and MCT3 on sections of 9-month-old retina showed reduced Na + /K + ATPase and mis-located MCT3 in Cryba1 cKO RPE cells (indicated by arrows). Scale bar: 20 mum. d Western blot analysis of RPE extracts from control and cKO mice at different ages showed reduced Na + /K + ATPase; however, there was no significant change in MCT3 abundance in cKO RPE. Statistical analysis was performed using either a two-tailed unpaired Student's t -test ( a , b ) or two-way ANOVA ( d ). * P < 0.05, *** P < 0.001, n = 4~6.
- Submitted by
- Invitrogen Antibodies (provider)
- Main image

- Experimental details
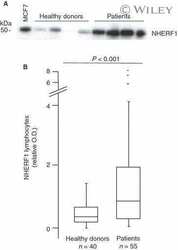
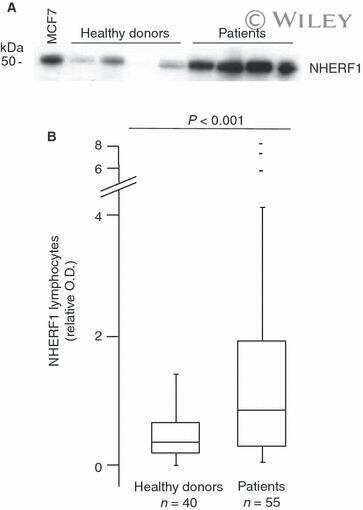
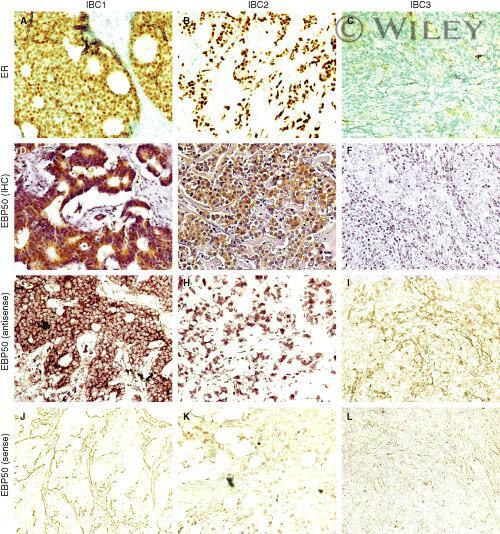
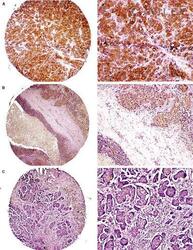
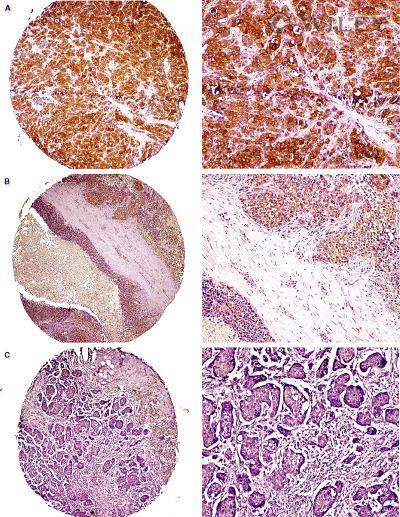
- 2 Correlation of ERM-binding phosphoprotein 50 (EBP50) immunoreactivity and mRNA expression in breast carcinoma. Examples of EBP50 protein and mRNA expression in oestrogen receptor (ER)-positive (IBC1 and IBC2) and ER- (IBC3) breast carcinomas. IBC1, with tumour involved in lymph nodes (N+); IBC2 and IBC3, without tumour involved in lymph nodes (N-). Staining in A , B and C represents immunohistochemical detection of ER protein. Strong ( D ) and weak ( E ) EBP50 immunoreactivity is found in IBC1 and IBC2, respectively, whereas negative staining ( F ) is indicated in IBC3. Similar patterns of immunoreactivity with EBP50 antisense probe are seen in G (strong), H (weak) and I (negative), suggesting that the mRNA expression of EBP50 correlates with its immunoreactivity in these tissue specimens. An EBP50 sense probe was used as a negative control for every specimen by hybridization on a consecutive section (no signals in J , K and L ).
- Submitted by
- Invitrogen Antibodies (provider)
- Main image
- Experimental details
- 4 Independent validation of immunohistochemical study on tissue microarrays. Examples of ERM-binding phosphoprotein 50 (EBP50) protein expression in oestrogen receptor (ER)-positive ( A,B ) and ER- ( C ) breast carcinoma. Strong and weak EBP50 immunoreactivity is found in cases A and B , respectively, whereas negative staining is indicated in case C .
- Submitted by
- Invitrogen Antibodies (provider)
- Main image

- Experimental details
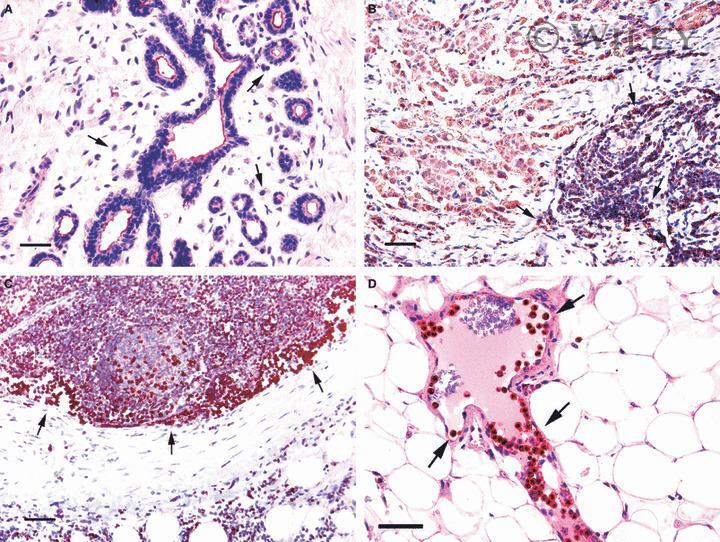
- 2 Na + /H + exchanger regulatory factor 1 (NHERF1) immunolocalization in well-organized and invaded lobules of the mammary gland and lymph node. In the non-tumour compartment ( A ) of the tissue, NHERF1 localized only apically in the epithelial cells lining the lobules, and some lymphocytes that are are not stained with NHERF1 are dispersed in the stroma (arrow). The invaded tissue ( B ) shows NHERF1 immunolocalization in the metastatic spreading cells and in the lymphocytes located in adjacent regions. Lymphocytes in metastatic lymph node ( C ) and peritumoral blood vessels ( D ) also show intense immunoreactivity. Bar: 32 mum.