Explore
 Validate
 Learn
Learn Immunocytochemistry
Antibody data
- Antibody Data
- Antigen structure
- References [1]
- Comments [0]
- Validations
- Immunocytochemistry [2]
- Immunohistochemistry [4]
- Other assay [3]
Submit
Validation data
Reference
Comment
Report error
- Product number
- PA5-55452 - Provider product page

- Provider
- Invitrogen Antibodies
- Product name
- SLC25A26 Polyclonal Antibody
- Antibody type
- Polyclonal
- Antigen
- Recombinant protein fragment
- Description
- Immunogen sequence: SAGEVVACLI RVPSEVVKQR AQVSASTRTF QIFSNILYEE GIQGLYRGYK STVLREIPFS LVQFPLWESL KALWSWRQDH VVDSWQSAVC GAFAGGFAAA VTTPLDVAKT RITLAKAGSS TADGNVLSVL HGV Highest antigen sequence identity to the following orthologs: Mouse - 89%, Rat - 89%.
- Reactivity
- Human
- Host
- Rabbit
- Isotype
- IgG
- Vial size
- 100 μL
- Concentration
- 0.10 mg/mL
- Storage
- Store at 4°C short term. For long term storage, store at -20°C, avoiding freeze/thaw cycles.
Submitted references Novel copper complex CTB regulates methionine cycle induced TERT hypomethylation to promote HCC cells senescence via mitochondrial SLC25A26.
Jin C, Li Y, Su Y, Guo Z, Wang X, Wang S, Zhang F, Zhang Z, Shao J, Zheng S
Cell death & disease 2020 Oct 11;11(10):844
Cell death & disease 2020 Oct 11;11(10):844
No comments: Submit comment
Supportive validation
- Submitted by
- Invitrogen Antibodies (provider)
- Main image
- Experimental details
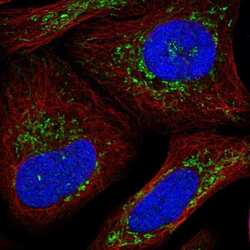
- Immunofluorescent staining of SLC25A26 in human cell line U-2 OS shows positivity in mitochondria. Samples were probed using a SLC25A26 Polyclonal Antibody (Product # PA5-55452).

- Submitted by
- Invitrogen Antibodies (provider)
- Main image
- Experimental details
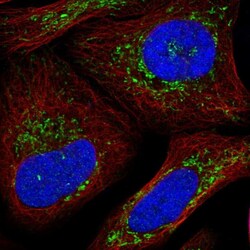
- Immunofluorecent analysis of SLC25A26 in human cell line U-2 OS using SLC25A26 Polyclonal Antibody (Product # PA5-55452). Staining shows positivity in mitochondria.

Supportive validation
- Submitted by
- Invitrogen Antibodies (provider)
- Main image
- Experimental details
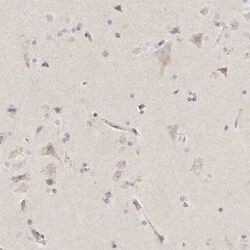
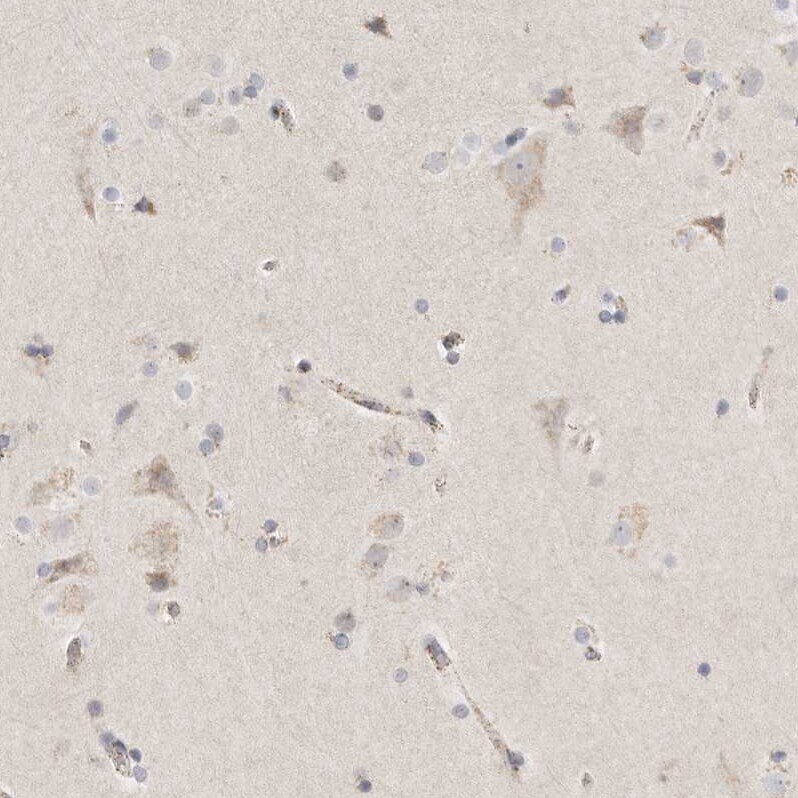
- Immunohistochemical staining of SLC25A26 in human cerebral cortex using SLC25A26 Polyclonal Antibody (Product # PA5-55452) shows granular cytoplasmic positivity in neurons.
- Submitted by
- Invitrogen Antibodies (provider)
- Main image
- Experimental details
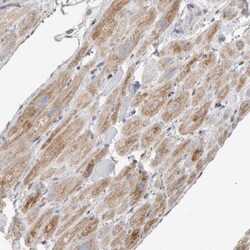
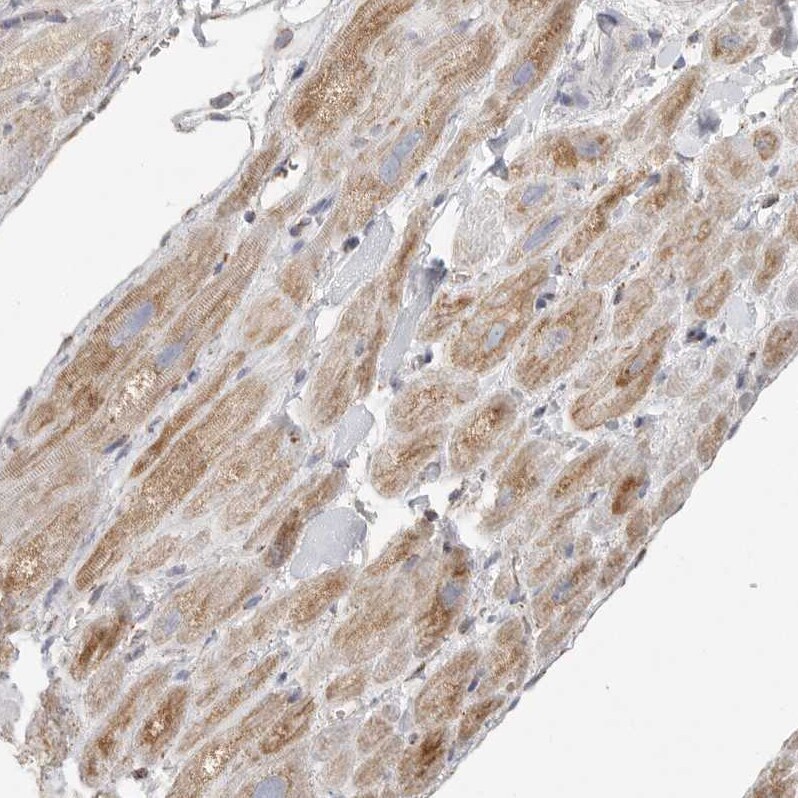
- Immunohistochemical staining of SLC25A26 in human heart muscle using SLC25A26 Polyclonal Antibody (Product # PA5-55452) shows moderate granular cytoplasmic positivity.
- Submitted by
- Invitrogen Antibodies (provider)
- Main image
- Experimental details
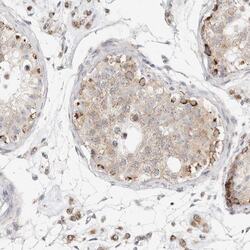
- Immunohistochemical staining of SLC25A26 in human testis using SLC25A26 Polyclonal Antibody (Product # PA5-55452) shows strong granular cytoplasmic positivity in a subset of cells in seminiferous ducts.

- Submitted by
- Invitrogen Antibodies (provider)
- Main image

- Experimental details
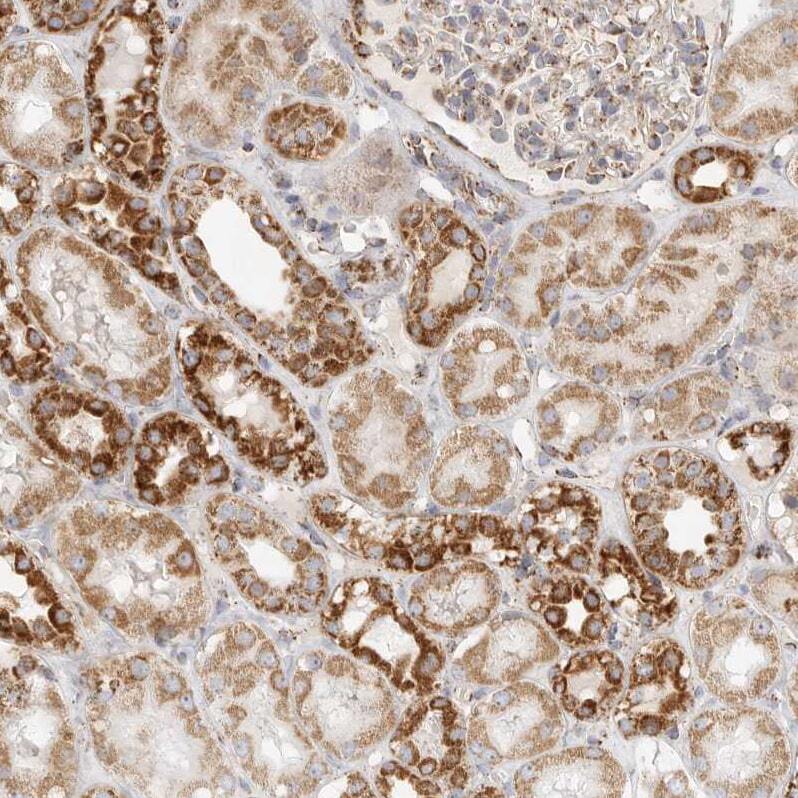
- Immunohistochemical staining of SLC25A26 in human kidney using SLC25A26 Polyclonal Antibody (Product # PA5-55452) shows moderate to strong granular cytoplasmic positivity in cells in tubules.
Supportive validation
- Submitted by
- Invitrogen Antibodies (provider)
- Main image
- Experimental details
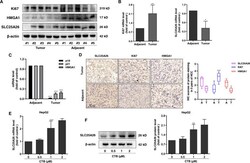
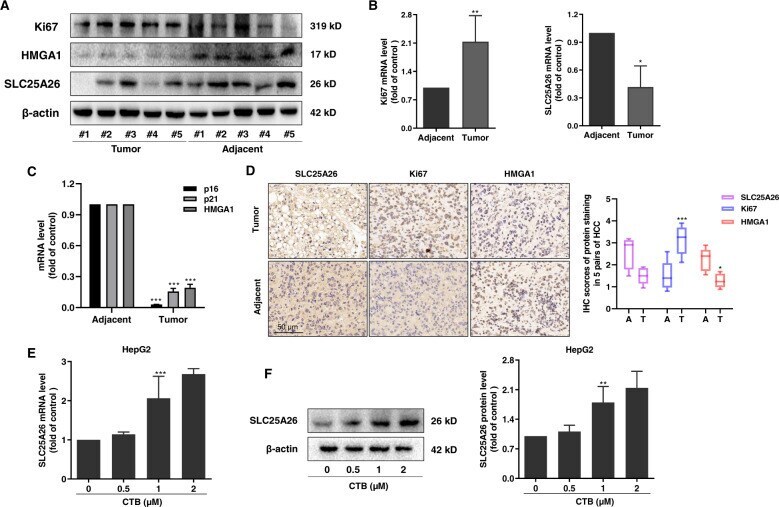
- Fig. 3 CTB promoted accumulation of SLC25A26. A Western blots were used to detect the protein expressions of Ki67, HMGA1, and SLC25A26 in liver cancer tissues and adjacent tissues from five pairs of HCC patients (T: tumor; A: Adjacent); B , C Real-time PCR analyses of Ki67, SLC25A26 and senescent makers in HCC tumor and adjacent tissues; D Typical images of Ki67, HMGA1 and SLC25A26 immunohistochemical staining in HCC tumors and adjacent tissues (scale bar, 50 mum); E The mRNA level of SLC25A26 was detected by real-time PCR. F Western blot analysis was used to determine the expression of SLC25A26. Statistical significance for this graph, data are represented as mean +- S.D. ( n = 5); * P < 0.05 vs. control, ** P < 0.01 vs. control.
- Submitted by
- Invitrogen Antibodies (provider)
- Main image
- Experimental details
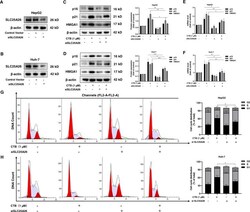
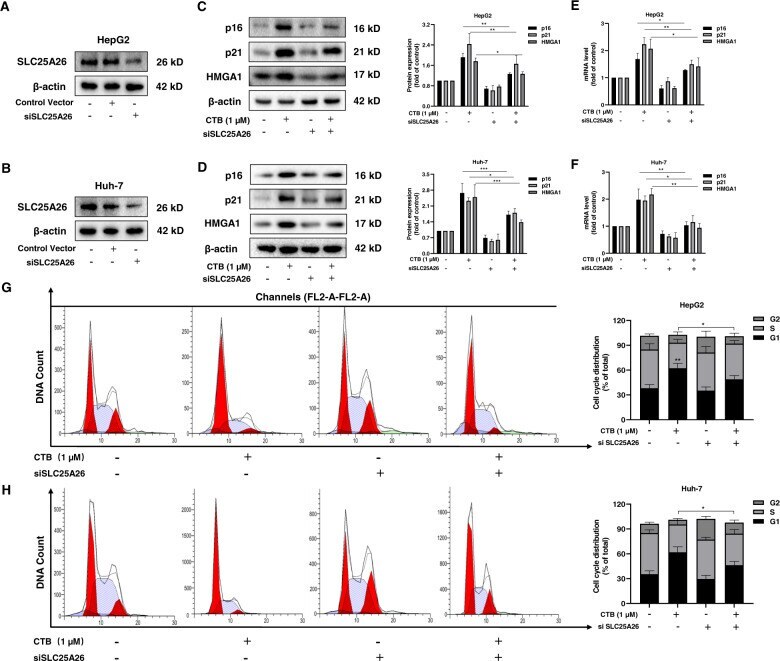
- Fig. 4 Interfering with SLC25A26 weakened the effect of CTB-induced HCC cells senescence. HepG2 cells and Huh-7 cells were incubated with the prescribed concentration of CTB or transfected with SLC25A26 siRNA for 24 h. A , B Western blot was used to analyze the transfection efficiency of siSLC25A26 in both HCC cells; C , D Western blot analyzed the expression of senescent makers; E , F Real-time PCR analyzed the expression of senescent makers; G , H Flow Cytometry analyzed cell cycle to determine the percentage of cell cycle distribution. Statistical significance for this graph, data are represented as mean +- S.D. ( n = 3); * P < 0.05 vs. control, ** P < 0.01 vs. control, *** P < 0.001 vs. control.
- Submitted by
- Invitrogen Antibodies (provider)
- Main image
- Experimental details
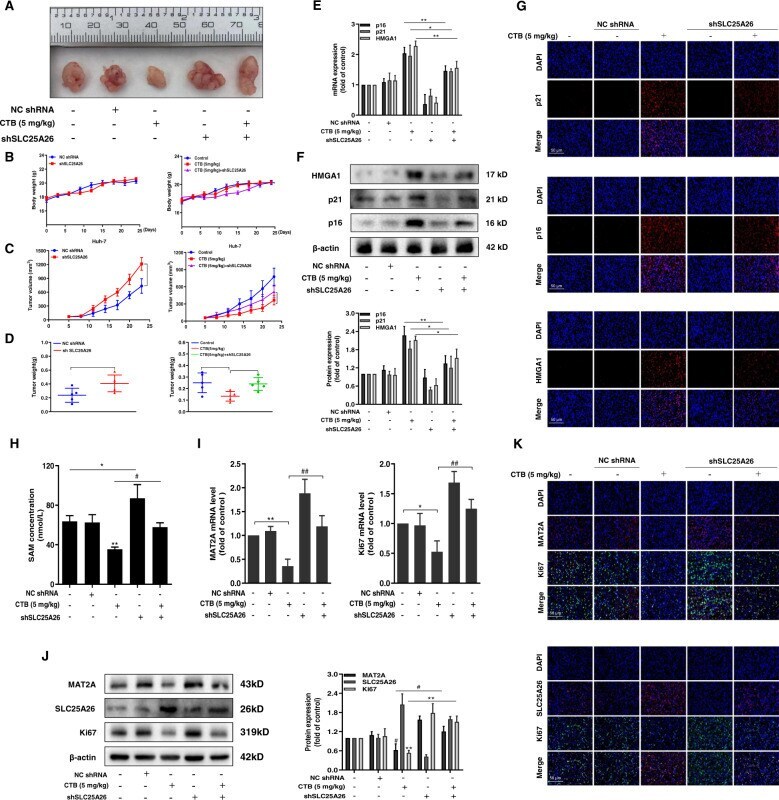
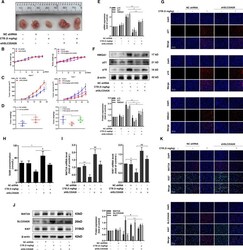
- Fig. 7 CTB repressed tumorigenesis in vivo by regulating SLC25A26. HCC cell line Huh-7 was used to construct subcutaneous xenografts. A Representative images of BALB/c nude mice tumors stripped from different groups ( n = 6); B The body weight change curves of mice in each group during the whole experiment period ( n = 6); C Tumor volume growth curves of mice in each group throughout the experimental period ( n = 6); D Tumor weight was obtained after executing mice on the last day ( n = 6); E Real-time PCR analysis of p16, p21, HMGA1 mRNA levels in tumor tissues; F Western blot was used to analyze the protein expression of p16, p21, HMGA1 in tumor tissues. Representative blots were from three independent experiments; G Immunofluorescence analyses of senescent makers p16, p21, HMGA1 in the tumor tissue; H Elisa kit analyzes SAM levels in the tumor tissue; I Real-time PCR analyses of MAT2A, Ki67 mRNA levels in tumor tissues. J Western blot was used to analyze the protein expression of MAT2A, SLC25A26, Ki67 in tumor tissues. Representative blots were from three independent experiments; K Immunofluorescence analyses of MAT2A, SLC25A26, Ki67 in tumor tissues; Scale bars are 50 mum. Statistical significance for this graph: * P < 0.05 vs. control, ** P < 0.01 vs. control, # P < 0.05 vs. CTB (5 mg/kg) + shSLC25A26, ##P < 0.01 vs. CTB (5 mg/kg) + shSLC25A26.