 Explore
 Validate
 Learn
Learn Western blot
 Immunohistochemistry
Antibody data
- Antibody Data
- Antigen structure
- References [1]
- Comments [0]
- Validations
- Immunohistochemistry [1]
- Flow cytometry [2]
- Other assay [1]
Submit
Validation data
Reference
Comment
Report error
- Product number
- PA5-26318 - Provider product page

- Provider
- Invitrogen Antibodies
- Product name
- LPCAT1 Polyclonal Antibody
- Antibody type
- Polyclonal
- Antigen
- Synthetic peptide
- Reactivity
- Human
- Host
- Rabbit
- Isotype
- IgG
- Vial size
- 400 μL
- Concentration
- 0.5 mg/mL
- Storage
- Store at 4°C short term. For long term storage, store at -20°C, avoiding freeze/thaw cycles.
Submitted references Role of cardiolipins, mitochondria, and autophagy in the differentiation process activated by all-trans retinoic acid in acute promyelocytic leukemia.
Gianni' M, Goracci L, Schlaefli A, Di Veroli A, Kurosaki M, Guarrera L, Bolis M, Foglia M, Lupi M, Tschan MP, Cruciani G, Terao M, Garattini E
Cell death & disease 2022 Jan 10;13(1):30
Cell death & disease 2022 Jan 10;13(1):30
No comments: Submit comment
Supportive validation
- Submitted by
- Invitrogen Antibodies (provider)
- Main image
- Experimental details
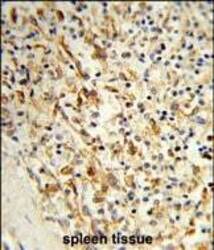
- Immunohistochemistry analysis of LPCAT1 in paraffin-embedded Human spleen tissue. Samples were incubated with LPCAT1 polyclonal antibody (Product # PA5-26318) which was peroxidase-conjugated to the secondary antibody, followed by DAB staining. This data demonstrates the use of this antibody for immunohistochemistry; clinical relevance has not been evaluated.

Supportive validation
- Submitted by
- Invitrogen Antibodies (provider)
- Main image
- Experimental details
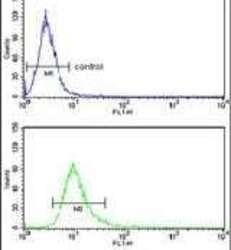
- Flow cytometry analysis of HeLa cells using a PCAT1 polyclonal antibody (Product # PA5-26318) (bottom) compared to a negative control cell (top) at a dilution of 1:10-50, followed by a FITC-conjugated goat anti-rabbit antibody

- Submitted by
- Invitrogen Antibodies (provider)
- Main image
- Experimental details
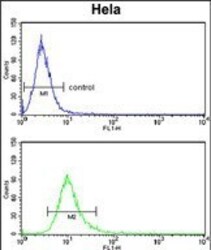
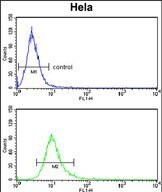
- Flow cytometry of LPCAT1 in Hela cells (bottom histogram). Samples were incubated with LPCAT1 polyclonal antibody (Product # PA5-26318) followed by FITC-conjugated goat-anti-rabbit secondary antibody. Negative control cell (top histogram).
Supportive validation
- Submitted by
- Invitrogen Antibodies (provider)
- Main image
- Experimental details
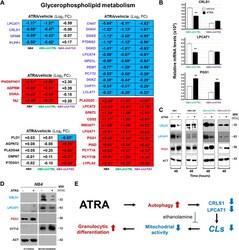
- Fig. 8 ATRA effects on the expression of the genes belonging to the glycerophospholipid metabolism pathway in parental NB4, NB4-shCTRL, and NB4-shATG5 cells. A The effects exerted by ATRA on the genes belonging to the glycerophospholipid pathway in parental NB4 , NB4-shCTRL , and NB4-shATG5 cells were evaluated using the RNA-seq data generated from the three cell lines exposed to vehicle (DMSO) or ATRA (1 muM) for 48 h. The diagrams show the perturbations induced by ATRA on the expression of the indicated genes. The results presented in each box are expressed using the Log 2 of the ATRA-dependent fold-change values which we determined. The names of the genes whose expression is significantly increased by ATRA in the indicated cell-lines are written in red. The names of the genes whose expression is significantly decreased by ATRA in the indicated cell-lines are written in blue. When the indicated genes are significantly up-regulated (FDR > 0.05), the positive fold-change values are contained in a red box and are marked with an asterisk. When the indicated genes are significantly down-regulated (FDR > 0.05), the negative fold-change values are contained in a light blue box. B The column diagrams indicate the expression levels of the CRLS1 , LPCAT1 , and PGS1 mRNAs which were determined in three independent cultures of NB4-shCTRL and NB4-shATG5 cells, by PCR using specific Taqman Assays. The results are expressed as the Mean + S.D. ( N = 3) of the values determined. **Significa
