Explore
 Validate
 Learn
Learn Western blot
 ELISA
ELISA Immunocytochemistry
Antibody data
- Antibody Data
- Antigen structure
- References [2]
- Comments [0]
- Validations
- Immunocytochemistry [4]
- Immunohistochemistry [4]
- Other assay [2]
Submit
Validation data
Reference
Comment
Report error
- Product number
- PA5-28301 - Provider product page

- Provider
- Invitrogen Antibodies
- Product name
- GluD1 Polyclonal Antibody
- Antibody type
- Polyclonal
- Antigen
- Recombinant full-length protein
- Description
- Recommended positive controls: 293T, A431, HeLa, HepG2, THP1, Raw264.7. Predicted reactivity: Mouse (99%), Rat (98%), Xenopus laevis (91%), Pig (99%), Sheep (99%), Bovine (98%). Store product as a concentrated solution. Centrifuge briefly prior to opening the vial.
- Reactivity
- Human, Mouse, Rat
- Host
- Rabbit
- Isotype
- IgG
- Vial size
- 100 μL
- Concentration
- 0.07 mg/mL
- Storage
- Store at 4°C short term. For long term storage, store at -20°C, avoiding freeze/thaw cycles.
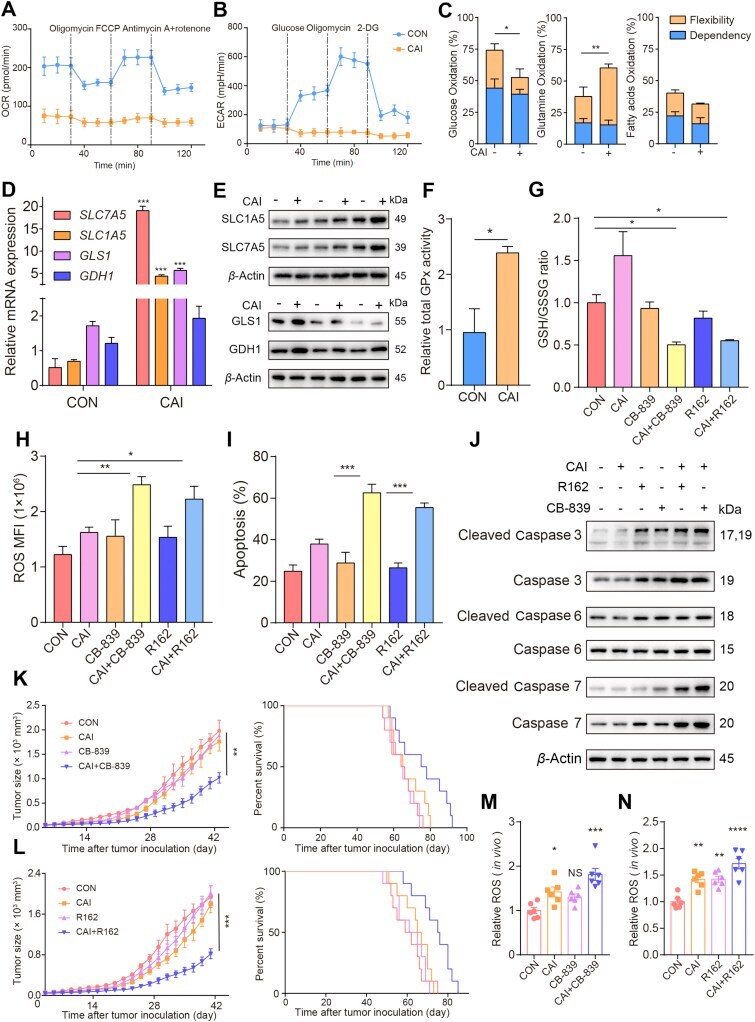
Submitted references Targeting glutamine utilization to block metabolic adaptation of tumor cells under the stress of carboxyamidotriazole-induced nutrients unavailability.
Asiatic Acid Prevents Cognitive Deficits by Inhibiting Calpain Activation and Preserving Synaptic and Mitochondrial Function in Rats with Kainic Acid-Induced Seizure.
Shi J, Ju R, Gao H, Huang Y, Guo L, Zhang D
Acta pharmaceutica Sinica. B 2022 Feb;12(2):759-773
Acta pharmaceutica Sinica. B 2022 Feb;12(2):759-773
Asiatic Acid Prevents Cognitive Deficits by Inhibiting Calpain Activation and Preserving Synaptic and Mitochondrial Function in Rats with Kainic Acid-Induced Seizure.
Lu CW, Lin TY, Pan TL, Wang PW, Chiu KM, Lee MY, Wang SJ
Biomedicines 2021 Mar 10;9(3)
Biomedicines 2021 Mar 10;9(3)
No comments: Submit comment
Supportive validation
- Submitted by
- Invitrogen Antibodies (provider)
- Main image

- Experimental details
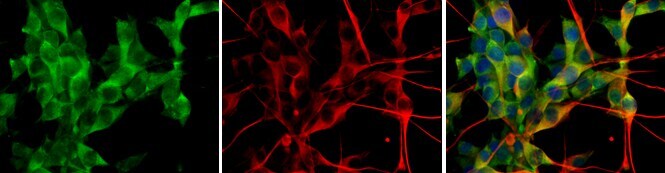
- Immunocytochemistry-Immunofluorescence analysis of GluD1 was performed in U-87 MG cells fixed in 4% paraformaldehyde at RT for 15 min. Green: GluD1 Polyclonal Antibody (Product # PA5-28301) diluted at 1:500. Red: beta Tubulin 3/ TUJ1 protein stained by beta Tubulin 3/ TUJ1 antibody. Blue: Hoechst 33342 staining.

- Submitted by
- Invitrogen Antibodies (provider)
- Main image
- Experimental details
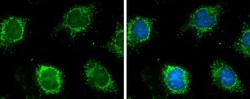
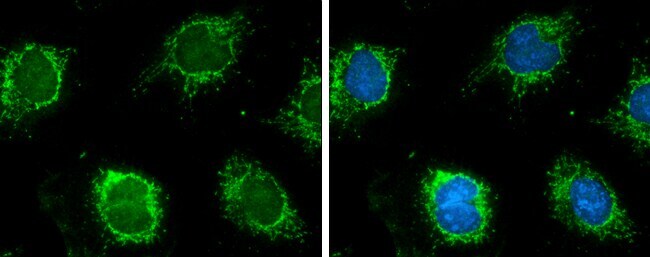
- Immunocytochemistry-Immunofluorescence analysis of GluD1 was performed in HeLa cells fixed in ice-cold MeOH for 5 min. Green: GluD1 Polyclonal Antibody (Product # PA5-28301) diluted at 1:500. Blue: Hoechst 33342 staining.
- Submitted by
- Invitrogen Antibodies (provider)
- Main image

- Experimental details
- Immunocytochemistry-Immunofluorescence analysis of GluD1 was performed in U-87 MG cells fixed in 4% paraformaldehyde at RT for 15 min. Green: GluD1 Polyclonal Antibody (Product # PA5-28301) diluted at 1:500. Red: beta Tubulin 3/ TUJ1 protein stained by beta Tubulin 3/ TUJ1 antibody. Blue: Hoechst 33342 staining.
- Submitted by
- Invitrogen Antibodies (provider)
- Main image

- Experimental details
- Immunocytochemistry-Immunofluorescence analysis of GluD1 was performed in HeLa cells fixed in ice-cold MeOH for 5 min. Green: GluD1 Polyclonal Antibody (Product # PA5-28301) diluted at 1:500. Blue: Hoechst 33342 staining.

Supportive validation
- Submitted by
- Invitrogen Antibodies (provider)
- Main image
- Experimental details
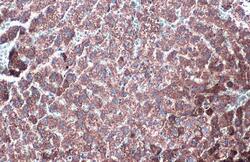
- GluD1 Polyclonal Antibody detects Glutamate Dehydrogenase protein at mitochondria by immunohistochemical analysis. Sample: Paraffin-embedded rat liver. Glutamate Dehydrogenase stained by GluD1 Polyclonal Antibody (Product # PA5-28301) diluted at 1:500. Antigen Retrieval: Citrate buffer, pH 6.0, 15 min.
- Submitted by
- Invitrogen Antibodies (provider)
- Main image

- Experimental details
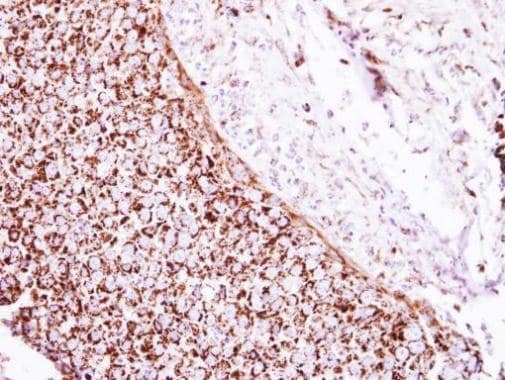
- Immunohistochemical analysis of paraffin-embedded human breast cancer, using Glutamate Dehydrogenase (Product # PA5-28301) antibody at 1:250 dilution. Antigen Retrieval: EDTA based buffer, pH 8.0, 15 min.
- Submitted by
- Invitrogen Antibodies (provider)
- Main image
- Experimental details
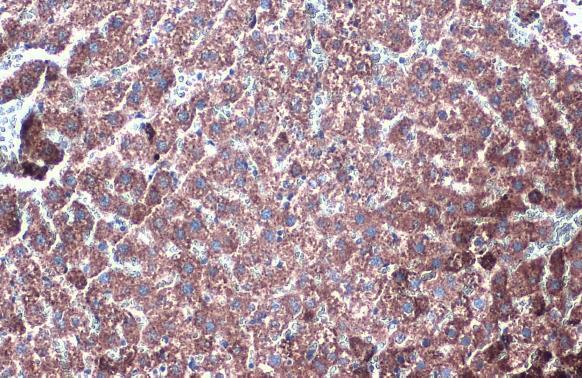
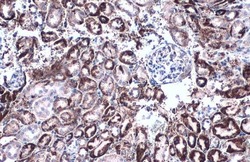
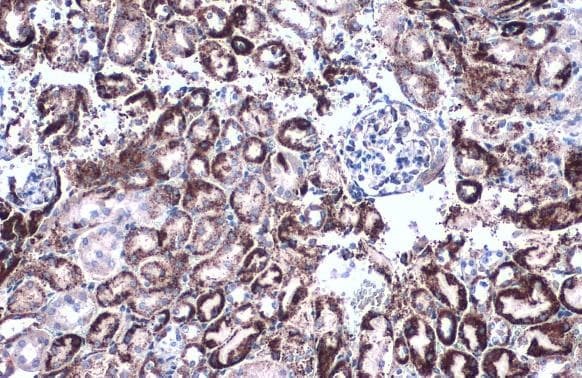
- GluD1 Polyclonal Antibody detects Glutamate Dehydrogenase protein at mitochondria by immunohistochemical analysis. Sample: Paraffin-embedded mouse kidney. Glutamate Dehydrogenase stained by GluD1 Polyclonal Antibody (Product # PA5-28301) diluted at 1:500. Antigen Retrieval: Citrate buffer, pH 6.0, 15 min.
- Submitted by
- Invitrogen Antibodies (provider)
- Main image
- Experimental details
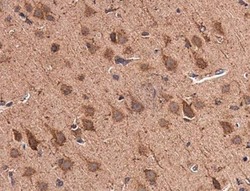
- Immunohistochemistry (Paraffin) analysis of GluD1 was performed in paraffin-embedded rat brain tissue using GluD1 Polyclonal Antibody (Product # PA5-28301) at a dilution of 1:750.

Supportive validation
- Submitted by
- Invitrogen Antibodies (provider)
- Main image
- Experimental details
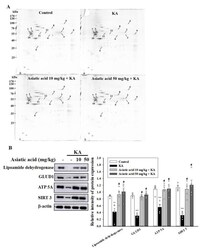
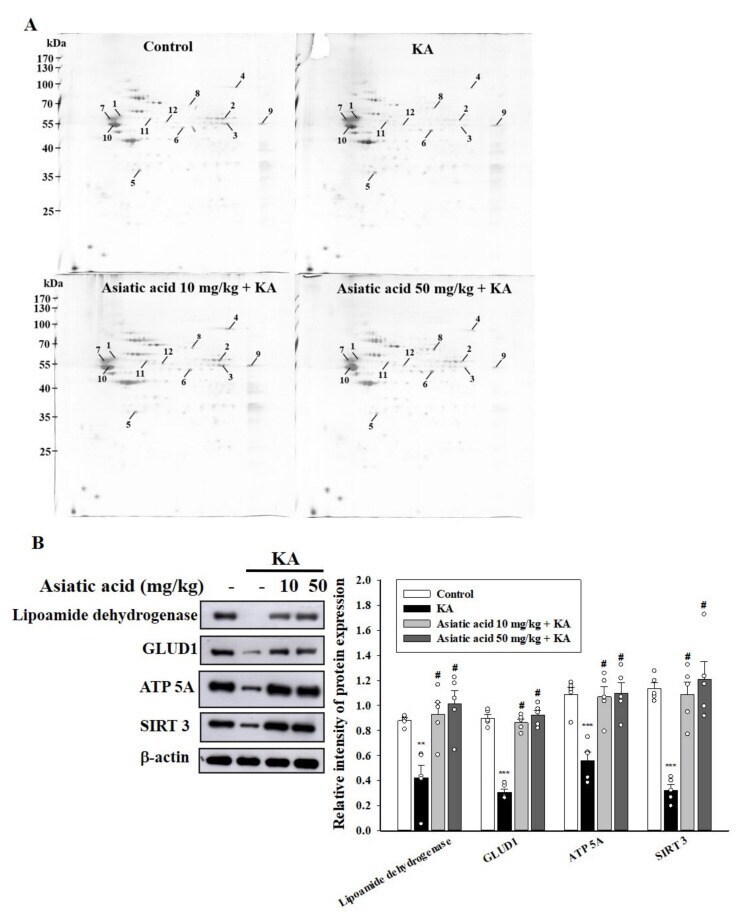
- Figure 7 ( A ) Proteomic analysis identified 12 proteins associated with the asiatic acid pretreatment in the hippocampal synaptosomes of rats with KA-induced seizures. Global view of the protein spots on the two-dimensional gels. Protein spots with meaningful changes in intensity are labeled with Arabic numerals. ( B ) Western blot showing the expression levels of lipoamide dehydrogenase, GLUD1 (glutamate dehydrogenase 1), ATP5A (mitochondrial membrane ATP synthase), and SIRT3 (mitochondrial deacetylase sirtuin-3) in the hippocampus for each group. The relative protein levels were quantified. ** p < 0.01, *** p < 0.001 (vs. control); # p < 0.001 (asiatic acid + KA vs. KA); n = 5 rats per group.
- Submitted by
- Invitrogen Antibodies (provider)
- Main image
- Experimental details
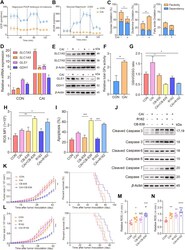
- Combined therapy with CAI and CB-839 or R162 exhibits enhanced antitumor activity against primary tumor cells. (A) and (B) The oxygen consumption rate (OCR) and extracellular acidification rate (ECAR) of primary tumor cells were measured with or without 10 mumol/L CAI treatment for 48 h ( n = 3). (C) Seahorse XFp Fuel Flex analysis shows the dependency on and flexibility of all 3 fuels after acute 10 mumol/L CAI treatment of primary tumor cells. The expression of the amino acid transporters GLS1 and GDH1 was determined by real-time PCR (D) and Western blotting (E) in 3 different primary tumor cell lines. (F) GPx activity levels in primary tumor cells were measured. (G) The ratio of GSH to GSSG was calculated. (H) The MFI of ROS in primary tumor cells was measured. (I) Tumor cell apoptosis was quantified by flow cytometry. (J) Western blots show the expression of caspase 3, cleaved caspase 3, caspase 6, cleaved caspase 6, caspase 7 and cleaved caspase 7 after 48 h of the indicated treatments. (K) and (L) NOD-SCID mice subcutaneously injected with 100 muL fragments of colorectal cancer tissue from patients were treated with PBS, CAI, R162, or CAI/R162 or PBS, CAI, CB-839, or CAI/CB-839 for 42 days. Tumor volumes were measured and calculated (left). Long-term survival was calculated by Kaplan-Meier analysis and analysed with the log-rank (Mantel-Cox) test (right). (M) and (N) The effects of in vivo treatment on ROS production were evaluated. * P < 0.05; ** P < 0.01; *** P < 0.00