Explore
 Validate
 Learn
Learn14-5301-81
antibody from Invitrogen Antibodies
Targeting: LGALS3
GALIG, LGALS2, MAC-2
 Western blot
 ELISA
ELISA Immunocytochemistry Immunoprecipitation Immunohistochemistry Flow cytometry Other assay
Antibody data
- Antibody Data
- Antigen structure
- References [37]
- Comments [0]
- Validations
- Immunocytochemistry [2]
- Flow cytometry [2]
- Other assay [30]
Submit
Validation data
Reference
Comment
Report error
- Product number
- 14-5301-81 - Provider product page

- Provider
- Invitrogen Antibodies
- Product name
- Galectin 3 Monoclonal Antibody (eBioM3/38 (M3/38)), eBioscience™
- Antibody type
- Monoclonal
- Antigen
- Other
- Description
- Description: The eBioM3/38 antibody reacts with mouse Galectin-3 (Mac-2). Galectins are a family of animal lectins which appear to exhibit a variety of biological functions. Galectin 3 (aka LGALS3, galactose-specific soluble lectin 3, Mac-2, L-29) is one of the more extensively studied members of this family and is a 30 kDa beta-galactoside-binding protein. Due to a C-terminal carbohydrate binding site, Galectin 3 is capable of binding IgE and mammalian cell surfaces only when homodimerized or homo-oligomerized. Galectin 3 is normally distributed in epithelia of many organs and various inflammatory cells, including macrophages, as well as dendritic cells and Kupffer cells. The expression of this lectin is up-regulated during inflammation, cell proliferation, cell differentiation and through trans-activation by viral proteins. This monoclonal antibody eBioM3/38 crossreacts to human Galectin-3 (LGALS3). Applications Reported: This eBioM3/38 (M3/38) antibody has been reported for use in flow cytometric analysis, immunoprecipitation, immunoblotting (WB), immunohistology staining of frozen tissue sections, immunohistology staining of paraffin embedded tissue sections, and ELISA. Applications Tested: This eBioM3/38 (M3/38) antibody has been tested by flow cytometric analysis of mouse PECs (thioglycollated elicied peritioneal cells). This can be used at less than or equal to 0.25 µg per test. A test is defined as the amount (µg) of antibody that will stain a cell sample in a final volume of 100 µL. Cell number should be determined empirically but can range from 10^5 to 10^8 cells/test. It is recommended that the antibody be carefully titrated for optimal performance in the assay of interest. Purity: Greater than 90%, as determined by SDS-PAGE. Aggregation: Less than 10%, as determined by HPLC. Filtration: 0.2 µm post-manufacturing filtered.
- Reactivity
- Human, Mouse
- Host
- Rat
- Isotype
- IgG
- Antibody clone number
- eBioM3/38 (M3/38)
- Vial size
- 50 μg
- Concentration
- 0.5 mg/mL
- Storage
- 4°C
Submitted references Endocytic membrane repair by ESCRT-III controls antigen export to the cytosol during antigen cross-presentation.
KLF11 protects against abdominal aortic aneurysm through inhibition of endothelial cell dysfunction.
Quantitative characterization of extracellular vesicle uptake and content delivery within mammalian cells.
Phospholipid nanoparticles: Therapeutic potentials against atherosclerosis via reducing cholesterol crystals and inhibiting inflammation.
Ultrastructural alteration of pulmonary tissue under conditions of high oxygen concentration.
Overexpression of Galectin 3 in Pancreatic β Cells Amplifies β-Cell Apoptosis and Islet Inflammation in Type-2 Diabetes in Mice.
Inhibition of p38mapk Reduces Adipose Tissue Inflammation in Aging Mediated by Arginase-II.
Foreign body responses in mouse central nervous system mimic natural wound responses and alter biomaterial functions.
Smooth muscle-derived progenitor cell myofibroblast differentiation through KLF4 downregulation promotes arterial remodeling and fibrosis.
Macrophage NCOR1 Deficiency Ameliorates Myocardial Infarction and Neointimal Hyperplasia in Mice.
Time-course analysis of cardiac and serum galectin-3 in viral myocarditis after an encephalomyocarditis virus inoculation.
Xanthohumol and 8-prenylnaringenin reduce type 2 diabetes-associated oxidative stress by downregulating galectin-3.
An Orally Active Galectin-3 Antagonist Inhibits Lung Adenocarcinoma Growth and Augments Response to PD-L1 Blockade.
Myeloid-specific deletion of Zfp36 protects against insulin resistance and fatty liver in diet-induced obese mice.
Deoxycorticosterone/Salt-Mediated Cardiac Inflammation and Fibrosis Are Dependent on Functional CLOCK Signaling in Male Mice.
T-Cell Mineralocorticoid Receptor Controls Blood Pressure by Regulating Interferon-Gamma.
Inhibition of sphingosine 1-phosphate signaling ameliorates murine nonalcoholic steatohepatitis.
The kielin/chordin-like protein (KCP) attenuates high-fat diet-induced obesity and metabolic syndrome in mice.
SCHLAFEN 5 expression correlates with intestinal metaplasia that progresses to gastric cancer.
Macrophage Proliferation Sustains Adipose Tissue Inflammation in Formerly Obese Mice.
Mixed-lineage kinase 3 pharmacological inhibition attenuates murine nonalcoholic steatohepatitis.
Neuroprotection by selective neuronal deletion of Atg7 in neonatal brain injury.
Galectin-3 expression in hippocampal CA2 following transient forebrain ischemia and its inhibition by hypothermia or antiapoptotic agents.
Cell surface galectin-3 defines a subset of chemoresistant gastrointestinal tumor-initiating cancer cells with heightened stem cell characteristics.
Maternal immune activation evoked by polyinosinic:polycytidylic acid does not evoke microglial cell activation in the embryo.
Rhadinovirus host entry by co-operative infection.
Imaging white adipose tissue with confocal microscopy.
18-HEPE, an n-3 fatty acid metabolite released by macrophages, prevents pressure overload-induced maladaptive cardiac remodeling.
Galectin-3 functions as an alarmin: pathogenic role for sepsis development in murine respiratory tularemia.
Molecular imaging of the paracrine proangiogenic effects of progenitor cell therapy in limb ischemia.
PD-L1 has distinct functions in hematopoietic and nonhematopoietic cells in regulating T cell responses during chronic infection in mice.
Glycation of a food allergen by the Maillard reaction enhances its T-cell immunogenicity: role of macrophage scavenger receptor class A type I and II.
Renal vascular inflammation induced by Western diet in ApoE-null mice quantified by (19)F NMR of VCAM-1 targeted nanobeacons.
Identification of markers that distinguish monocyte-derived fibrocytes from monocytes, macrophages, and fibroblasts.
Kinetics of mobilization and differentiation of lymphohematopoietic cells during experimental murine schistosomiasis in galectin-3 -/- mice.
Expression and function of galectin-3, a beta-galactoside-binding protein in activated T lymphocytes.
Mac-2, a novel 32,000 Mr mouse macrophage subpopulation-specific antigen defined by monoclonal antibodies.
Gros M, Segura E, Rookhuizen DC, Baudon B, Heurtebise-Chrétien S, Burgdorf N, Maurin M, Kapp EA, Simpson RJ, Kozik P, Villadangos JA, Bertrand MJM, Burbage M, Amigorena S
Cell reports 2022 Aug 16;40(7):111205
Cell reports 2022 Aug 16;40(7):111205
KLF11 protects against abdominal aortic aneurysm through inhibition of endothelial cell dysfunction.
Zhao G, Chang Z, Zhao Y, Guo Y, Lu H, Liang W, Rom O, Wang H, Sun J, Zhu T, Fan Y, Chang L, Yang B, Garcia-Barrio MT, Chen YE, Zhang J
JCI insight 2021 Mar 8;6(5)
JCI insight 2021 Mar 8;6(5)
Quantitative characterization of extracellular vesicle uptake and content delivery within mammalian cells.
Bonsergent E, Grisard E, Buchrieser J, Schwartz O, Théry C, Lavieu G
Nature communications 2021 Mar 25;12(1):1864
Nature communications 2021 Mar 25;12(1):1864
Phospholipid nanoparticles: Therapeutic potentials against atherosclerosis via reducing cholesterol crystals and inhibiting inflammation.
Luo Y, Guo Y, Wang H, Yu M, Hong K, Li D, Li R, Wen B, Hu D, Chang L, Zhang J, Yang B, Sun D, Schwendeman AS, Eugene Chen Y
EBioMedicine 2021 Dec;74:103725
EBioMedicine 2021 Dec;74:103725
Ultrastructural alteration of pulmonary tissue under conditions of high oxygen concentration.
Yano H, Kuroda A, Okada H, Tomita H, Suzuki K, Takada C, Fukuda H, Kawasaki Y, Muraki I, Wakayama Y, Kano S, Tamaoki Y, Nishio A, Inagawa R, Sampei S, Kamidani R, Kakino Y, Yasuda R, Kitagawa Y, Fukuta T, Miyake T, Kanda N, Miyazaki N, Doi T, Yoshida T, Suzuki A, Yoshida S, Ogura S
International journal of clinical and experimental pathology 2020;13(12):3004-3012
International journal of clinical and experimental pathology 2020;13(12):3004-3012
Overexpression of Galectin 3 in Pancreatic β Cells Amplifies β-Cell Apoptosis and Islet Inflammation in Type-2 Diabetes in Mice.
Petrovic I, Pejnovic N, Ljujic B, Pavlovic S, Miletic Kovacevic M, Jeftic I, Djukic A, Draginic N, Andjic M, Arsenijevic N, Lukic ML, Jovicic N
Frontiers in endocrinology 2020;11:30
Frontiers in endocrinology 2020;11:30
Inhibition of p38mapk Reduces Adipose Tissue Inflammation in Aging Mediated by Arginase-II.
Huang J, Liu C, Ming XF, Yang Z
Pharmacology 2020;105(9-10):491-504
Pharmacology 2020;105(9-10):491-504
Foreign body responses in mouse central nervous system mimic natural wound responses and alter biomaterial functions.
OʼShea TM, Wollenberg AL, Kim JH, Ao Y, Deming TJ, Sofroniew MV
Nature communications 2020 Dec 4;11(1):6203
Nature communications 2020 Dec 4;11(1):6203
Smooth muscle-derived progenitor cell myofibroblast differentiation through KLF4 downregulation promotes arterial remodeling and fibrosis.
Lu S, Jolly AJ, Strand KA, Dubner AM, Mutryn MF, Moulton KS, Nemenoff RA, Majesky MW, Weiser-Evans MC
JCI insight 2020 Dec 3;5(23)
JCI insight 2020 Dec 3;5(23)
Macrophage NCOR1 Deficiency Ameliorates Myocardial Infarction and Neointimal Hyperplasia in Mice.
Du LJ, Sun JY, Zhang WC, Wang YL, Zhu H, Liu T, Gao MZ, Zheng C, Zhang YY, Liu Y, Liu Y, Shao S, Zhang XQ, Leng Q, Auwerx J, Duan SZ
Journal of the American Heart Association 2020 Aug 4;9(15):e015862
Journal of the American Heart Association 2020 Aug 4;9(15):e015862
Time-course analysis of cardiac and serum galectin-3 in viral myocarditis after an encephalomyocarditis virus inoculation.
Noguchi K, Tomita H, Kanayama T, Niwa A, Hatano Y, Hoshi M, Sugie S, Okada H, Niwa M, Hara A
PloS one 2019;14(1):e0210971
PloS one 2019;14(1):e0210971
Xanthohumol and 8-prenylnaringenin reduce type 2 diabetes-associated oxidative stress by downregulating galectin-3.
Luís C, Costa R, Rodrigues I, Castela Â, Coelho P, Guerreiro S, Gomes J, Reis C, Soares R
Porto biomedical journal 2019 Jan-Feb;4(1):e23
Porto biomedical journal 2019 Jan-Feb;4(1):e23
An Orally Active Galectin-3 Antagonist Inhibits Lung Adenocarcinoma Growth and Augments Response to PD-L1 Blockade.
Vuong L, Kouverianou E, Rooney CM, McHugh BJ, Howie SEM, Gregory CD, Forbes SJ, Henderson NC, Zetterberg FR, Nilsson UJ, Leffler H, Ford P, Pedersen A, Gravelle L, Tantawi S, Schambye H, Sethi T, MacKinnon AC
Cancer research 2019 Apr 1;79(7):1480-1492
Cancer research 2019 Apr 1;79(7):1480-1492
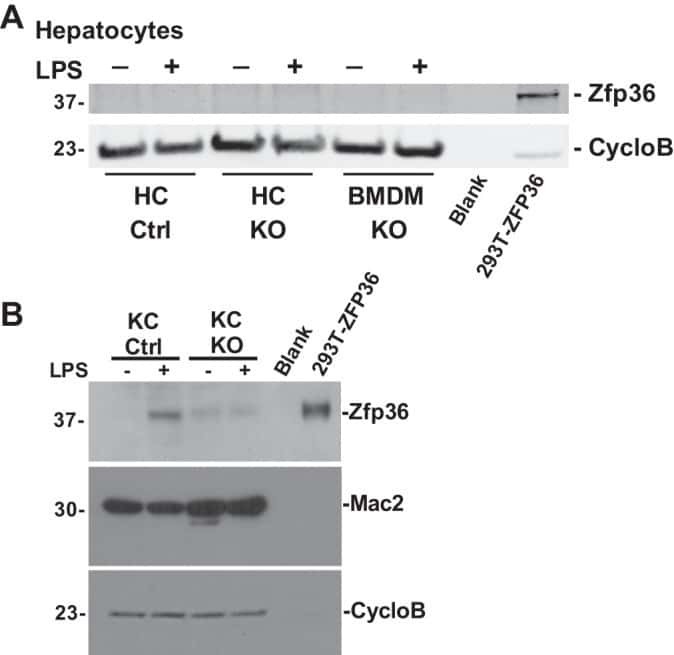
Myeloid-specific deletion of Zfp36 protects against insulin resistance and fatty liver in diet-induced obese mice.
Caracciolo V, Young J, Gonzales D, Ni Y, Flowers SJ, Summer R, Waldman SA, Kim JK, Jung DY, Noh HL, Kim T, Blackshear PJ, O'Connell D, Bauer RC, Kallen CB
American journal of physiology. Endocrinology and metabolism 2018 Oct 1;315(4):E676-E693
American journal of physiology. Endocrinology and metabolism 2018 Oct 1;315(4):E676-E693
Deoxycorticosterone/Salt-Mediated Cardiac Inflammation and Fibrosis Are Dependent on Functional CLOCK Signaling in Male Mice.
Fletcher EK, Morgan J, Kennaway DR, Bienvenu LA, Rickard AJ, Delbridge LMD, Fuller PJ, Clyne CD, Young MJ
Endocrinology 2017 Sep 1;158(9):2906-2917
Endocrinology 2017 Sep 1;158(9):2906-2917
T-Cell Mineralocorticoid Receptor Controls Blood Pressure by Regulating Interferon-Gamma.
Sun XN, Li C, Liu Y, Du LJ, Zeng MR, Zheng XJ, Zhang WC, Liu Y, Zhu M, Kong D, Zhou L, Lu L, Shen ZX, Yi Y, Du L, Qin M, Liu X, Hua Z, Sun S, Yin H, Zhou B, Yu Y, Zhang Z, Duan SZ
Circulation research 2017 May 12;120(10):1584-1597
Circulation research 2017 May 12;120(10):1584-1597
Inhibition of sphingosine 1-phosphate signaling ameliorates murine nonalcoholic steatohepatitis.
Mauer AS, Hirsova P, Maiers JL, Shah VH, Malhi H
American journal of physiology. Gastrointestinal and liver physiology 2017 Mar 1;312(3):G300-G313
American journal of physiology. Gastrointestinal and liver physiology 2017 Mar 1;312(3):G300-G313
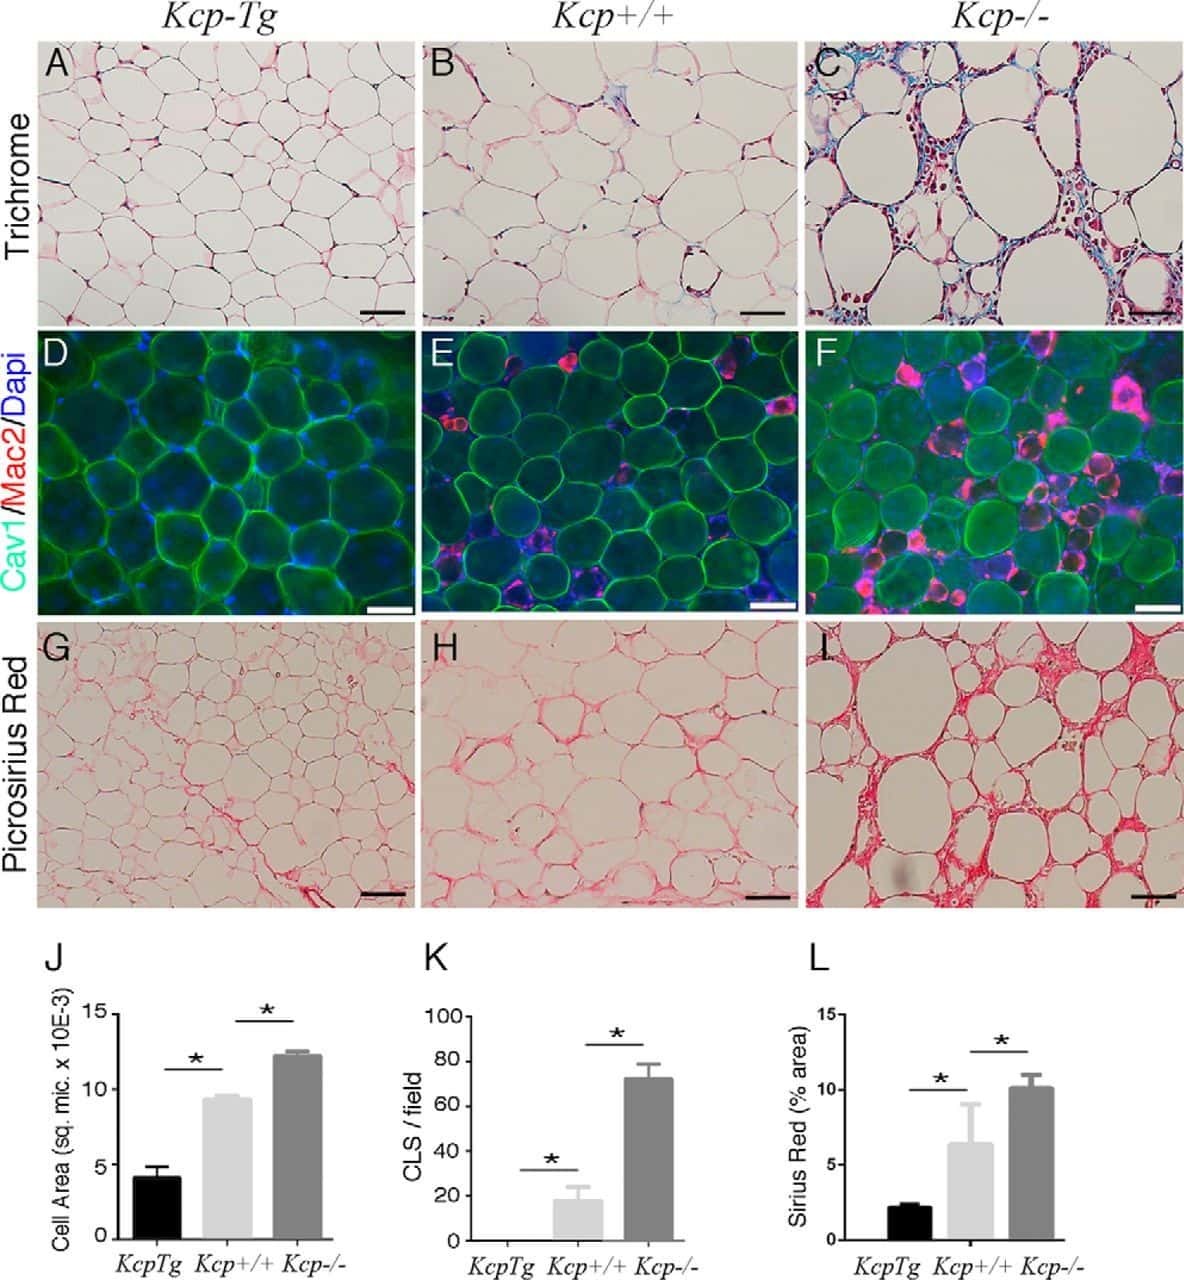
The kielin/chordin-like protein (KCP) attenuates high-fat diet-induced obesity and metabolic syndrome in mice.
Soofi A, Wolf KI, Emont MP, Qi N, Martinez-Santibanez G, Grimley E, Ostwani W, Dressler GR
The Journal of biological chemistry 2017 Jun 2;292(22):9051-9062
The Journal of biological chemistry 2017 Jun 2;292(22):9051-9062
SCHLAFEN 5 expression correlates with intestinal metaplasia that progresses to gastric cancer.
Companioni Nápoles O, Tsao AC, Sanz-Anquela JM, Sala N, Bonet C, Pardo ML, Ding L, Simo O, Saqui-Salces M, Blanco VP, Gonzalez CA, Merchant JL
Journal of gastroenterology 2017 Jan;52(1):39-49
Journal of gastroenterology 2017 Jan;52(1):39-49
Macrophage Proliferation Sustains Adipose Tissue Inflammation in Formerly Obese Mice.
Zamarron BF, Mergian TA, Cho KW, Martinez-Santibanez G, Luan D, Singer K, DelProposto JL, Geletka LM, Muir LA, Lumeng CN
Diabetes 2017 Feb;66(2):392-406
Diabetes 2017 Feb;66(2):392-406
Mixed-lineage kinase 3 pharmacological inhibition attenuates murine nonalcoholic steatohepatitis.
Tomita K, Kohli R, MacLaurin BL, Hirsova P, Guo Q, Sanchez LHG, Gelbard HA, Blaxall BC, Ibrahim SH
JCI insight 2017 Aug 3;2(15)
JCI insight 2017 Aug 3;2(15)
Neuroprotection by selective neuronal deletion of Atg7 in neonatal brain injury.
Xie C, Ginet V, Sun Y, Koike M, Zhou K, Li T, Li H, Li Q, Wang X, Uchiyama Y, Truttmann AC, Kroemer G, Puyal J, Blomgren K, Zhu C
Autophagy 2016;12(2):410-23
Autophagy 2016;12(2):410-23
Galectin-3 expression in hippocampal CA2 following transient forebrain ischemia and its inhibition by hypothermia or antiapoptotic agents.
Hisamatsu K, Niwa M, Kobayashi K, Miyazaki T, Hirata A, Hatano Y, Tomita H, Hara A
Neuroreport 2016 Mar 23;27(5):311-7
Neuroreport 2016 Mar 23;27(5):311-7
Cell surface galectin-3 defines a subset of chemoresistant gastrointestinal tumor-initiating cancer cells with heightened stem cell characteristics.
Ilmer M, Mazurek N, Byrd JC, Ramirez K, Hafley M, Alt E, Vykoukal J, Bresalier RS
Cell death & disease 2016 Aug 11;7(8):e2337
Cell death & disease 2016 Aug 11;7(8):e2337
Maternal immune activation evoked by polyinosinic:polycytidylic acid does not evoke microglial cell activation in the embryo.
Smolders S, Smolders SM, Swinnen N, Gärtner A, Rigo JM, Legendre P, Brône B
Frontiers in cellular neuroscience 2015;9:301
Frontiers in cellular neuroscience 2015;9:301
Rhadinovirus host entry by co-operative infection.
Lawler C, Milho R, May JS, Stevenson PG
PLoS pathogens 2015 Mar;11(3):e1004761
PLoS pathogens 2015 Mar;11(3):e1004761
Imaging white adipose tissue with confocal microscopy.
Martinez-Santibañez G, Cho KW, Lumeng CN
Methods in enzymology 2014;537:17-30
Methods in enzymology 2014;537:17-30
18-HEPE, an n-3 fatty acid metabolite released by macrophages, prevents pressure overload-induced maladaptive cardiac remodeling.
Endo J, Sano M, Isobe Y, Fukuda K, Kang JX, Arai H, Arita M
The Journal of experimental medicine 2014 Jul 28;211(8):1673-87
The Journal of experimental medicine 2014 Jul 28;211(8):1673-87
Galectin-3 functions as an alarmin: pathogenic role for sepsis development in murine respiratory tularemia.
Mishra BB, Li Q, Steichen AL, Binstock BJ, Metzger DW, Teale JM, Sharma J
PloS one 2013;8(3):e59616
PloS one 2013;8(3):e59616
Molecular imaging of the paracrine proangiogenic effects of progenitor cell therapy in limb ischemia.
Ryu JC, Davidson BP, Xie A, Qi Y, Zha D, Belcik JT, Caplan ES, Woda JM, Hedrick CC, Hanna RN, Lehman N, Zhao Y, Ting A, Lindner JR
Circulation 2013 Feb 12;127(6):710-9
Circulation 2013 Feb 12;127(6):710-9
PD-L1 has distinct functions in hematopoietic and nonhematopoietic cells in regulating T cell responses during chronic infection in mice.
Mueller SN, Vanguri VK, Ha SJ, West EE, Keir ME, Glickman JN, Sharpe AH, Ahmed R
The Journal of clinical investigation 2010 Jul;120(7):2508-15
The Journal of clinical investigation 2010 Jul;120(7):2508-15
Glycation of a food allergen by the Maillard reaction enhances its T-cell immunogenicity: role of macrophage scavenger receptor class A type I and II.
Ilchmann A, Burgdorf S, Scheurer S, Waibler Z, Nagai R, Wellner A, Yamamoto Y, Yamamoto H, Henle T, Kurts C, Kalinke U, Vieths S, Toda M
The Journal of allergy and clinical immunology 2010 Jan;125(1):175-83.e1-11
The Journal of allergy and clinical immunology 2010 Jan;125(1):175-83.e1-11
Renal vascular inflammation induced by Western diet in ApoE-null mice quantified by (19)F NMR of VCAM-1 targeted nanobeacons.
Southworth R, Kaneda M, Chen J, Zhang L, Zhang H, Yang X, Razavi R, Lanza G, Wickline SA
Nanomedicine : nanotechnology, biology, and medicine 2009 Sep;5(3):359-67
Nanomedicine : nanotechnology, biology, and medicine 2009 Sep;5(3):359-67
Identification of markers that distinguish monocyte-derived fibrocytes from monocytes, macrophages, and fibroblasts.
Pilling D, Fan T, Huang D, Kaul B, Gomer RH
PloS one 2009 Oct 16;4(10):e7475
PloS one 2009 Oct 16;4(10):e7475
Kinetics of mobilization and differentiation of lymphohematopoietic cells during experimental murine schistosomiasis in galectin-3 -/- mice.
Oliveira FL, Frazão P, Chammas R, Hsu DK, Liu FT, Borojevic R, Takiya CM, El-Cheikh MC
Journal of leukocyte biology 2007 Aug;82(2):300-10
Journal of leukocyte biology 2007 Aug;82(2):300-10
Expression and function of galectin-3, a beta-galactoside-binding protein in activated T lymphocytes.
Joo HG, Goedegebuure PS, Sadanaga N, Nagoshi M, von Bernstorff W, Eberlein TJ
Journal of leukocyte biology 2001 Apr;69(4):555-64
Journal of leukocyte biology 2001 Apr;69(4):555-64
Mac-2, a novel 32,000 Mr mouse macrophage subpopulation-specific antigen defined by monoclonal antibodies.
Ho MK, Springer TA
Journal of immunology (Baltimore, Md. : 1950) 1982 Mar;128(3):1221-8
Journal of immunology (Baltimore, Md. : 1950) 1982 Mar;128(3):1221-8
No comments: Submit comment
Supportive validation
- Submitted by
- Invitrogen Antibodies (provider)
- Main image

- Experimental details
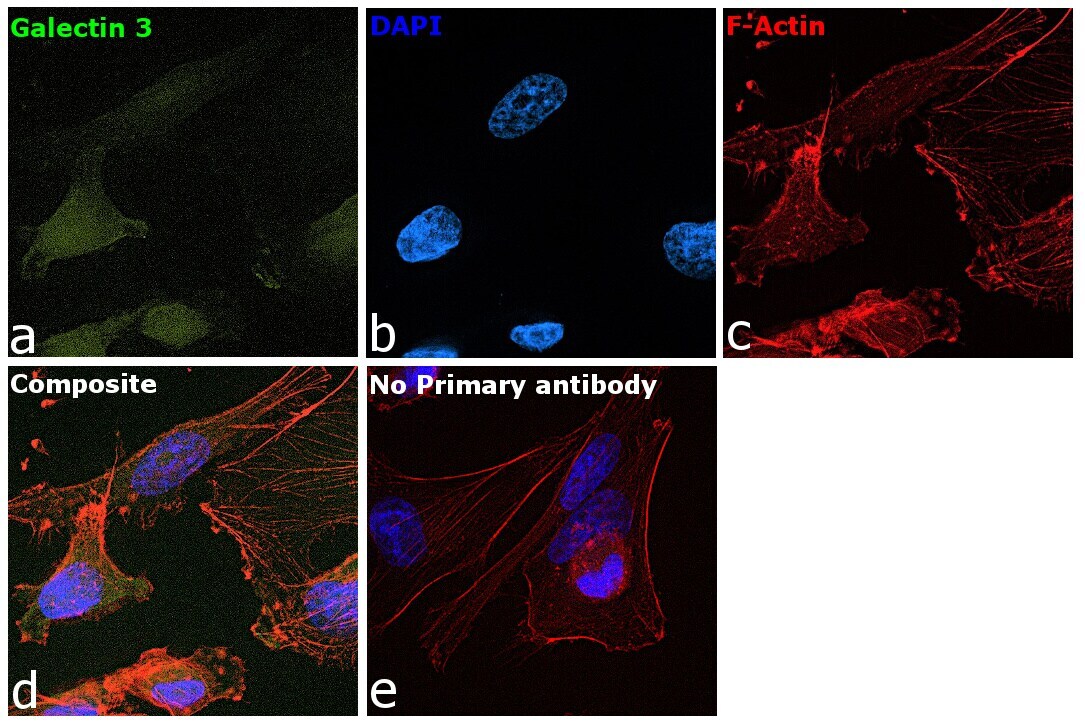
- Immunofluorescence analysis of Galectin 3 was performed using 70% confluent log phase MDA-MB-231 cells. The cells were fixed with 4% paraformaldehyde for 10 minutes, permeabilized with 0.1% Triton™ X-100 for 15 minutes, and blocked with 2% BSA for 45 minutes at room temperature. The cells were labeled with Galectin 3 Monoclonal Antibody (eBioM3/38 (M3/38)), eBioscience™ (Product # 14-5301-85) at 1:100 dilution in 0.1% BSA, incubated at 4 degree celsius overnight and then labeled with Goat anti-Rat IgG (H+L) Cross-Adsorbed Secondary Antibody, Alexa Fluor 488 (Product # A11006), (1:2000), for 45 minutes at room temperature (Panel a: Blue). Nuclei (Panel b:Green) were stained with ProLong™ Diamond Antifade Mountant with DAPI (Product # P36962). F-actin (Panel c: Red) was stained with Rhodamine Phalloidin (Product # R415, 1:300). Panel d represents the merged image showing Nucleus, nucleolus and cytoplasm localization. Panel e represents control cells with no primary antibody to assess background. The images were captured at 60X magnification.
- Submitted by
- Invitrogen Antibodies (provider)
- Main image

- Experimental details
- Immunofluorescence analysis of Galectin 3 was performed using 70% confluent log phase MDA-MB-231 cells. The cells were fixed with 4% paraformaldehyde for 10 minutes, permeabilized with 0.1% Triton™ X-100 for 15 minutes, and blocked with 2% BSA for 45 minutes at room temperature. The cells were labeled with Galectin 3 Monoclonal Antibody (eBioM3/38 (M3/38)), eBioscience™ (Product # 14-5301-85) at 1:100 dilution in 0.1% BSA, incubated at 4 degree celsius overnight and then labeled with Goat anti-Rat IgG (H+L) Cross-Adsorbed Secondary Antibody, Alexa Fluor 488 (Product # A11006), (1:2000), for 45 minutes at room temperature (Panel a: Blue). Nuclei (Panel b:Green) were stained with ProLong™ Diamond Antifade Mountant with DAPI (Product # P36962). F-actin (Panel c: Red) was stained with Rhodamine Phalloidin (Product # R415, 1:300). Panel d represents the merged image showing Nucleus, nucleolus and cytoplasm localization. Panel e represents control cells with no primary antibody to assess background. The images were captured at 60X magnification.

Supportive validation
- Submitted by
- Invitrogen Antibodies (provider)
- Main image

- Experimental details
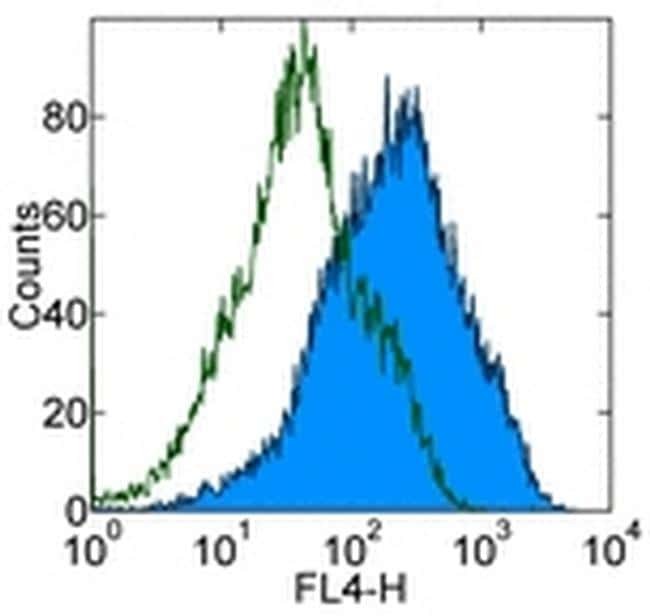
- Staining of mouse thioglycolate-induced peritoneal exudate cells (PECs) with 0.25 µg of Rat IgG2a kappa Isotype Control Purified (Product # 14-4321-82) (open histogram) or 0.25 µg of Anti-Human/Mouse Galectin-3 Purified (filled histogram) followed by F (ab')2 Anti-Rat IgG APC (Product # 17-4822-82). Total viable cells were used for analysis.
- Submitted by
- Invitrogen Antibodies (provider)
- Main image

- Experimental details
- Staining of mouse thioglycolate-induced peritoneal exudate cells (PECs) with 0.25 µg of Rat IgG2a kappa Isotype Control Purified (Product # 14-4321-82) (open histogram) or 0.25 µg of Anti-Human/Mouse Galectin-3 Purified (filled histogram) followed by F (ab')2 Anti-Rat IgG APC (Product # 17-4822-82). Total viable cells were used for analysis.

Supportive validation
- Submitted by
- Invitrogen Antibodies (provider)
- Main image
- Experimental details
- NULL
- Submitted by
- Invitrogen Antibodies (provider)
- Main image
- Experimental details
- NULL
- Submitted by
- Invitrogen Antibodies (provider)
- Main image
- Experimental details
- NULL
- Submitted by
- Invitrogen Antibodies (provider)
- Main image
- Experimental details
- NULL
- Submitted by
- Invitrogen Antibodies (provider)
- Main image

- Experimental details
- NULL
- Submitted by
- Invitrogen Antibodies (provider)
- Main image
- Experimental details
- NULL

- Submitted by
- Invitrogen Antibodies (provider)
- Main image
- Experimental details
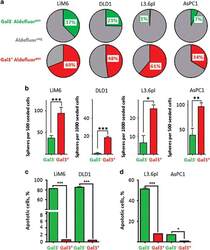
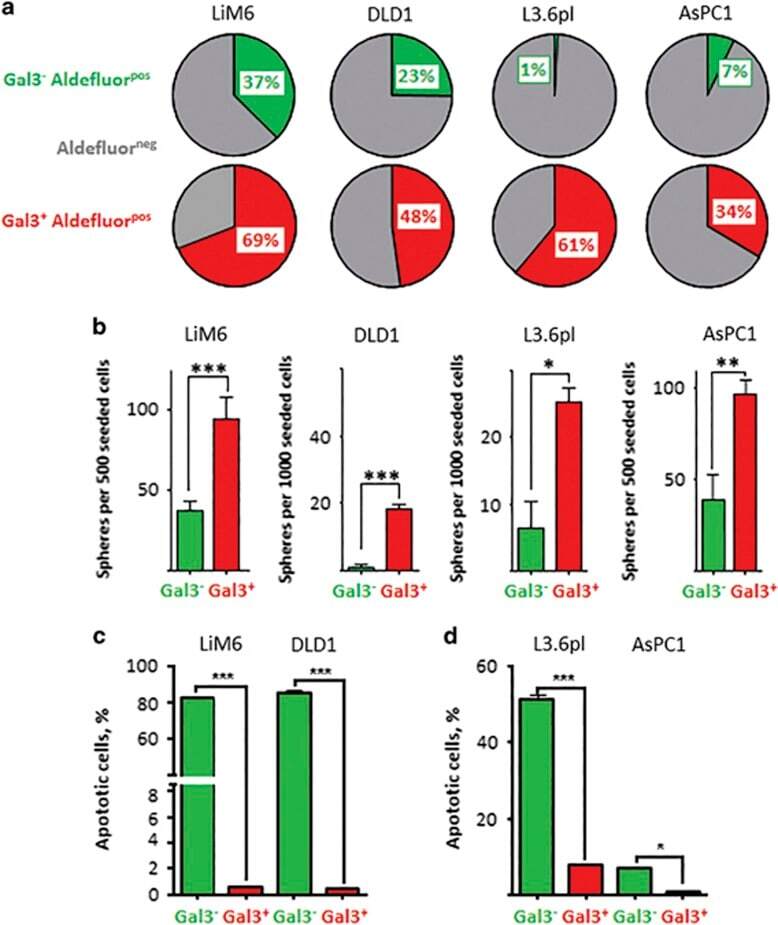
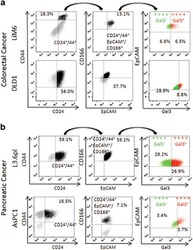
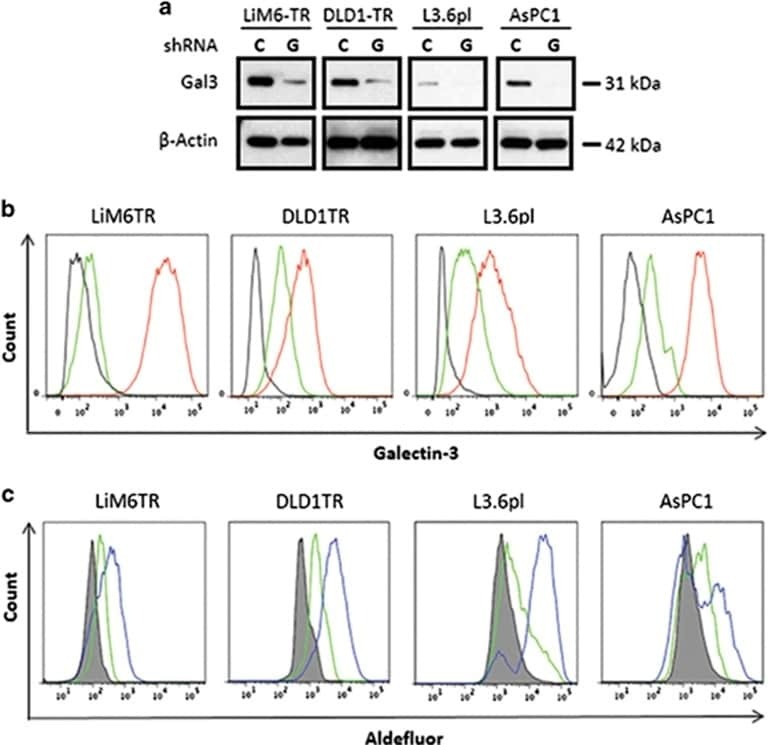
- Figure 2 Gal3 positive CSC subset displays increased stemness characteristics. ( a ) ALDH activity was evaluated by flow cytometric analysis in Gal3 positive CSC (in red) and Gal3 negative CSC (in green). ALDH negative fractions are illustrated in gray. ( b ) Sphere formation ability (SFA) was determined. Gal3 positive CSC (red) accounted for significantly more spheres than Gal3 negative CSC (green). ( c ) TRAIL-resistance in Gal3 positive /Gal3 negative colon cancer CSC subsets was determined by APO-BRDU assay. Apoptotic cells are displayed as percentage of total cell count. ( d ) TRAIL-resistance in Gal3 positive /Gal3 negative CSC pancreatic cancer subsets. All experiments were performed in triplicate (see text for details). P
- Submitted by
- Invitrogen Antibodies (provider)
- Main image
- Experimental details
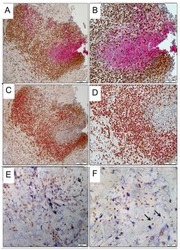
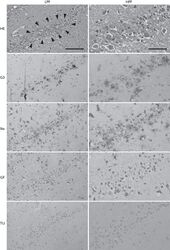
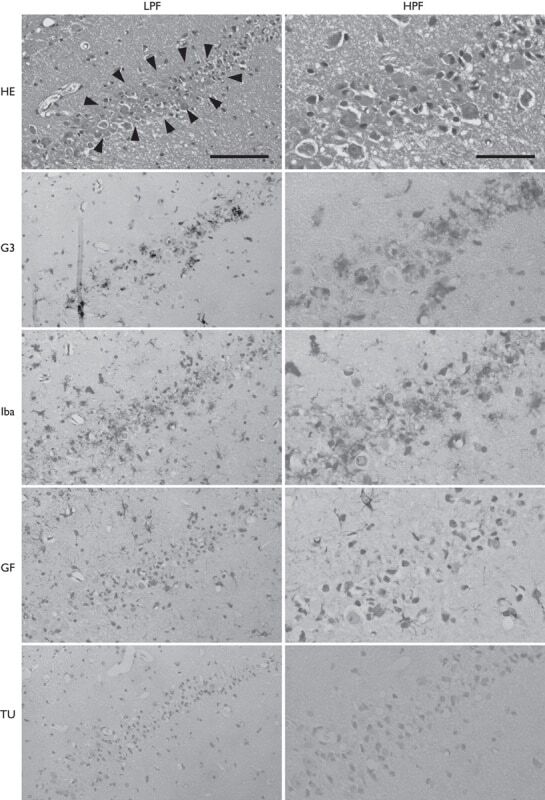
- Fig. 2 H&E staining, immunohistochemical staining for galectin-3, Iba-1 and GFAP, and apoptotic DNA fragmentation detected by TUNEL staining in a low-power field and a high-power field of the hippocampus at 96 h after ischemic insult. Many damaged CA2 neurons had lost their nuclear affinity for hematoxylin and appeared as an eosinophilic 'ghost neuron' in H&E staining. The localization of galectin-3-positive cells coincided with that of Iba-1-positive cells. There were no GFAP-positive cells in the CA2 damaged area. Some of the TUNEL-positive CA2 neurons were distinguishable among the CA1 neurons by the shape of positive stained nuclei. Scale bars in LPF and HPF of H&E staining are 100 and 50 mum, respectively. G3, galectin-3; GF, GFAP; HE, HE staining; HPF, high-power field; Iba, Iba-1; LPF, low-power field; TU, TUNEL staining.
- Submitted by
- Invitrogen Antibodies (provider)
- Main image
- Experimental details
- Figure 1 Surface Gal3 defines a subtype of epithelial CSC. ( a ) Colorectal cancer cells LiM6 and DLD1 were investigated by flow cytometry for cell surface markers CD24/CD44 (left). CD24+/CD44+-cells (in black) were then investigated for CD166/EpCAM-expression (middle) and CD24+/CD44+/CD166+/EpCAM+-positive cells (in black middle) for Gal3-expression (right panel), where ++++ Gal3 - in green refers to cells positive for CD24, CD44, CD166, and EpCAM, but negative for Gal3, and ++++ Gal3 + in red refers to cells positive for CD24, CD44, CD166, EpCAM, and Gal3. ( b ) Pancreatic cancer cell lines AsPC1 and L3.6pl were subjected to the same analysis as in ( a )

- Submitted by
- Invitrogen Antibodies (provider)
- Main image

- Experimental details
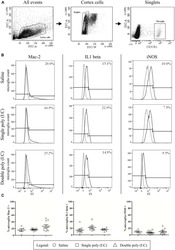
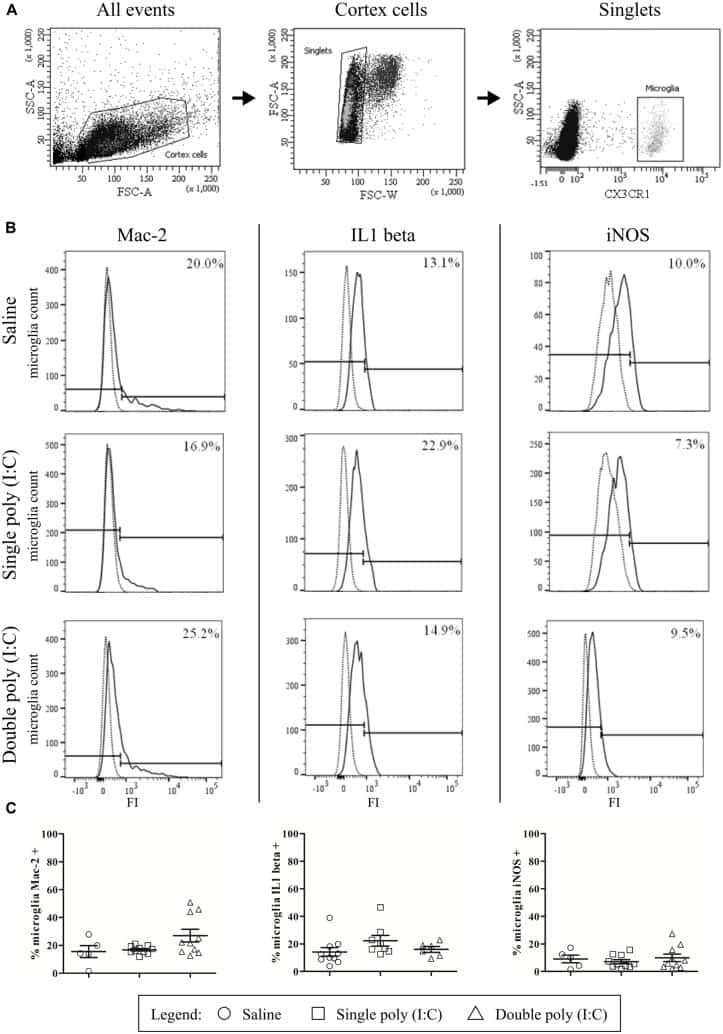
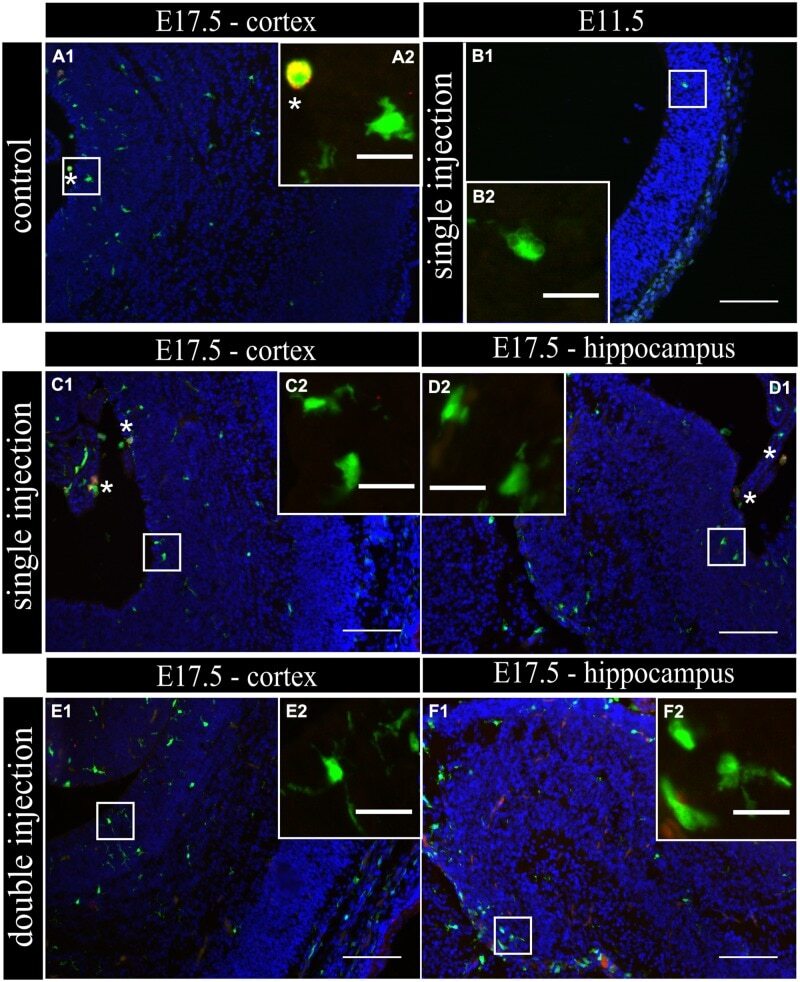
- FIGURE 2 Embryonic microglial cell population is poorly immunoreactive to the Mac-2/Galectin-3 antibody after single and double injection of poly (I:C). (A-F1) Coronal sections of embryonic brains, with cell nucleus staining in blue (DAPI) and microglial (CX3CR1-eGFP) cells in green. Immunohistochemical staining using a Mac-2 antibody (red) showed that at E17.5 almost no microglial cells in the cortex were immunoreactive for Mac-2 (A2) after injection with saline. At E11.5 (B2) and E17.5 (C2,E2) in the cortex and E17.5 hippocampal area (D2,F2) there was no increased percentage of microglial cells expressing the activation marker after poly (I:C) challenge compared to control. White square indicates the location of the cells in the tissue showed in the inset; * indicates a Mac-2 positive eGFP cell. Examples of one control brain area and poly (I:C) group only as they were not significantly different. Scale bar = 100 mum and for insets = 20 mum.
- Submitted by
- Invitrogen Antibodies (provider)
- Main image
- Experimental details
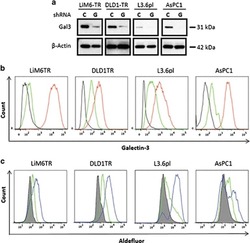
- Figure 4 Silencing of Gal3 shifts CSC subset to a Gal3 negative CSC subset. ( a ) Western blot analysis for comparison of total Gal3 in LiM6TR or DLD1TR colon cancer cells and L3.6pl or AsPC1 pancreatic cancer cells after infection with lentiviral particles for control-shRNA ( c ) or Gal3-shRNA (G). Each pair of control and Gal3 knockdown cells were run side by side on the same gel. Comparison of Gal3 expression between cell lines has been previously published 10 ( b ) Flow cytometric analysis of colon cancer and pancreatic cancer cells after infection with lentiviral particles for control-shRNA (red trace) or Gal3-shRNA (green trace). Black trace is background staining. ( c ) ALDH activity was analyzed by flow cytometry. ALDEFLUOR activity in colon cancer and pancreatic cancer cells after infection with lentiviral particles for control-shRNA (blue trace) or Gal3-shRNA (green trace). Gray profile is background staining
- Submitted by
- Invitrogen Antibodies (provider)
- Main image
- Experimental details
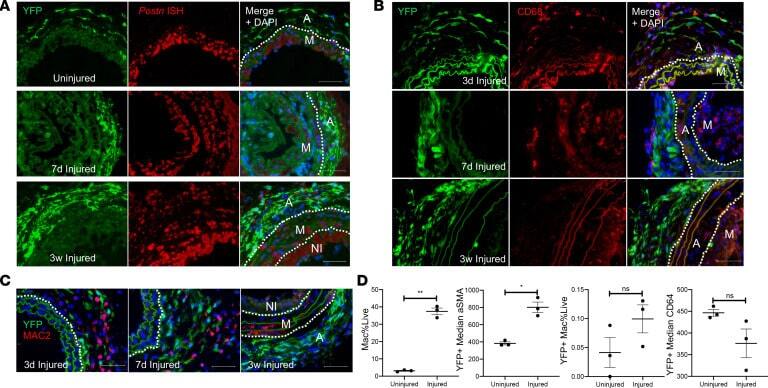
- Figure 5 AdvSca1-SM cells adopt a myofibroblast, and only rarely macrophage, phenotype in response to vascular injury. Gli1 -Cre ERT -YFP mice were subjected to carotid arterial injury, and uninjured right and injured left carotids were harvested at 3 days, 7 days, and 3 weeks postinjury; fixed; and embedded in OCT. ( A ) Arterial sections were immunofluorescently stained for YFP (green), and in situ hybridization was used to detect periostin transcripts (red). Representative images from N = 3 at each time point. Note strong induction of periostin in AdvSca1-SM cells in response to injury. ( B and C ) Arterial sections were immunofluorescently stained for YFP (green) and CD68 ( B ; red) or MAC2 ( C ; red). Representative images from N = 3 per time point. Note that AdvSca1-SM cells do not coexpress either macrophage marker. Scale bars for panels A - C : 50 mum. M, arterial media; A, arterial adventitia; NI, neointima. Dashed lines indicate the external and internal elastic laminae. ( D ) Single-cell suspensions were isolated from uninjured and 7-day postinjured carotid arteries; cells were stained for SCA1, YFP, CD11c, MHCII, LY6G, CD11b, CD64, alphaSMA, and Aqua VI and analyzed by flow cytometry. Total macrophages (left graph) and YFP + AdvSca1-SM cell-derived macrophages (middle right) were quantified as percentage of all live cells. Median expression of alphaSMA (middle left) and CD64 (right) by the YFP + cell population was expressed as absolute value. Each point represent
- Submitted by
- Invitrogen Antibodies (provider)
- Main image
- Experimental details
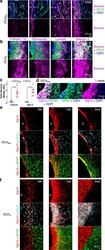
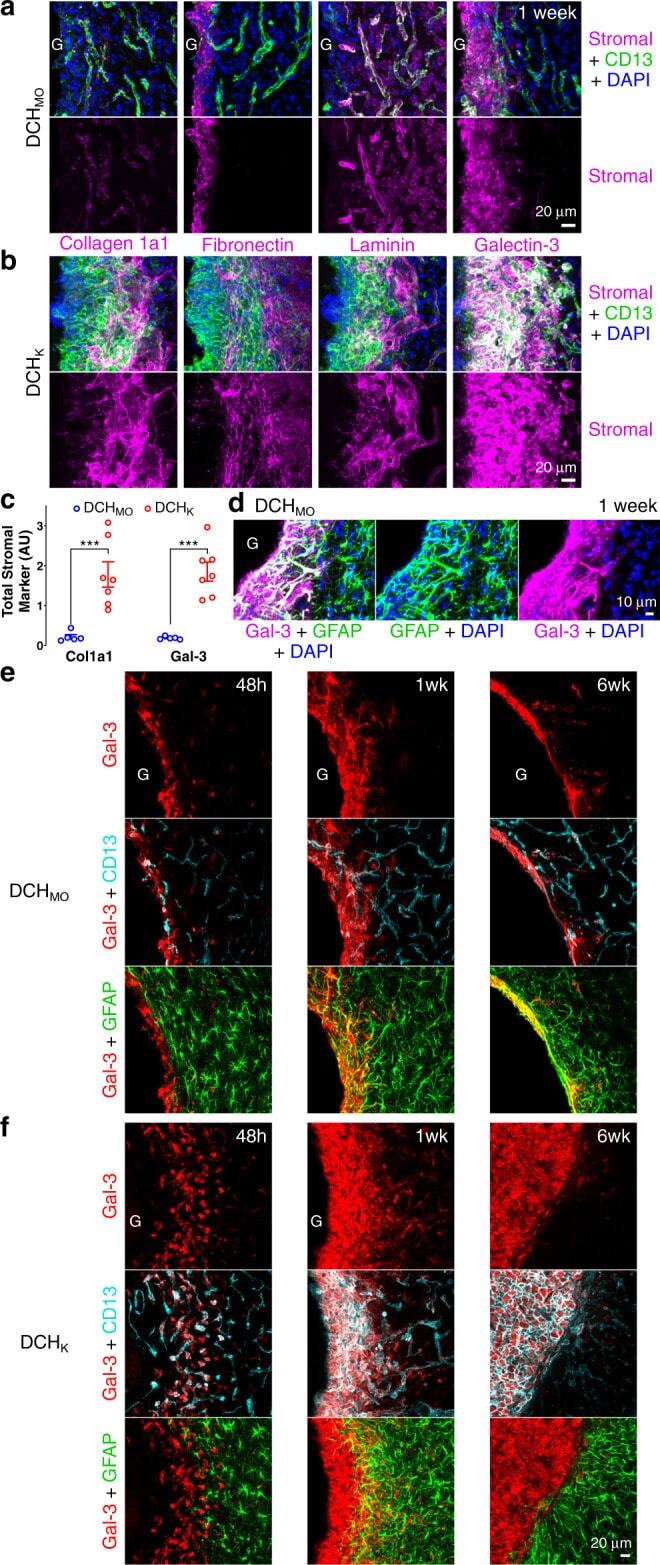
- Fig. 4 Hydrogels evoke fibrotic responses at the material-tissue interface that can involve stromal or astroglial cells. a , b Detail images of stromal-associated markers, collagen-1a1 (Col1a1), fibronectin, laminin, and galectin-3 (Gal-3) and their relationship to non-neural CD13-positive cells at the tissue interface of DCH MO a and DCH K b at 1 week after injection (hydrogels, G). Colocalization of markers with CD13-positive cells is seen as white staining. c Quantification of total Col1a1 and Gal-3 staining at 1 week after hydrogel injection. *** P = 0.0003 and =0.0002 for DCH MO versus DCH K for Col1a1 and Gal-3 stromal markers, respectively, two-way ANOVA with Bonferroni. Graphs show mean +- s.e.m with individual data points showing n = 5 and 7 mice for DCH MO and DCH K , respectively. d Detail image showing that adjacent to DCH MO , Gal-3 colocalizes with a narrow band of GFAP-positive astrocytes that border the gel at 1 week. Gal-3 and GFAP colocalization is seen as white staining. e , f Detail images showing the temporal evolution of Gal-3 expression at the interface of DCH MO e and DCH K f at acute (48 h, 48 h), subacute (1 week, 1wk) and chronic (6 weeks, 6wk) timepoints after injection. Gal-3 and GFAP colocalization is seen as yellow staining. Gal-3 and CD13 colocalization is seen as white staining.
- Submitted by
- Invitrogen Antibodies (provider)
- Main image

- Experimental details
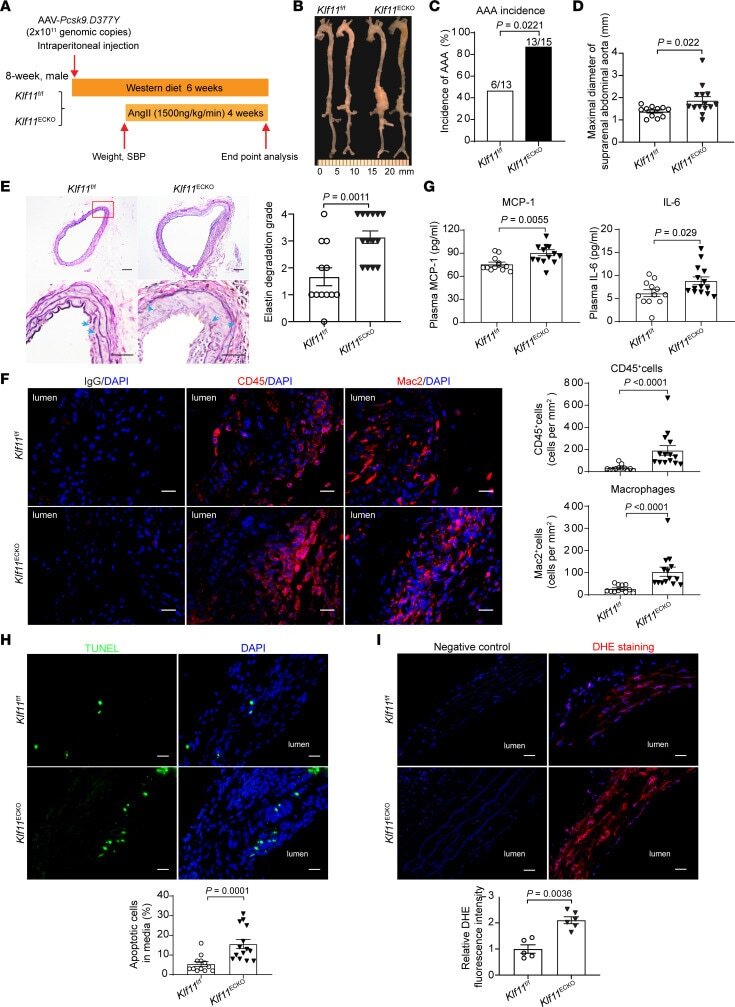
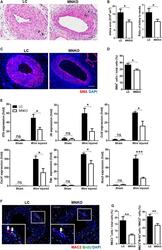
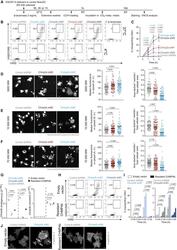
- Figure 2 Endothelial cell-specific KLF11 depletion aggravates Pcsk9 /AngII-induced AAA. The Pcsk9 /AngII-induced AAA model was performed on 8-week-old males with Klf11 ECKO ( n = 15) and their littermate Klf11 fl/fl ( n = 13) mice. ( A ) Schematics of Pcsk9 /AngII-induced AAA model. ( B ) Representative morphology of aortas from AngII-infused Klf11 fl/fl and Klf11 ECKO mice. ( C ) Incidence of AAA. ( D ) Maximal diameters of suprarenal abdominal aortas (SAAs) from AngII-infused Klf11 fl/fl ( n = 12) and Klf11 ECKO ( n = 14) mice. ( E ) Representative Verhoeff-Van Gieson (VVG) staining and quantification of elastin degradation in SAAs from AngII-infused Klf11 fl/fl ( n = 12) and Klf11 ECKO ( n = 14) mice. Scale bar: 50 mum. ( F ) Representative immunofluorescence staining and quantification of leukocyte (CD45 + ) and macrophage (Mac2 + ) infiltration in the aortic wall of SAAs from AngII-infused Klf11 fl/fl ( n = 12) and Klf11 ECKO ( n = 14) mice. Scale bar: 20 mum. ( G ) ELISA analysis of MCP-1 and IL-6 in the plasma from AngII-infused Klf11 fl/fl ( n = 12) and Klf11 ECKO ( n = 14) mice. ( H ) Representative TUNEL staining (green) and quantification of apoptotic cells in the media of SAAs from AngII-infused Klf11 fl/fl ( n = 12) and Klf11 ECKO ( n = 14) mice. Scale bar: 20 mum. ( I ) Representative DHE staining (red) and quantification of ROS production in the aortic wall of SAAs from AngII-infused Klf11 fl/fl ( n = 5) and Klf11 ECKO ( n = 6). Scale bar: 20 mum. Data are pres
- Submitted by
- Invitrogen Antibodies (provider)
- Main image
- Experimental details
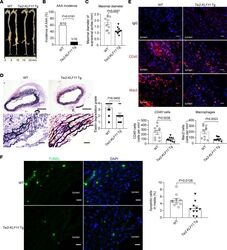
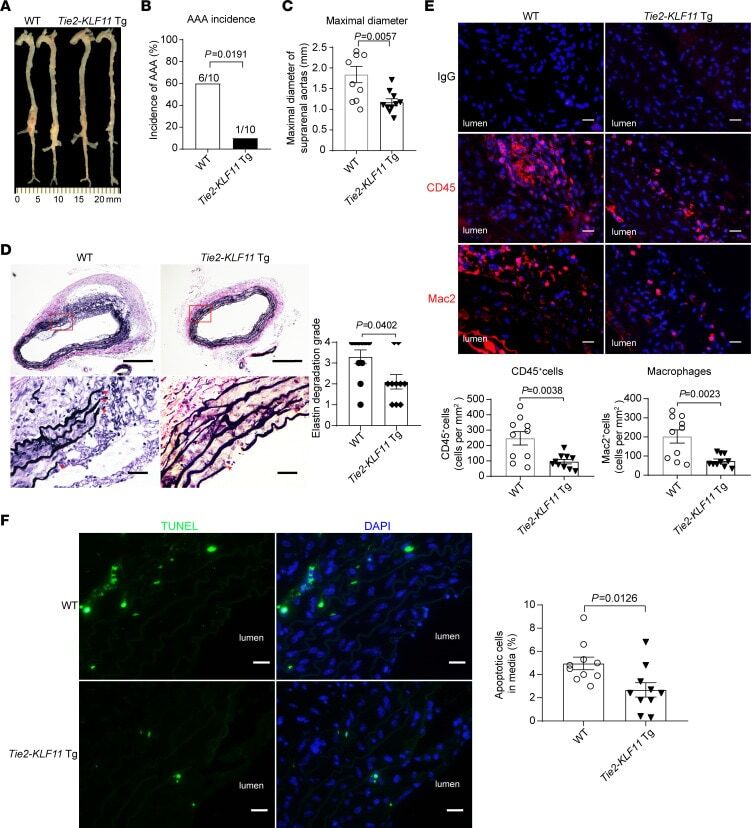
- Figure 3 EC-selective overexpression of KLF11 attenuates Pcsk9 /AngII-induced AAA. The Pcsk9 /AngII-induced AAA model was performed on 10-week-old male EC-selective KLF11 transgenic mice ( Tie2-KLF11 -Tg, n = 12) and littermate control mice (WT, n = 13). ( A ) Representative morphology of aortas from AngII-infused WT and Tie2-KLF11 -Tg mice. ( B ) Incidence of AAA. ( C ) Maximal diameters of SAAs. ( D ) Representative VVG staining and quantification of elastin degradation in SAAs from WT and Tie2-KLF11 -Tg mice ( n = 10/group). Scale bar: 200 mum for whole aortic sections, 20 mum for magnified areas. ( E ) Representative immunofluorescence staining and quantification of leukocyte (CD45 + ) and macrophage (Mac2 + ) infiltration in the aortic wall of SAAs from WT and Tie2-KLF11 -Tg mice ( n = 10/group). Scale bar: 20 mum. ( F ) Representative TUNEL staining (green) and quantification of apoptotic cells in the media of SAAs from WT and Tie2-KLF11 -Tg mice ( n = 10/group). Scale bar: 20 mum. Data are presented as mean +- SEM. chi 2 test ( B ), Student''s 2-tailed t test ( C , E , and F ), Mann-Whitney U test ( D ).
- Submitted by
- Invitrogen Antibodies (provider)
- Main image
- Experimental details
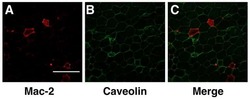
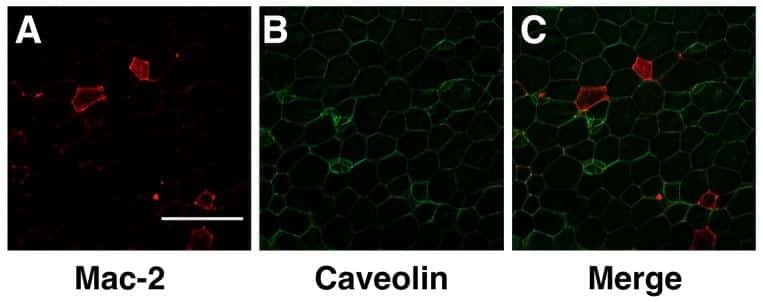
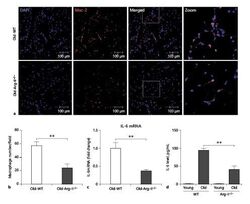
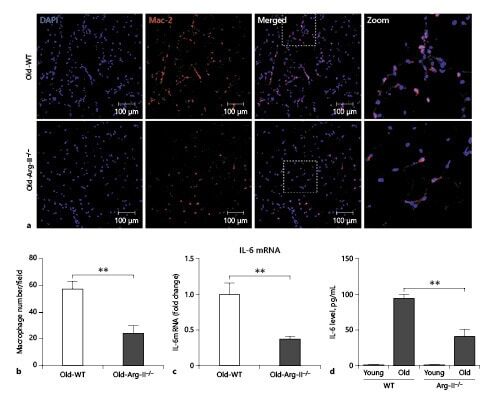
- Fig. 1. Decreased macrophage accumulation in the adipose tissue of old Arg-II deficient (Arg-II -/- ) mice. a Representative confocal images of macrophage accumulation in the peri-uterus fat tissue of old WT and Arg-II -/- mice as assessed by immunofluorescence staining of paraffin-embedded sections with antibody against the macrophage marker Mac-2 (red), followed by counterstaining of the nuclei with DAPI (blue). Scale bar = 100 mum. b Quantification of the macrophage number per field is shown in the graph below (left panel), n = 4. c qRT-PCR analysis of IL-6 mRNA expression in the peri-uterus fat tissue, n = 8. d IL-6 protein level in the conditioned medium from peri-uterus fat tissues of mice measured by ELISA, n = 4. n indicates the number of animals of each experimental group. ** p < 0.01 between the indicated groups. Arg, arginase; WT, wild type; DAPI, 4'6-diamidino-2-phenyl-indole, dihydrochloride.
- Submitted by
- Invitrogen Antibodies (provider)
- Main image
- Experimental details
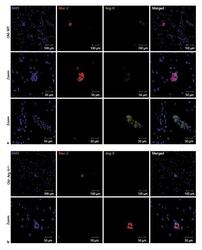
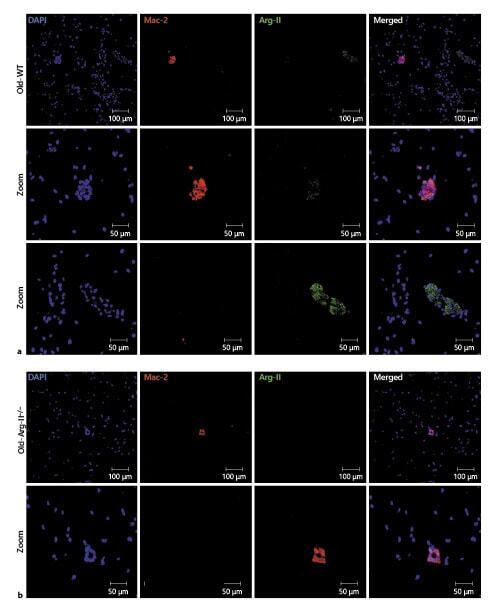
- Fig. 5. Localization of Arg-II in adipose tissues in aging. Confocal images of the localization of Arg-II in adipose tissues of old WT mice ( a ) and Arg-II -/- mice ( b ) as assessed by immunofluorescence staining of paraffin-embedded sections with antibodies against Mac-2 (red) and Arg-II (green), followed by counterstaining of the nuclei with DAPI (blue). Scale bar = 100 mum for lower amplification in the upper panel of a , b or 50 mum for zoomed images. Shown are representative images from 3 independent series of experiments. Arg, arginase; WT, wild type; DAPI, 4'6-diamidino-2-phenyl-indole, dihydrochloride.
- Submitted by
- Invitrogen Antibodies (provider)
- Main image
- Experimental details
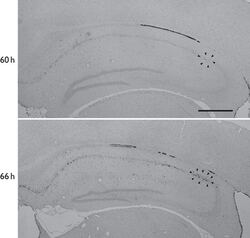
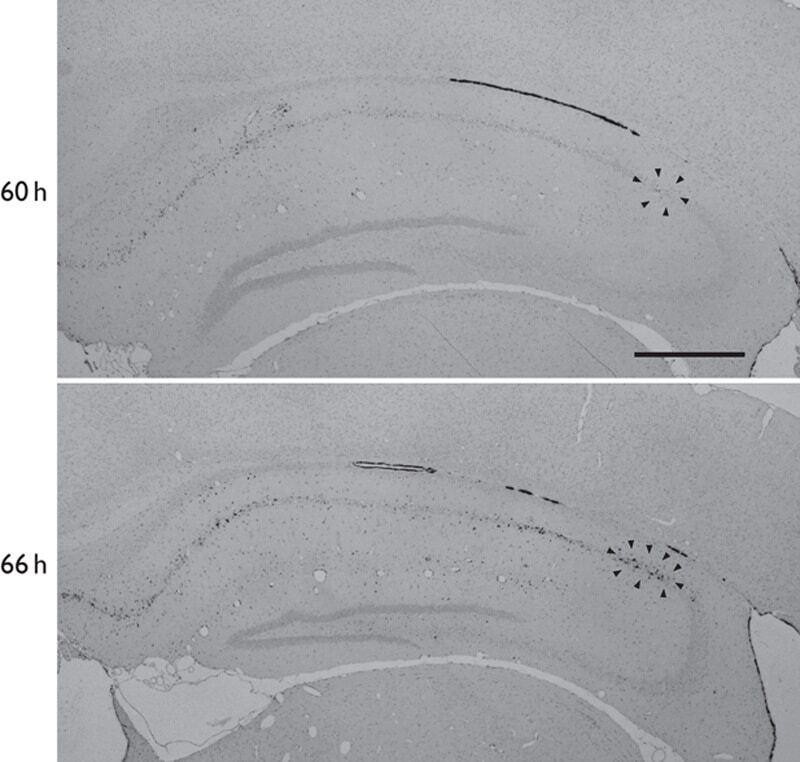
- Fig. 1 Galectin-3 immunostaining in gerbil whole hippocampus including the CA2 sector at 60 h (upper) and 66 h (lower) after ischemic insult. In 60 h, weak immunoreactivity was recognized in CA2 (surrounded by arrowheads). In 66 h, prominent immunostaining was observed in CA2 (surrounded by arrowheads). Ependymal cells lining the lateral ventricles are strongly positive for galectin-3 as an internal positive control. The scale bar in the upper photograph is 500 mum.
- Submitted by
- Invitrogen Antibodies (provider)
- Main image
- Experimental details
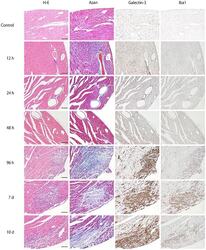
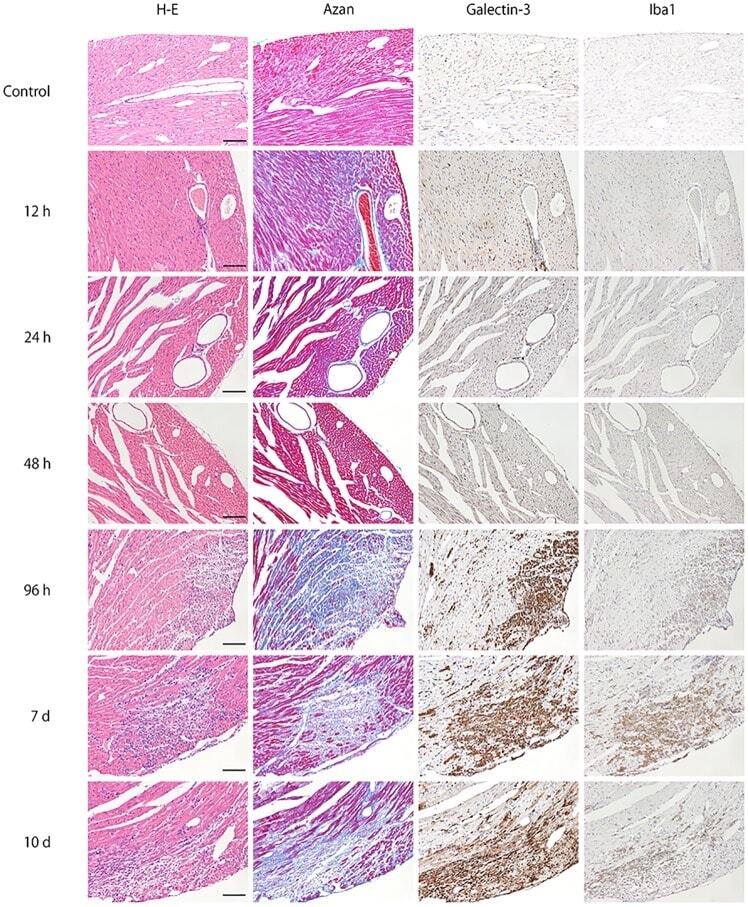
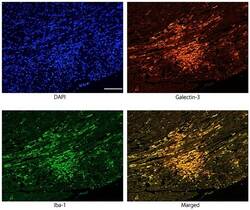
- Fig 1 Time-course of representative microphotographs of H&E staining, Azan staining for fibrotic lesions, and immunohistochemistry for galectin-3 and Iba1 in heart tissues at 0, 12, 24, 48, 96 hours, 7 and 10 days after intraperitoneal inoculation of EMCV. For both H&E and Azan staining, notable changes was not observed until 48 hours after EMCV inoculation. Infiltration of inflammatory cells and fibrosis was observed 96 hours after inoculation. Inflammation and fibrosis peaked at 7 days after inoculation. At 0, 12 and 24 hours, there were no galectin-3 and Iba1-positive cell in heart tissues. At 48 hours after EMCV inoculation, interstitial infiltration of a few cells was detected by both galectin-3 and Iba1 immunohistochemistry, and this infiltration was greater at 96 hours. It peaked on day 7 and was observed until day 10. Scale bar = 100 mum.
- Submitted by
- Invitrogen Antibodies (provider)
- Main image
- Experimental details
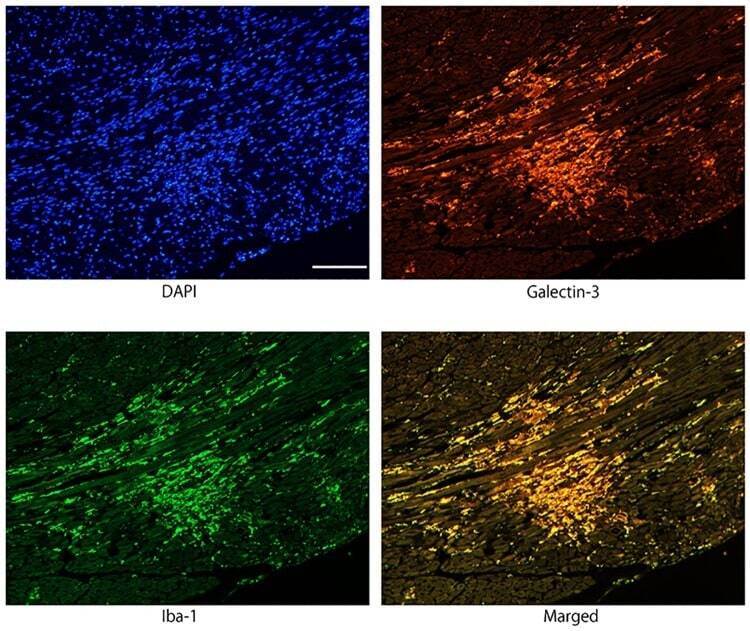
- 10.1371/journal.pone.0210971.g002 Fig 2 Immunofluorescence images confirming the co-localization of galectin-3 and Iba1 immunoreactivity in activated macrophages/histiocytes in myocarditis lesion 96 hours after EMCV inoculation. Galectin-3 and Iba1 were expressed in the same cells of merged photograph, indicating that infiltrating galectin-3 positive cells are macrophages. Scale bar = 100 mum.
- Submitted by
- Invitrogen Antibodies (provider)
- Main image
- Experimental details
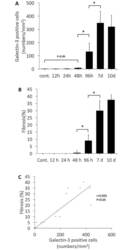
- Fig 3 Quantification and association between the galectin-3 positive cell number and the degree of fibrosis. A, The number of galectin-3 positive cells (determined by immunohistochemistry) showing myocardial infiltration was counted at each time point. B, The degree of myocardial fibrosis (determined by of Azan staining) was quantified as percentage of fibrotic area to total myocardial tissue at each time point. C, Association between galectin-3 positive cell number and degree of fibrosis. The galectin-3 positive cell numbers were positively correlated with the degree of myocardial fibrosis. *Statistically different from each group (p < 0.05), determined by ANOVA.

- Submitted by
- Invitrogen Antibodies (provider)
- Main image
- Experimental details
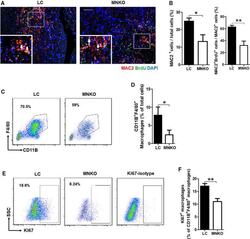
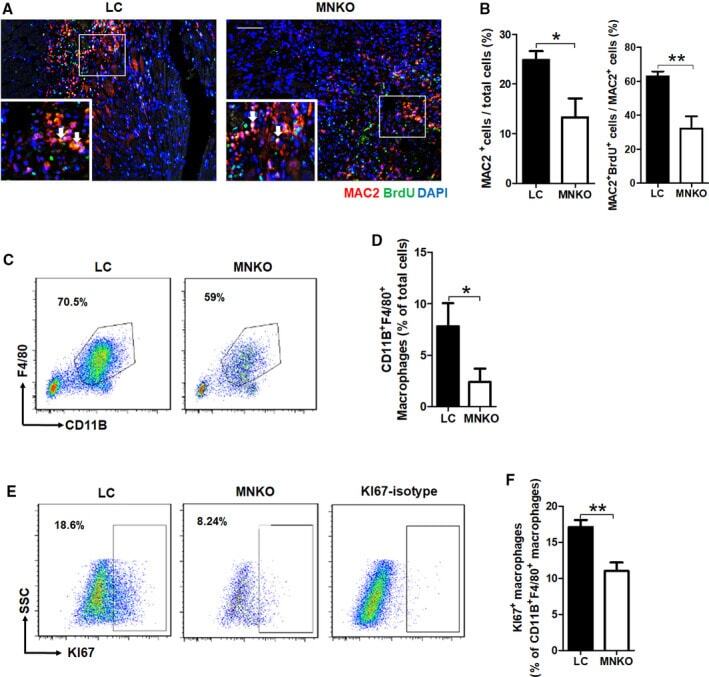
- Figure 2 Macrophage NCOR1 (nuclear receptor corepressor 1) deficiency inhibits proliferation of cardiac macrophages after myocardial infarction. A , Representative immunofluorescence staining of MAC2 and BrdU in peri-infarct region of hearts from littermate control and macrophage Ncor1 knockout mice 7 days after myocardial infarction. The arrows point to MAC2/BrdU double-positive cells. Scale bar: 200 um. B , Quantification of MAC2-positve cells and MAC2/BrdU double-positive cells. n=3:3. C , Representative flow cytometry analysis of macrophages in whole hearts from littermate control and macrophage Ncor1 knockout mice 7 days after myocardial infarction. D , Quantification of CD11B + F4/80 + macrophages. n=5:4. E , Representative flow cytometry analysis of KI67 + macrophages in whole hearts from littermate control and macrophage Ncor1 knockout mice 7 days after myocardial infarction. F , Quantification of KI67 + macrophages. n=5:4. Values are expressed as mean+-SEM. BrdU indicates bromodeoxyuridine; KI67, nuclear proliferation antigen; LC, littermate control; MAC2, galectin3; MNKO, macrophage Ncor1 knockout; and SSC, side scatter. * P
- Submitted by
- Invitrogen Antibodies (provider)
- Main image
- Experimental details
- Figure 3 Macrophage NCOR1 (nuclear receptor corepressor 1) deficiency inhibits arterial injury-induced neointimal hyperplasia. A , Representative hematoxylin and eosin staining of cross section of femoral arteries from littermate control and macrophage Ncor1 knockout mice 28 days after wire injury. B , Quantification of intima area and intima to media ratio. n=7:7. C , Representative immunofluorescence staining of alpha-smooth muscle actin in injured arteries. D , Quantification of smooth muscle actin -positive cells. n=5:4. E , Quantitative reverse transcription polymerase chain reaction analysis of inflammatory genes in femoral arteries from littermate control and macrophage Ncor1 knockout mice 7 days after wire injury. Femoral arteries isolated from 3 to 4 mice were mixed together as 1 technical sample, and 3 technical samples were used in each group. F , Representative immunofluorescence staining of MAC2 and BrdU in injured femoral arteries from littermate control and macrophage Ncor1 knockout mice 21 days after wire injury. The arrows point to MAC2/BrdU double-positive cells. G , Quantification of MAC2-positive cells and MAC2/BrdU double-positive cells. n=5:5. All scale bars: 200 um. Values are expressed as mean+-SEM. Ccl2 indicates C-C motif chemokine ligand 2; Cxcl1 , C-X-C motif chemokine ligand 1; Il-1b , interleukin 1 beta; Il-6 , interleukin 6; LC, littermate control; MNKO, macrophage Ncor1 knockout; Nos2 , nitric oxide synthase 2; ns, not significant; and Tnfa , t

- Submitted by
- Invitrogen Antibodies (provider)
- Main image
- Experimental details
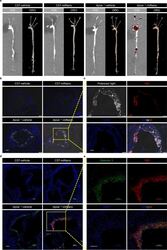
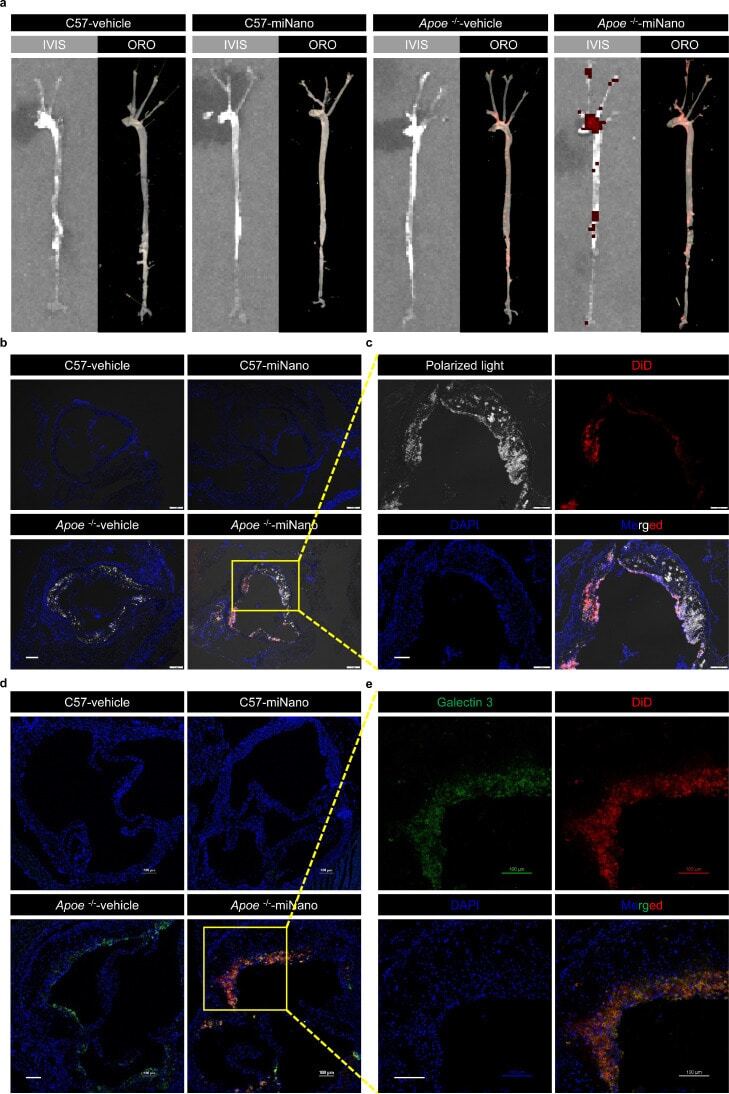
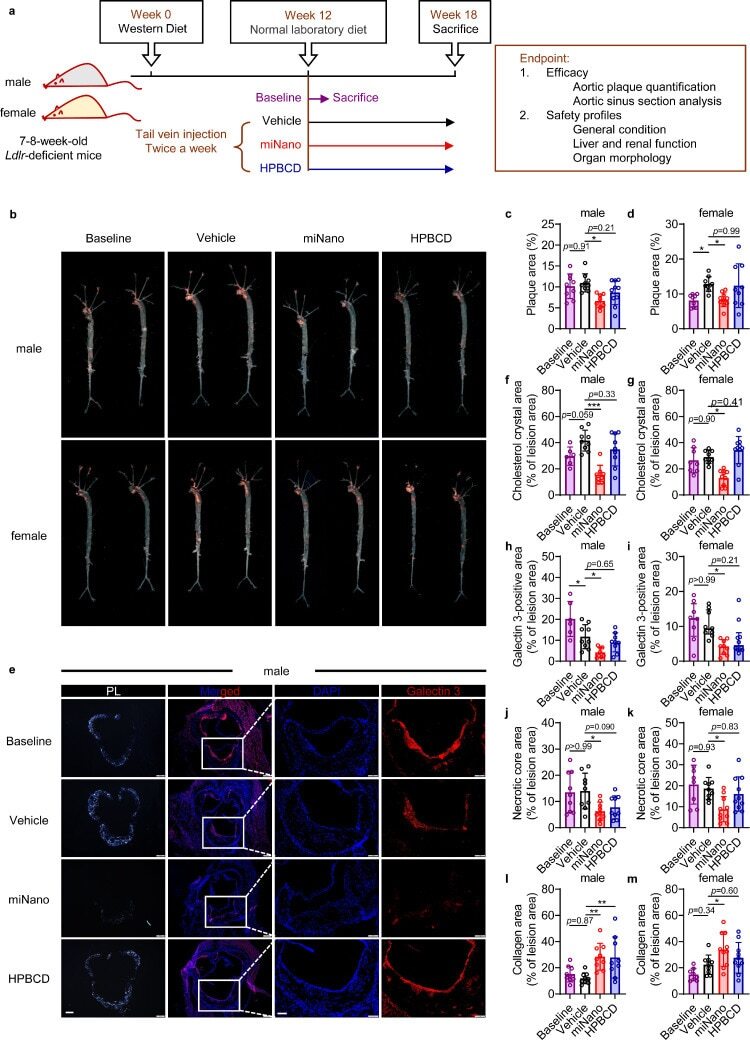
- Fig. 2 miNano targets CCs and macrophages in atherosclerotic plaques in vivo. Apoe -deficient mice fed on a western diet or C57BL/6J mice fed on a standard laboratory diet for 12 weeks were given one dose of vehicle or 250 mg/kg DiD-miNano via tail vein ( n = 4). 24 h later, aortas were collected for ( a ) imaging DiD by IVIS and lipids by ORO stain; Aortic sinus was sectioned for ( b and c ) visualizing CCs under polarized light and ( d and e ) staining macrophages by galectin 3 antibody. ( b ) Representative merged images of DAPI-stained aortic sinus slides under a fluorescent microscope. ( c ) Magnified images from the yellow box in ( b ) under separated channels. ( d ) Representative merged images of DAPI- and galectin 3-stained aortic sinus slides under a confocal microscope. ( e ) Magnified images from the yellow box in ( d ) under separated channels. ( b - e ) DiD-miNano was detected by Cy5 fluorescent signal. Scale bars: ( b ) 200 mum, ( c-e ) 100 mum. Fig 2
- Submitted by
- Invitrogen Antibodies (provider)
- Main image
- Experimental details
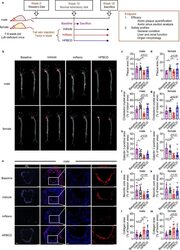
- Fig. 3 miNano inhibits atherosclerosis in Ldlr -deficient mice. ( a ) Schematic diagram of treatment. 7, 8-week-old male and female Ldlr -deficient mice were challenged with a western diet for 12 weeks to establish atherosclerosis. Mice were then fed on a normal laboratory diet and randomized to either be sacrificed as a baseline or treated by vehicle, 250 mg/kg miNano, or 400 mg/kg HPBCD twice a week via tail vein injection for 6 weeks. Mice were sacrificed 48 h after the last injection at the end of the 18th week. Aortas were isolated for ORO staining, and aortic sinus was sectioned for galectin 3 staining to detect macrophages and Masson's trichrome staining to detect necrotic core and collagen content ( n = 6-10). ( b ) Representative images and quantification of plaque area in ( c ) male and ( d ) female aortas stained by ORO. ( e ) Representative images and quantification of ( f, g ) CCs and ( h, i ) galectin 3-positive area in aortic sinus sections from male and female mice. Quantification of ( j, k ) necrotic core area and ( l, m ) collagen content by Masson's trichrome staining in aortic sinus sections from male and female mice. Data are mean +- SD. Statistical difference was determined by ordinary one-way ANOVA and followed by Sidak's multiple comparisons test or Tukey's multiple comparisons test. * p < 0.05, ** p < 0.01, *** p < 0.001. Scale bars: the left two panels of ( e ) 200 mum, the right two panels of ( e ) 100 mum. Abbreviation: PL, polarized light. Fig 3
- Submitted by
- Invitrogen Antibodies (provider)
- Main image

- Experimental details
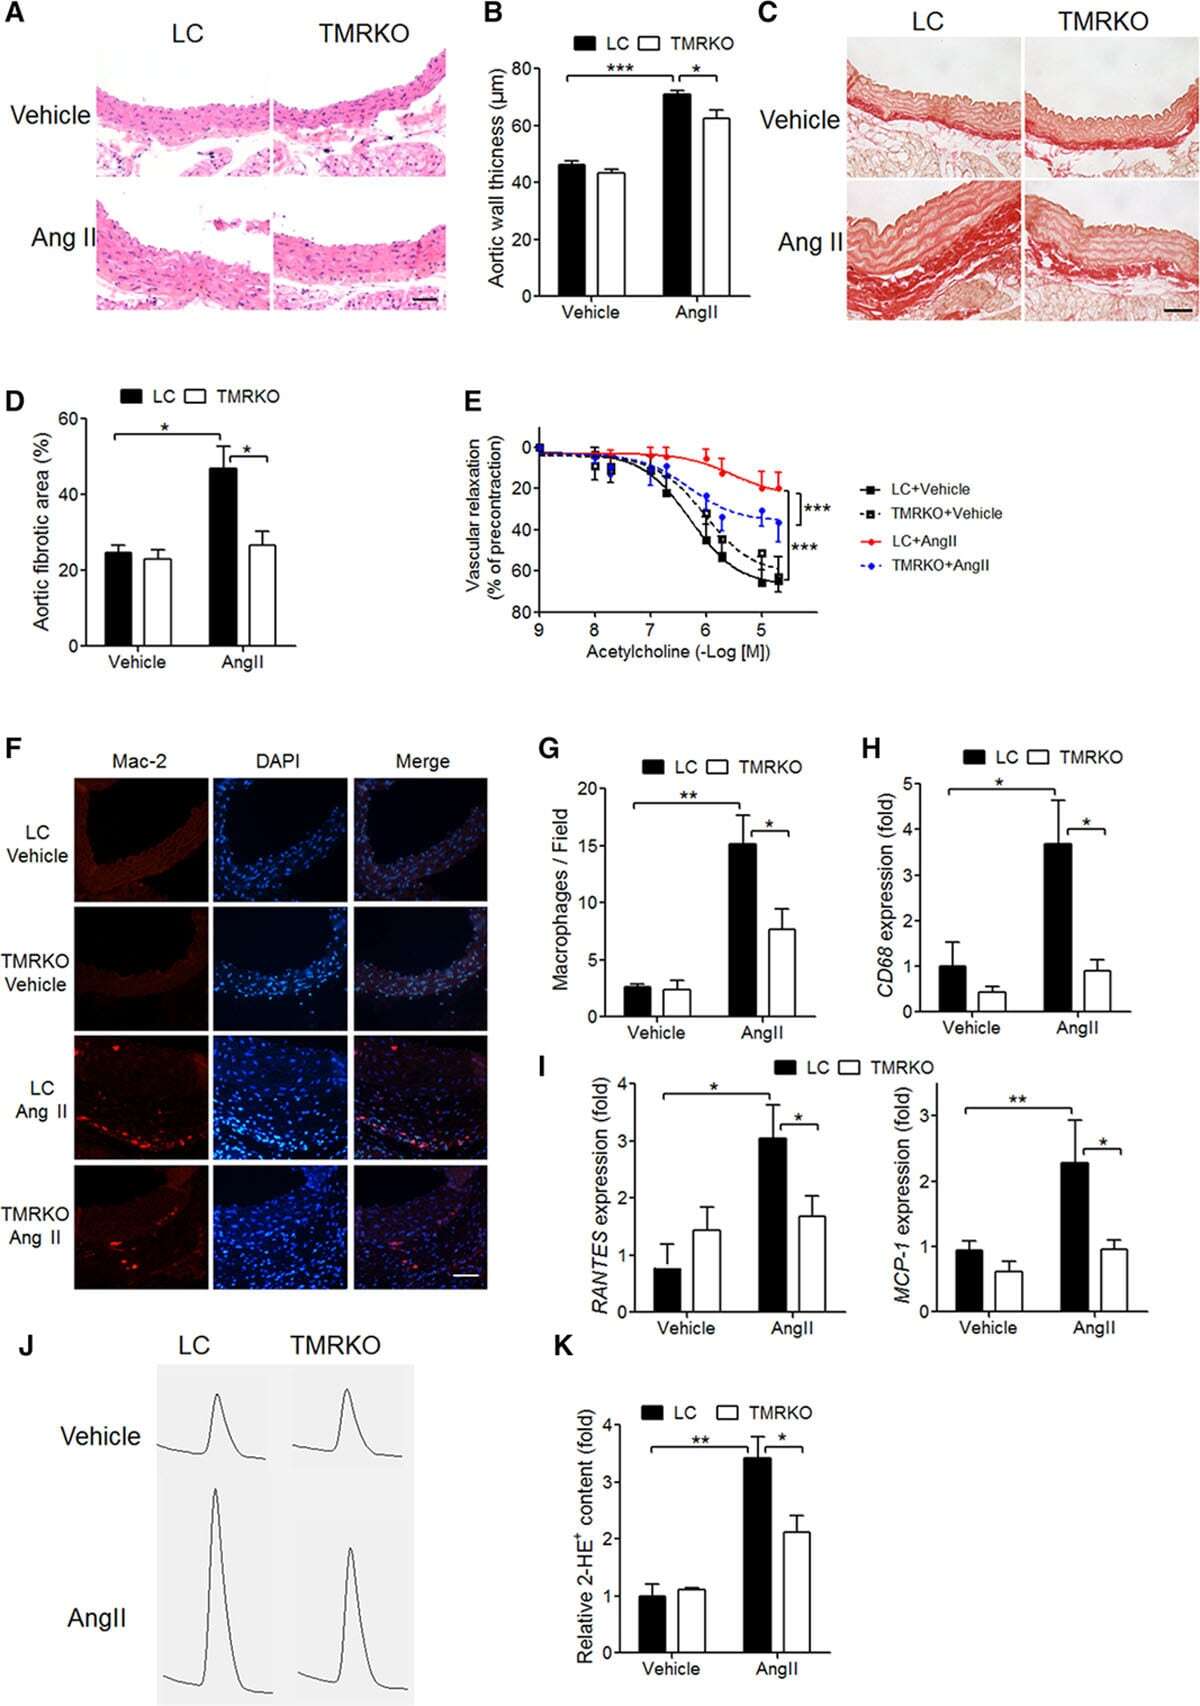
- Figure 4. T-cell mineralocorticoid receptor (MR) deficiency attenuates angiotensin II (Ang II)-induced vascular damage. A , Representative hematoxylin and eosin staining of aortic sections. B , Quantification of aortic wall thickness (n=6-8). C , Representative picrosirius red staining of aortic sections. Fibrotic tissues stained red. D , Quantification of aortic fibrotic areas (n=8). E , Acetylcholine dose-response curves of mesenteric arteries (n=6-7). F , Representative immunofluorescence staining of Mac2 in aortic sections. G , Quantification of Mac2-positive cells (n=5-6). H , QRT-polymerase chain reaction (PCR) analysis of CD68 gene expression in aortas (n=6-8). I , QRT-PCR analysis of RANTES (regulated upon activation normal T-cell expressed and secreted) and monocyte chemotactic protein (MCP)-1 gene expression in aortas (n=6-8). J , Representative high-performance liquid chromatography tracings of 2-hydroxyethidium (2-HE &plus ) in aortic samples. K , Quantification of relative 2-HE &plus content (n=4-5). Mice were infused with vehicle or AngII for 4 wk. All scale bars, 50 &mgrm. &ast P
- Submitted by
- Invitrogen Antibodies (provider)
- Main image
- Experimental details
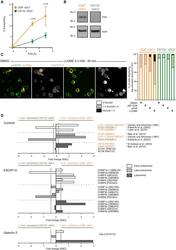
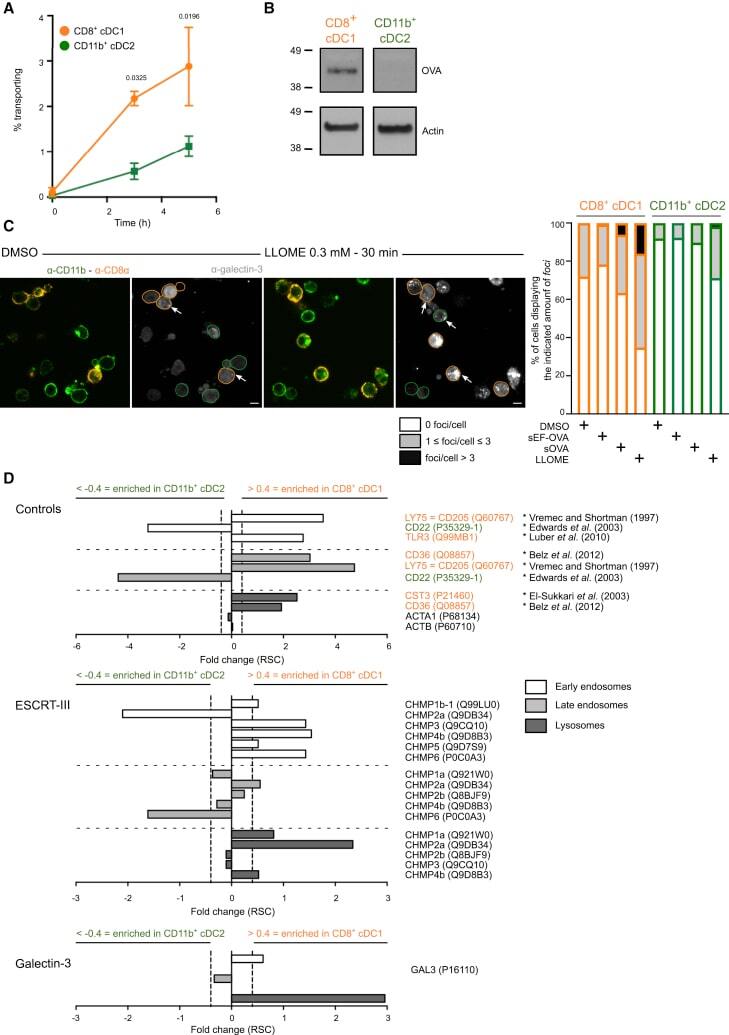
- Figure 1 ESCRT-III subunits are enriched in damage-prone cross-presenting CD8 + cDC1s (A) Purified splenic cDCs were incubated with beta-lactamase for various times before CCF4 loading, antibody staining, and analysis by flow cytometry (n = 3 experiments performed with technical duplicates or triplicates, two-way ANOVA, mean +- SEM, exact p values are indicated). The zero time point corresponds to incubation for 5 h without beta-lactamase at 37degC. (B) Splenic CD8 + cDC1s or CD11b + cDC2s were purified from FLT3L-treated mice and pulsed for 30 min with OVA-biotin. After a 2 h chase, cells were subjected to cell fractionation, and western blotting was then performed on cytosolic extracts obtained by ultracentrifugation. Blots representative of 7 experiments are shown. (C) Purified splenic cDCs were purified and treated for 30 min with 0.3 mM LLOME, endotoxin-containing (sOVA), or endotoxin-free (sEF-OVA) OVA for 4 h before fixation and galectin-3 intracellular staining. Images shown were acquired with a confocal microscope equipped with a 100x objective (scale bar, 5 mum). Frequencies (mean) in the right panel display the results of 3 (DMSO, LLOME, and sOVA) or 2 (sEF-OVA) independent experiments. Arrowheads indicate examples of galectin-3 focus location. (D) Intracellular compartments of CD8 + cDC1s or CD11b + cDC2s purified from B16-FLT3L-injected mice were isolated by subcellular fractionation and analyzed by mass spectrometry. Purity control (top panel), ESCRT-III compone
- Submitted by
- Invitrogen Antibodies (provider)
- Main image
- Experimental details
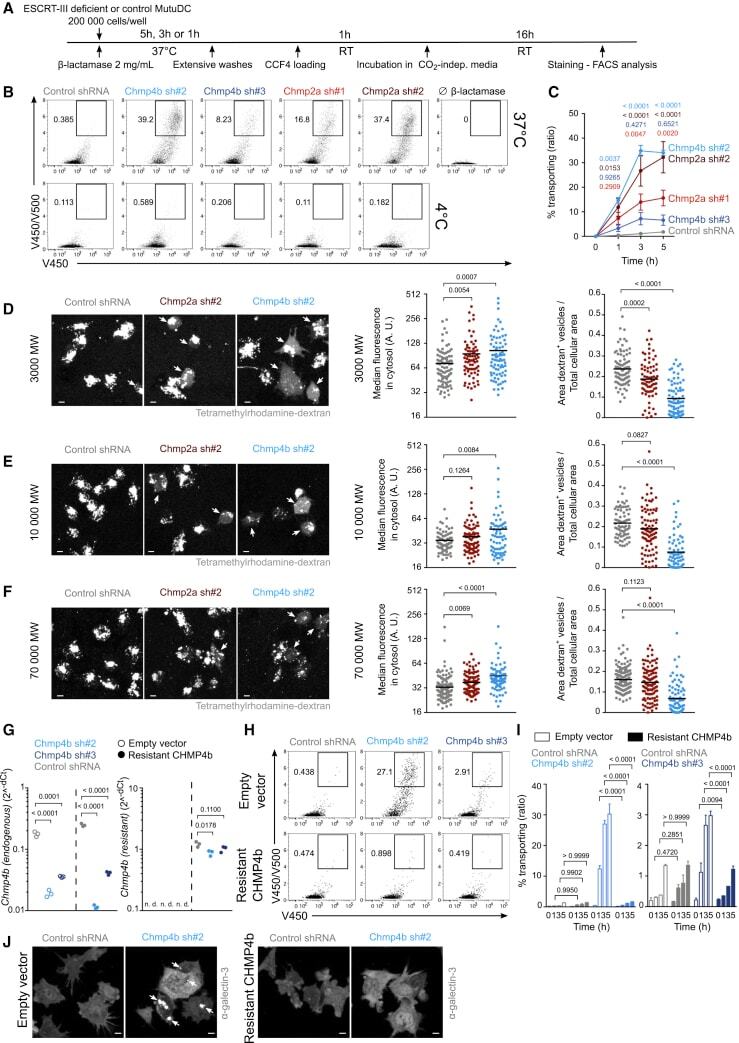
- Figure 4 ESCRT-III-silenced cDCs display increased antigen export to the cytosol (A) Timeline for the beta-lactamase assay in (B) and (C). (B) Representative plots after 3 h of incubation with or without beta-lactamase (gated on live cells). (C) Quantification of 4 independent experiments (two-way ANOVA, mean +- SEM, exact p values are indicated). The zero time point corresponds to incubation for 5 h without beta-lactamase at 37degC. (D-F) ESCRT-III-deficient or control MutuDCs were pulsed with tetramethylrhodamine-labeled dextrans (3K [D], 10K [E], or 70K [F]) before extensive washes and subsequent chase. Representative images acquired with a confocal microscope equipped with a 40x objective are shown (scale bar, 5 mum). Quantification of the median of cytosolic fluorescence and of the ratio of dextran + vesicle area on total cell area are shown (Student's t test, mean, exact p values are indicated). Each dot represents one cell. One experiment representative of 2 independent experiments is shown. Arrowheads indicate cells showing cytosolic dextran fluorescence. Because the images shown in (D) originate from the same experiment as the one presented in Figure S3 F, the control shRNA image and values are identical (and copied) in both figures. (G) qRT-PCR expression analysis of endogenous Chmp4b (left panel) and shRNA-resistant Chmp4b (right panel) in MutuDCs expressing (resistant CHMP4b) or not expressing (empty vector) shRNA-resistant CHMP4b and the different shRNA. n = 3 (u
- Submitted by
- Invitrogen Antibodies (provider)
- Main image

- Experimental details
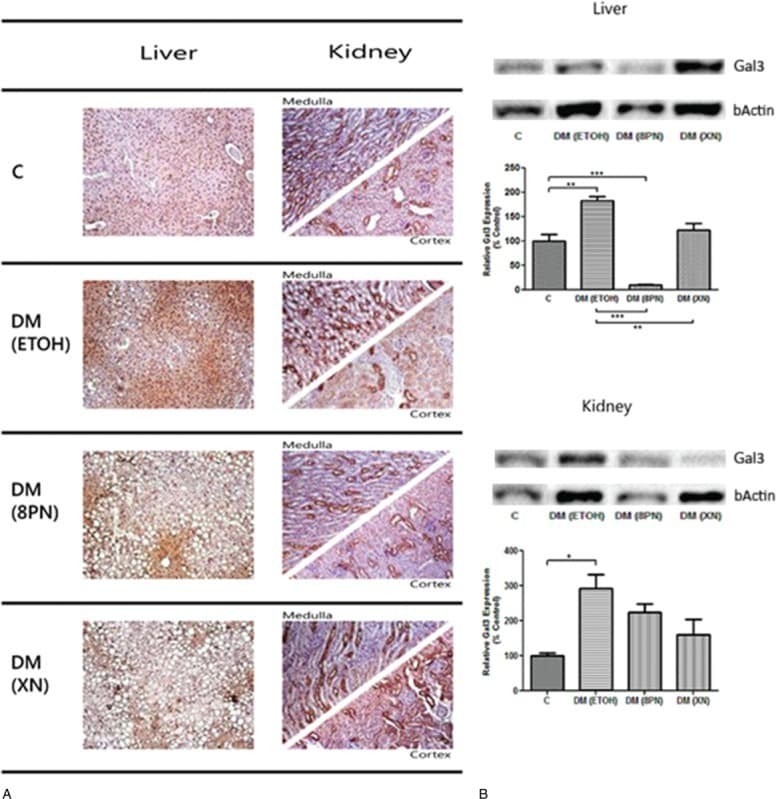
- Figure 1 A, Galectin-3 immunostaining in liver and kidney medulla and cortex. Representative images are shown. C, healthy control; DM (ETOH), type 2 diabetic animal; DM (8PN), diabetic animal supplemented with 8PN; DM (XN), diabetic animal supplemented with XN. Magnification 100x. B, Western blot for galectin-3 expression in liver and kidney. beta-Actin expression was used as loading control. A representative blot is shown. Graphs represent band intensity mean values. * rho < 0.05 versus control; ** rho < 0.001 versus control; *** rho < 0.0001 versus control. DM = diabetes mellitus; 8PN = 8-prenylnaringenin; XN = xanthohumol.
- Submitted by
- Invitrogen Antibodies (provider)
- Main image
- Experimental details
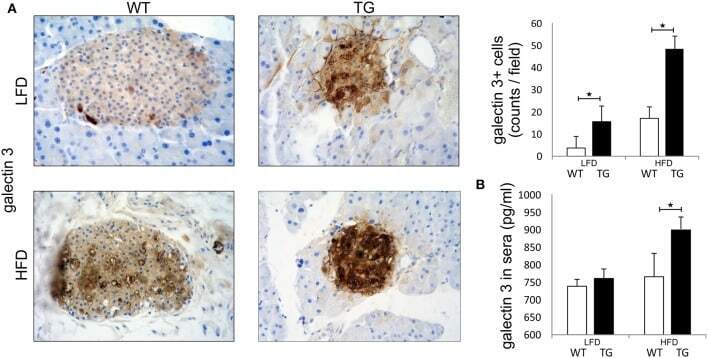
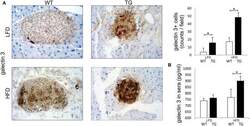
- Figure 1 Expression of galectin 3 is increased in mice on a high-fat diet. Immunohistochemical expression of galectin 3 + cells in islets. The number of galectin 3 immunopositive cells was significantly higher in TG mice compared to WT mice on standard diet. On HFD, the number of galectin 3 immunopositive cells in islets increased in both groups and was significantly higher in TG mice compared to WT (A) . Levels of galectin 3 in sera. By week 16 of HFD, levels of galectin 3 in sera were also significantly higher in TG mice compared to WT mice (B) . An analysis was performed by light microscope using a 40X magnifying lens. Results are presented as a mean count of positive cells per field on 10 non-overlapping fields/section. Data from two experiments with 10-15 mice per group are shown as mean +- SEM; by Mann-Whitney U -test and independent-sample Student's t -test; * p < 0.05.