 Explore
 Validate
 Learn
Learn Western blot
 Immunohistochemistry
 Other assay
Antibody data
- Antibody Data
- Antigen structure
- References [41]
- Comments [0]
- Validations
- Other assay [35]
Submit
Validation data
Reference
Comment
Report error
- Product number
- PA1-24894 - Provider product page

- Provider
- Invitrogen Antibodies
- Product name
- UCP1 Polyclonal Antibody
- Antibody type
- Polyclonal
- Antigen
- Synthetic peptide
- Description
- PA1-24894 detects UCP1 from human, mouse, and rat samples, and does not cross-react with UCP2 or UCP3. PA1-24894 is expected to cross react with bovine (93% conserved), canine (93% conserved), Macaque monkey (100% conserved), rabbit (93% conserved), and ovine (93% conserved) due to sequence homology. By Western Blot this antibody detects a band of approximately 32 kDa. Positive Control: Brown adipose tissue.
- Reactivity
- Human, Mouse, Rat, Feline
- Host
- Rabbit
- Isotype
- IgG
- Vial size
- 100 μL
- Concentration
- 1.3 mg/mL
- Storage
- Store at 4°C short term. For long term storage, store at -20°C, avoiding freeze/thaw cycles.
Submitted references Xenon-enhanced computed tomography assessment of brown adipose tissue distribution and perfusion in lean, obese, and diabetic primates.
The conserved Mediator subunit cyclin C (CCNC) is required for brown adipocyte development and lipid accumulation.
Adipose gene expression profiles reveal insights into the adaptation of northern Eurasian semi-domestic reindeer (Rangifer tarandus).
Integrins and extracellular matrix proteins modulate adipocyte thermogenic capacity.
Oncostatin M suppresses browning of white adipocytes via gp130-STAT3 signaling.
The Ubiquitin-Specific Peptidase USP18 Promotes Lipolysis, Fatty Acid Oxidation, and Lung Cancer Growth.
Ghrelin ameliorates tumor-induced adipose tissue atrophy and inflammation via Ghrelin receptor-dependent and -independent pathways.
Adipocyte-specific gp130 signalling mediates exercise-induced weight reduction.
Sustained mitochondrial biogenesis is essential to maintain caloric restriction-induced beige adipocytes.
Cold Exposure Distinctively Modulates Parathyroid and Thyroid Hormones in Cold-Acclimatized and Non-Acclimatized Humans.
Dietary alpha-ketoglutarate promotes beige adipogenesis and prevents obesity in middle-aged mice.
Combined extracts of Moringa oleifera, Murraya koeingii leaves, and Curcuma longa rhizome increases energy expenditure and controls obesity in high-fat diet-fed rats.
ASK1 inhibits browning of white adipose tissue in obesity.
Clonal derivation of white and brown adipocyte progenitor cell lines from human pluripotent stem cells.
PGRMC2 is an intracellular haem chaperone critical for adipocyte function.
Mice lacking angiotensin type 2 receptor exhibit a sex-specific attenuation of insulin sensitivity.
Activation of Anxiogenic Circuits Instigates Resistance to Diet-Induced Obesity via Increased Energy Expenditure.
Inhibition of Mevalonate Pathway Prevents Adipocyte Browning in Mice and Men by Affecting Protein Prenylation.
Rosiglitazone Enhances Browning Adipocytes in Association with MAPK and PI3-K Pathways During the Differentiation of Telomerase-Transformed Mesenchymal Stromal Cells into Adipocytes.
Glucagon-like peptide-1 regulates brown adipose tissue thermogenesis via the gut-brain axis in rats.
Short-term thermoneutral housing alters glucose metabolism and markers of adipose tissue browning in response to a high-fat diet in lean mice.
Low temperature decreases bone mass in mice: Implications for humans.
Loss of dorsomedial hypothalamic GLP-1 signaling reduces BAT thermogenesis and increases adiposity.
Regulator of Calcineurin 1 helps coordinate whole-body metabolism and thermogenesis.
Functional Gut Microbiota Remodeling Contributes to the Caloric Restriction-Induced Metabolic Improvements.
Chronic administration of the angiotensin type 2 receptor agonist C21 improves insulin sensitivity in C57BL/6 mice.
Cited4 is a sex-biased mediator of the antidiabetic glitazone response in adipocyte progenitors.
Uncoupling protein 1 expression in adipocytes derived from skeletal muscle fibro/adipogenic progenitors is under genetic and hormonal control.
Jak-TGFβ cross-talk links transient adipose tissue inflammation to beige adipogenesis.
Membrane Trafficking Protein CDP138 Regulates Fat Browning and Insulin Sensitivity through Controlling Catecholamine Release.
Retinoic acid induces white adipose tissue browning by increasing adipose vascularity and inducing beige adipogenesis of PDGFRα(+) adipose progenitors.
Alcohol intake aggravates adipose browning and muscle atrophy in cancer-associated cachexia.
Cyclin C regulates adipogenesis by stimulating transcriptional activity of CCAAT/enhancer-binding protein α.
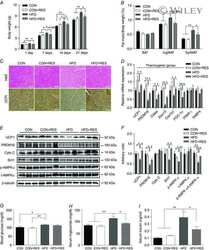
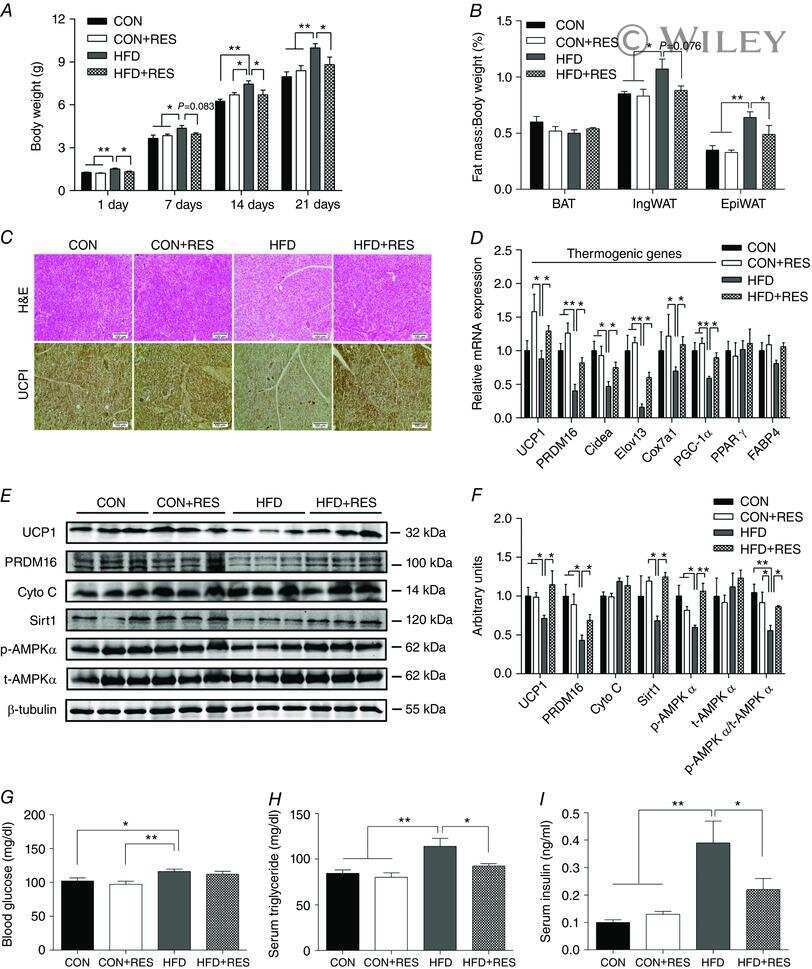
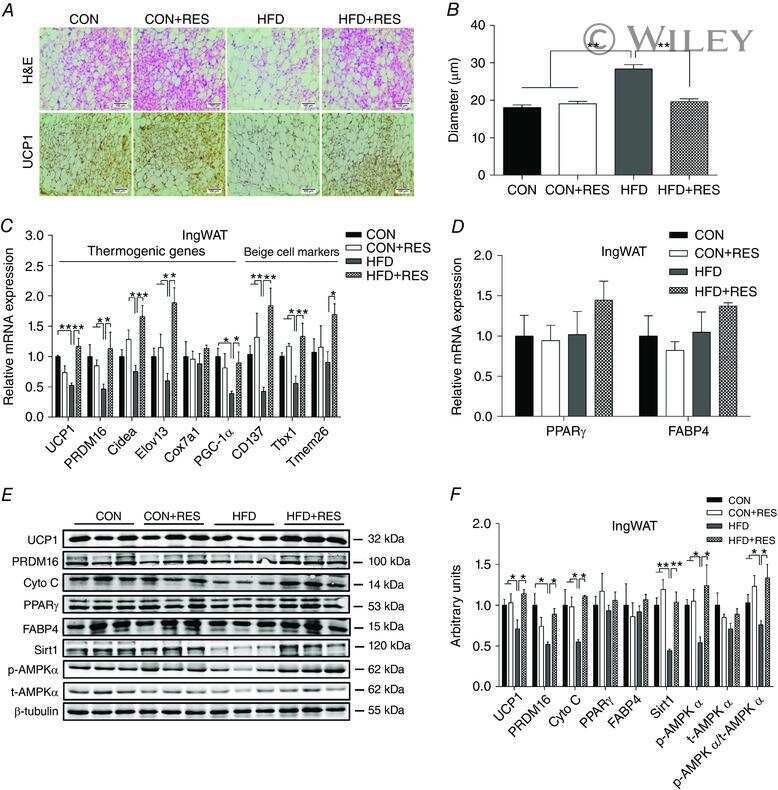
Resveratrol supplementation of high-fat diet-fed pregnant mice promotes brown and beige adipocyte development and prevents obesity in male offspring.
The Gq signalling pathway inhibits brown and beige adipose tissue.
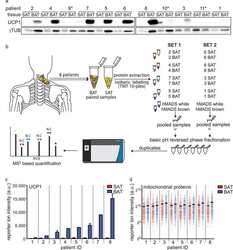
Proteomic Analysis of Human Brown Adipose Tissue Reveals Utilization of Coupled and Uncoupled Energy Expenditure Pathways.
Activation of natriuretic peptides and the sympathetic nervous system following Roux-en-Y gastric bypass is associated with gonadal adipose tissues browning.
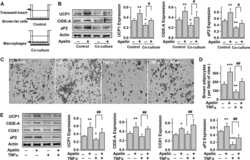
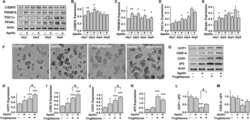
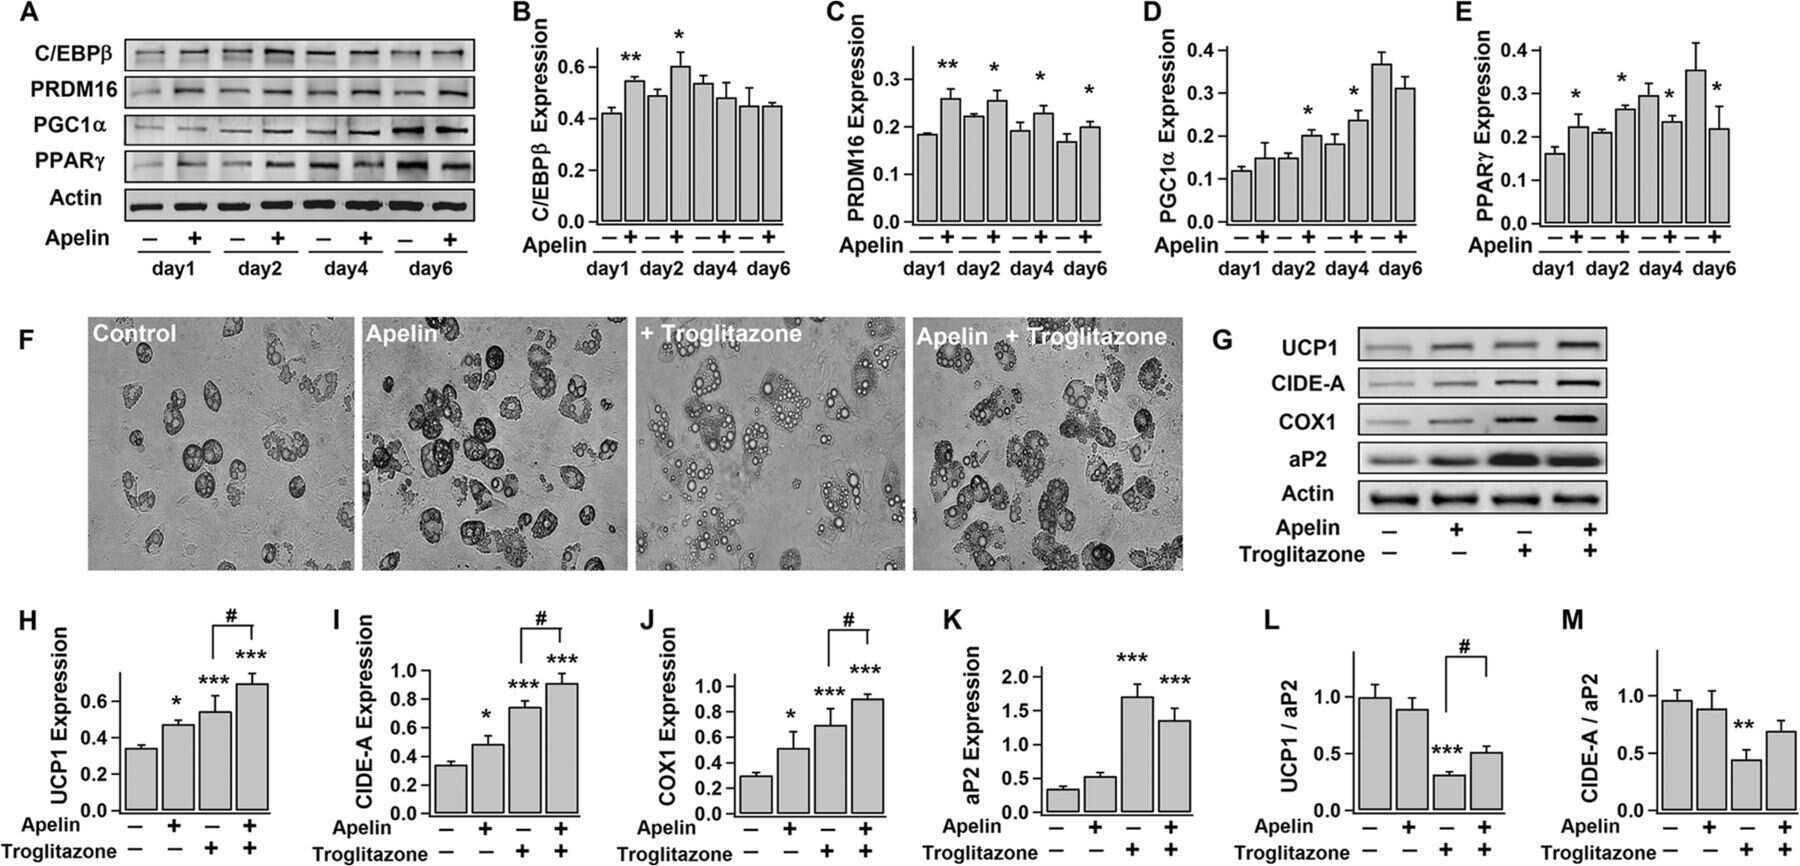
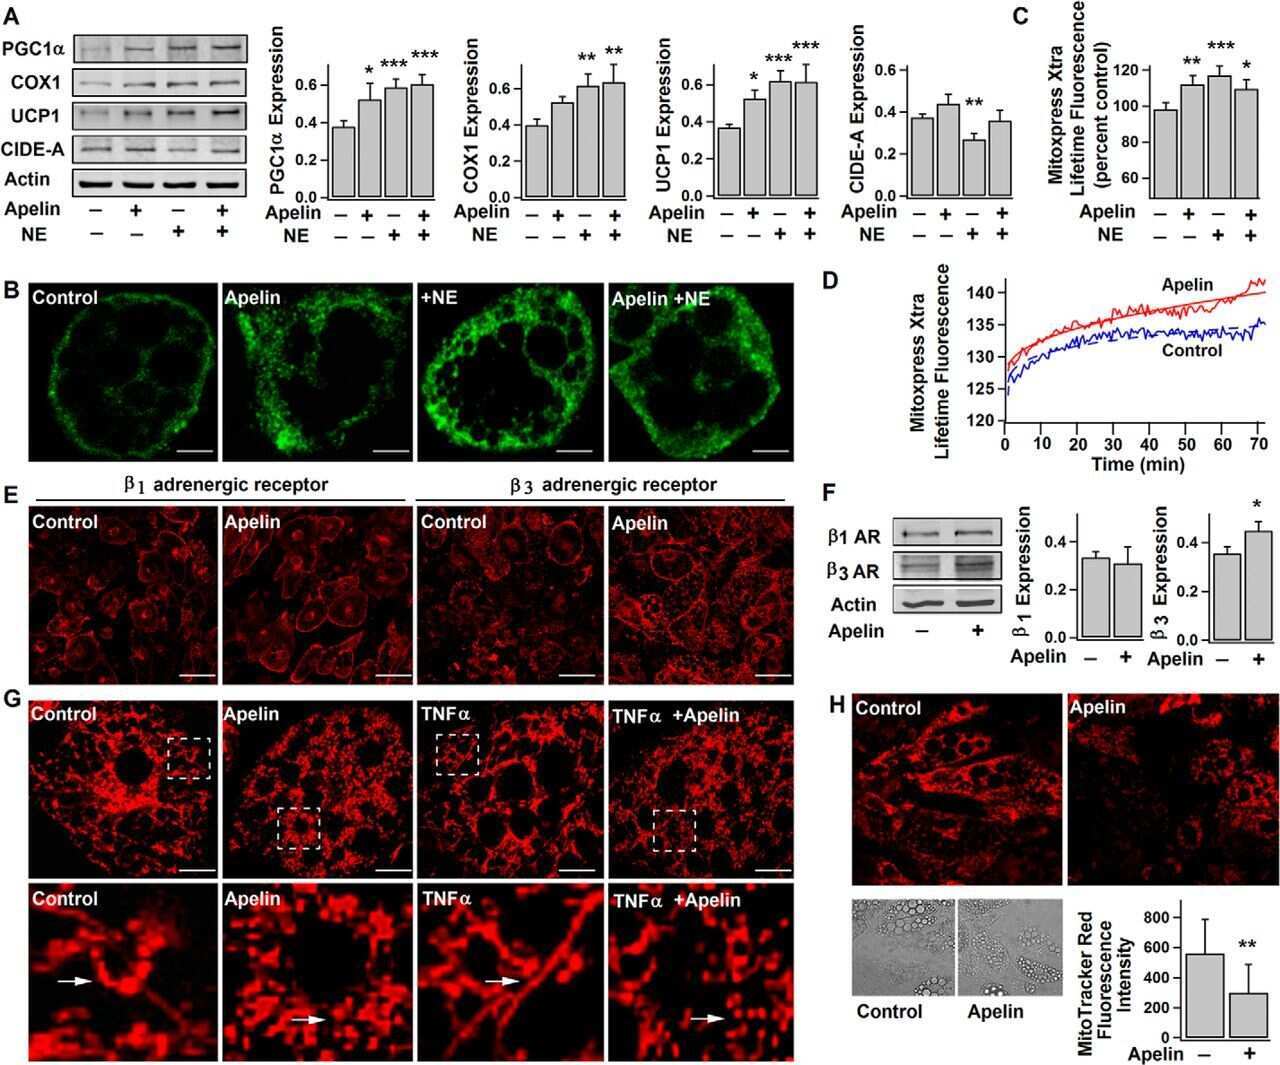
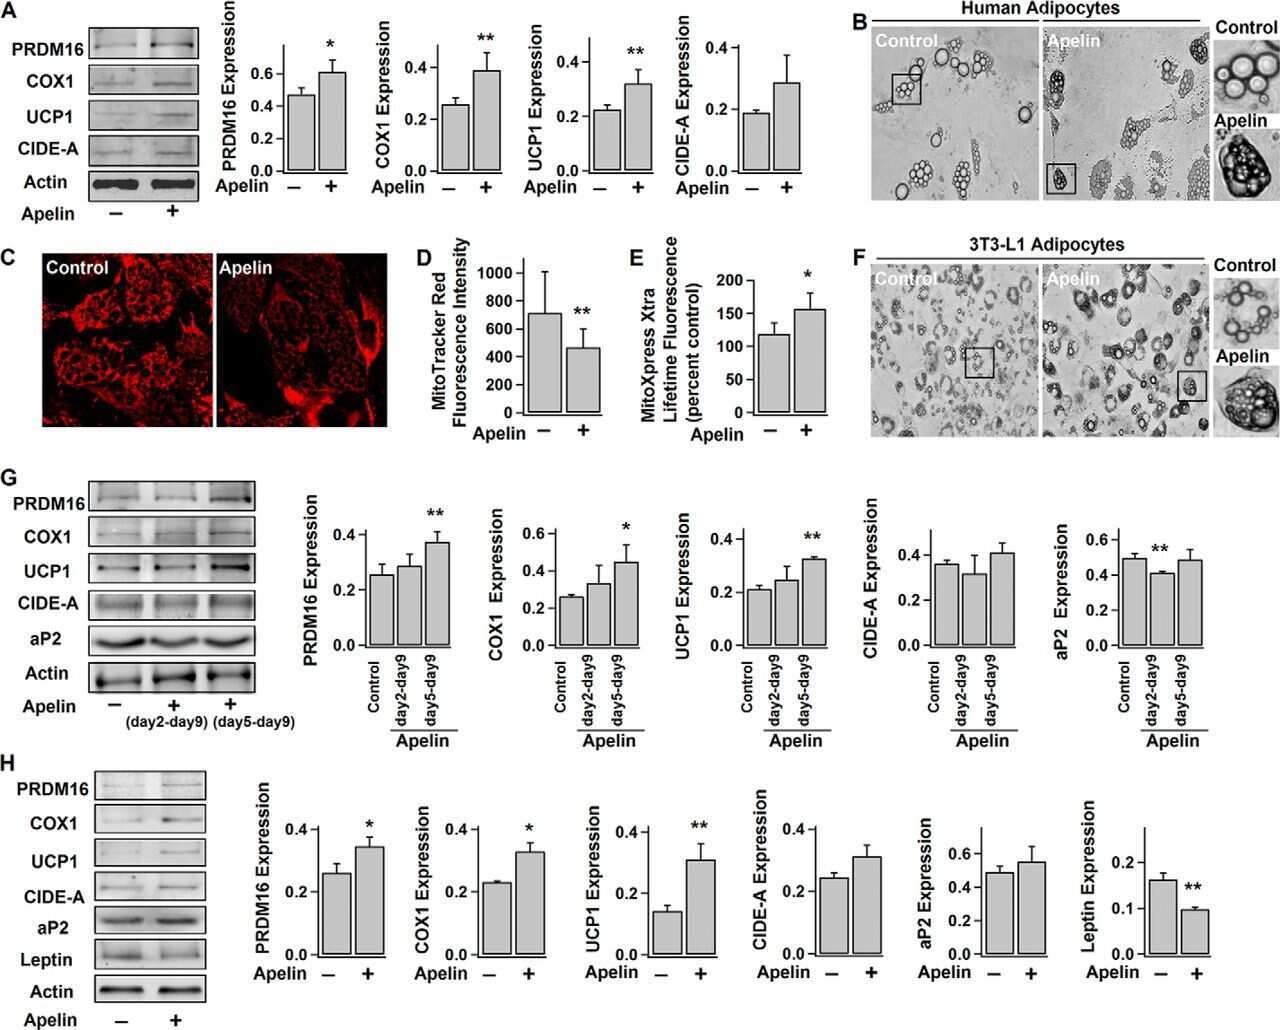
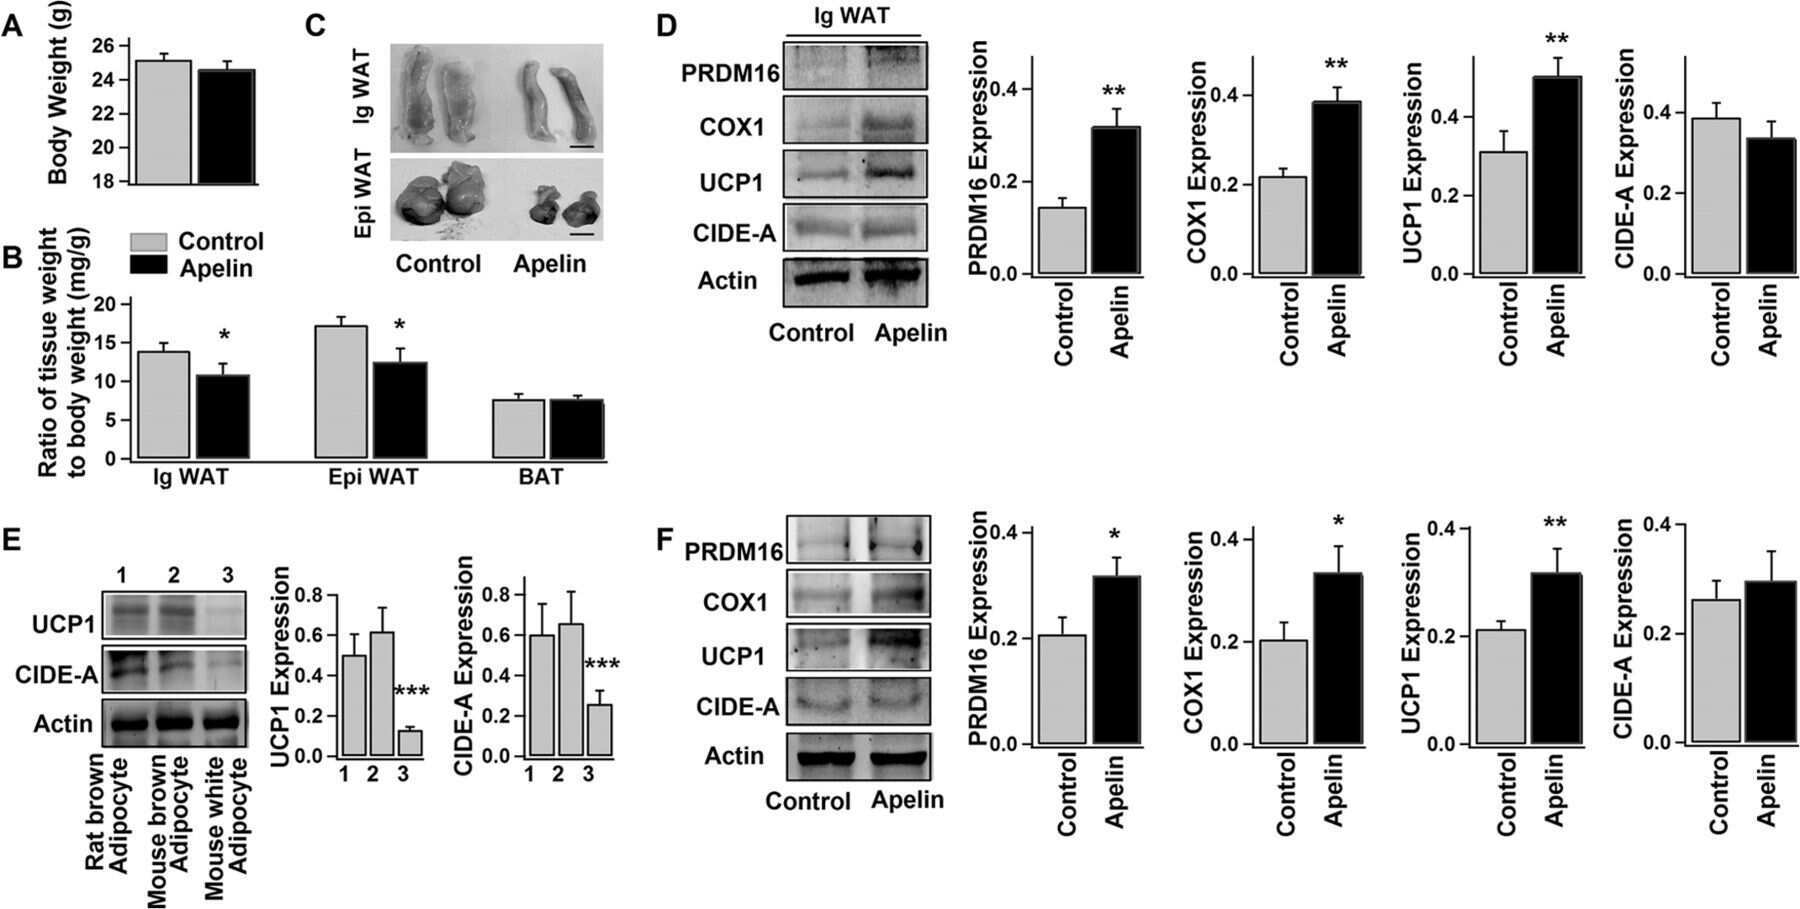
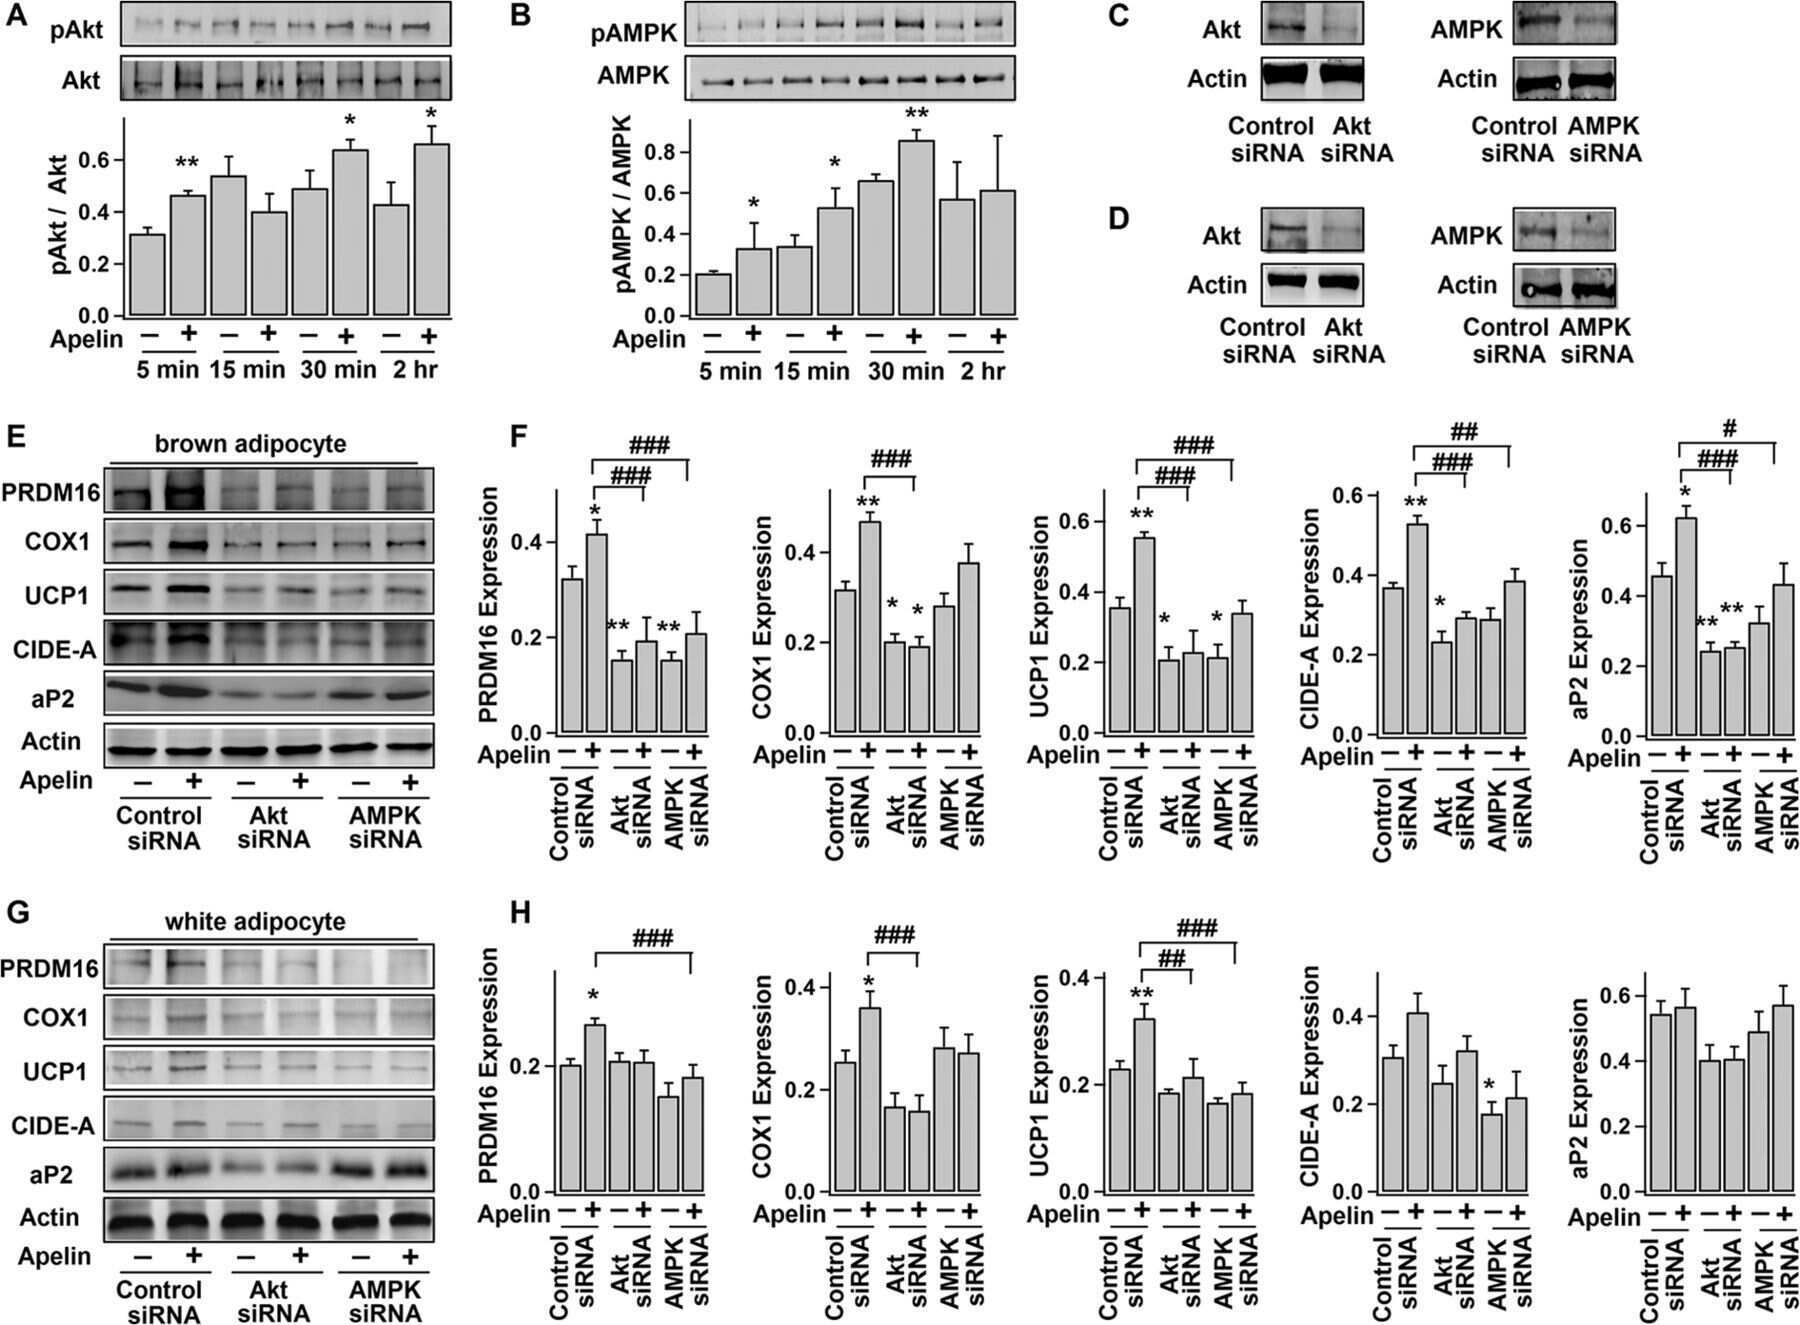
Apelin Enhances Brown Adipogenesis and Browning of White Adipocytes.
Microbiota depletion promotes browning of white adipose tissue and reduces obesity.
MiR-27 orchestrates the transcriptional regulation of brown adipogenesis.
MyomiR-133 regulates brown fat differentiation through Prdm16.
Garside JC, Kavanagh K, Block MR, Williams AG, Branca RT
Obesity (Silver Spring, Md.) 2022 Sep;30(9):1831-1841
Obesity (Silver Spring, Md.) 2022 Sep;30(9):1831-1841
The conserved Mediator subunit cyclin C (CCNC) is required for brown adipocyte development and lipid accumulation.
Song Z, Xiaoli AM, Li Y, Siqin G, Wu T, Strich R, Pessin JE, Yang F
Molecular metabolism 2022 Oct;64:101548
Molecular metabolism 2022 Oct;64:101548
Adipose gene expression profiles reveal insights into the adaptation of northern Eurasian semi-domestic reindeer (Rangifer tarandus).
Weldenegodguad M, Pokharel K, Niiranen L, Soppela P, Ammosov I, Honkatukia M, Lindeberg H, Peippo J, Reilas T, Mazzullo N, Mäkelä KA, Nyman T, Tervahauta A, Herzig KH, Stammler F, Kantanen J
Communications biology 2021 Oct 7;4(1):1170
Communications biology 2021 Oct 7;4(1):1170
Integrins and extracellular matrix proteins modulate adipocyte thermogenic capacity.
Gonzalez Porras MA, Stojkova K, Vaicik MK, Pelowe A, Goddi A, Carmona A, Long B, Qutub AA, Gonzalez A, Cohen RN, Brey EM
Scientific reports 2021 Mar 8;11(1):5442
Scientific reports 2021 Mar 8;11(1):5442
Oncostatin M suppresses browning of white adipocytes via gp130-STAT3 signaling.
van Krieken PP, Odermatt TS, Borsigova M, Blüher M, Wueest S, Konrad D
Molecular metabolism 2021 Dec;54:101341
Molecular metabolism 2021 Dec;54:101341
The Ubiquitin-Specific Peptidase USP18 Promotes Lipolysis, Fatty Acid Oxidation, and Lung Cancer Growth.
Liu X, Lu Y, Chen Z, Liu X, Hu W, Zheng L, Chen Y, Kurie JM, Shi M, Mustachio LM, Adresson T, Fox S, Roszik J, Kawakami M, Freemantle SJ, Dmitrovsky E
Molecular cancer research : MCR 2021 Apr;19(4):667-677
Molecular cancer research : MCR 2021 Apr;19(4):667-677
Ghrelin ameliorates tumor-induced adipose tissue atrophy and inflammation via Ghrelin receptor-dependent and -independent pathways.
Liu H, Luo J, Guillory B, Chen JA, Zang P, Yoeli JK, Hernandez Y, Lee II, Anderson B, Storie M, Tewnion A, Garcia JM
Oncotarget 2020 Sep 1;11(35):3286-3302
Oncotarget 2020 Sep 1;11(35):3286-3302
Adipocyte-specific gp130 signalling mediates exercise-induced weight reduction.
Odermatt TS, Dedual MA, Borsigova M, Wueest S, Konrad D
International journal of obesity (2005) 2020 Mar;44(3):707-714
International journal of obesity (2005) 2020 Mar;44(3):707-714
Sustained mitochondrial biogenesis is essential to maintain caloric restriction-induced beige adipocytes.
Mooli RGR, Mukhi D, Watt M, Edmunds L, Xie B, Capooci J, Reslink M, Eze C, Mills A, Stolz DB, Jurczak M, Ramakrishnan SK
Metabolism: clinical and experimental 2020 Jun;107:154225
Metabolism: clinical and experimental 2020 Jun;107:154225
Cold Exposure Distinctively Modulates Parathyroid and Thyroid Hormones in Cold-Acclimatized and Non-Acclimatized Humans.
Kovaničová Z, Kurdiová T, Baláž M, Štefanička P, Varga L, Kulterer OC, Betz MJ, Haug AR, Burger IA, Kiefer FW, Wolfrum C, Ukropcová B, Ukropec J
Endocrinology 2020 Jul 1;161(7)
Endocrinology 2020 Jul 1;161(7)
Dietary alpha-ketoglutarate promotes beige adipogenesis and prevents obesity in middle-aged mice.
Tian Q, Zhao J, Yang Q, Wang B, Deavila JM, Zhu MJ, Du M
Aging cell 2020 Jan;19(1):e13059
Aging cell 2020 Jan;19(1):e13059
Combined extracts of Moringa oleifera, Murraya koeingii leaves, and Curcuma longa rhizome increases energy expenditure and controls obesity in high-fat diet-fed rats.
Kundimi S, Kavungala KC, Sinha S, Tayi VNR, Kundurthi NR, Golakoti T, Davis B, Sengupta K
Lipids in health and disease 2020 Aug 28;19(1):198
Lipids in health and disease 2020 Aug 28;19(1):198
ASK1 inhibits browning of white adipose tissue in obesity.
Lucchini FC, Wueest S, Challa TD, Item F, Modica S, Borsigova M, Haim Y, Wolfrum C, Rudich A, Konrad D
Nature communications 2020 Apr 2;11(1):1642
Nature communications 2020 Apr 2;11(1):1642
Clonal derivation of white and brown adipocyte progenitor cell lines from human pluripotent stem cells.
West MD, Chang CF, Larocca D, Li J, Jiang J, Sim P, Labat I, Chapman KB, Wong KE, Nicoll J, Van Kanegan MJ, de Grey ADNJ, Nasonkin IO, Stahl A, Sternberg H
Stem cell research & therapy 2019 Jan 8;10(1):7
Stem cell research & therapy 2019 Jan 8;10(1):7
PGRMC2 is an intracellular haem chaperone critical for adipocyte function.
Galmozzi A, Kok BP, Kim AS, Montenegro-Burke JR, Lee JY, Spreafico R, Mosure S, Albert V, Cintron-Colon R, Godio C, Webb WR, Conti B, Solt LA, Kojetin D, Parker CG, Peluso JJ, Pru JK, Siuzdak G, Cravatt BF, Saez E
Nature 2019 Dec;576(7785):138-142
Nature 2019 Dec;576(7785):138-142
Mice lacking angiotensin type 2 receptor exhibit a sex-specific attenuation of insulin sensitivity.
Quiroga DT, Miquet JG, Gonzalez L, Sotelo AI, Muñoz MC, Geraldes PM, Giani JF, Dominici FP
Molecular and cellular endocrinology 2019 Dec 1;498:110587
Molecular and cellular endocrinology 2019 Dec 1;498:110587
Activation of Anxiogenic Circuits Instigates Resistance to Diet-Induced Obesity via Increased Energy Expenditure.
Xie X, Yang H, An JJ, Houtz J, Tan JW, Xu H, Liao GY, Xu ZX, Xu B
Cell metabolism 2019 Apr 2;29(4):917-931.e4
Cell metabolism 2019 Apr 2;29(4):917-931.e4
Inhibition of Mevalonate Pathway Prevents Adipocyte Browning in Mice and Men by Affecting Protein Prenylation.
Balaz M, Becker AS, Balazova L, Straub L, Müller J, Gashi G, Maushart CI, Sun W, Dong H, Moser C, Horvath C, Efthymiou V, Rachamin Y, Modica S, Zellweger C, Bacanovic S, Stefanicka P, Varga L, Ukropcova B, Profant M, Opitz L, Amri EZ, Akula MK, Bergo M, Ukropec J, Falk C, Zamboni N, Betz MJ, Burger IA, Wolfrum C
Cell metabolism 2019 Apr 2;29(4):901-916.e8
Cell metabolism 2019 Apr 2;29(4):901-916.e8
Rosiglitazone Enhances Browning Adipocytes in Association with MAPK and PI3-K Pathways During the Differentiation of Telomerase-Transformed Mesenchymal Stromal Cells into Adipocytes.
Fayyad AM, Khan AA, Abdallah SH, Alomran SS, Bajou K, Khattak MNK
International journal of molecular sciences 2019 Apr 1;20(7)
International journal of molecular sciences 2019 Apr 1;20(7)
Glucagon-like peptide-1 regulates brown adipose tissue thermogenesis via the gut-brain axis in rats.
Krieger JP, Santos da Conceição EP, Sanchez-Watts G, Arnold M, Pettersen KG, Mohammed M, Modica S, Lossel P, Morrison SF, Madden CJ, Watts AG, Langhans W, Lee SJ
American journal of physiology. Regulatory, integrative and comparative physiology 2018 Oct 1;315(4):R708-R720
American journal of physiology. Regulatory, integrative and comparative physiology 2018 Oct 1;315(4):R708-R720
Short-term thermoneutral housing alters glucose metabolism and markers of adipose tissue browning in response to a high-fat diet in lean mice.
Clayton ZS, McCurdy CE
American journal of physiology. Regulatory, integrative and comparative physiology 2018 Oct 1;315(4):R627-R637
American journal of physiology. Regulatory, integrative and comparative physiology 2018 Oct 1;315(4):R627-R637
Low temperature decreases bone mass in mice: Implications for humans.
Robbins A, Tom CATMB, Cosman MN, Moursi C, Shipp L, Spencer TM, Brash T, Devlin MJ
American journal of physical anthropology 2018 Nov;167(3):557-568
American journal of physical anthropology 2018 Nov;167(3):557-568
Loss of dorsomedial hypothalamic GLP-1 signaling reduces BAT thermogenesis and increases adiposity.
Lee SJ, Sanchez-Watts G, Krieger JP, Pignalosa A, Norell PN, Cortella A, Pettersen KG, Vrdoljak D, Hayes MR, Kanoski SE, Langhans W, Watts AG
Molecular metabolism 2018 May;11:33-46
Molecular metabolism 2018 May;11:33-46
Regulator of Calcineurin 1 helps coordinate whole-body metabolism and thermogenesis.
Rotter D, Peiris H, Grinsfelder DB, Martin AM, Burchfield J, Parra V, Hull C, Morales CR, Jessup CF, Matusica D, Parks BW, Lusis AJ, Nguyen NUN, Oh M, Iyoke I, Jakkampudi T, McMillan DR, Sadek HA, Watt MJ, Gupta RK, Pritchard MA, Keating DJ, Rothermel BA
EMBO reports 2018 Dec;19(12)
EMBO reports 2018 Dec;19(12)
Functional Gut Microbiota Remodeling Contributes to the Caloric Restriction-Induced Metabolic Improvements.
Fabbiano S, Suárez-Zamorano N, Chevalier C, Lazarević V, Kieser S, Rigo D, Leo S, Veyrat-Durebex C, Gaïa N, Maresca M, Merkler D, Gomez de Agüero M, Macpherson A, Schrenzel J, Trajkovski M
Cell metabolism 2018 Dec 4;28(6):907-921.e7
Cell metabolism 2018 Dec 4;28(6):907-921.e7
Chronic administration of the angiotensin type 2 receptor agonist C21 improves insulin sensitivity in C57BL/6 mice.
Quiroga DT, Muñoz MC, Gil C, Pffeifer M, Toblli JE, Steckelings UM, Giani JF, Dominici FP
Physiological reports 2018 Aug;6(16):e13824
Physiological reports 2018 Aug;6(16):e13824
Cited4 is a sex-biased mediator of the antidiabetic glitazone response in adipocyte progenitors.
Bayindir-Buchhalter I, Wolff G, Lerch S, Sijmonsma T, Schuster M, Gronych J, Billeter AT, Babaei R, Krunic D, Ketscher L, Spielmann N, Hrabe de Angelis M, Ruas JL, Müller-Stich BP, Heikenwalder M, Lichter P, Herzig S, Vegiopoulos A
EMBO molecular medicine 2018 Aug;10(8)
EMBO molecular medicine 2018 Aug;10(8)
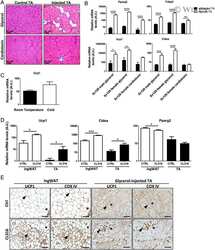
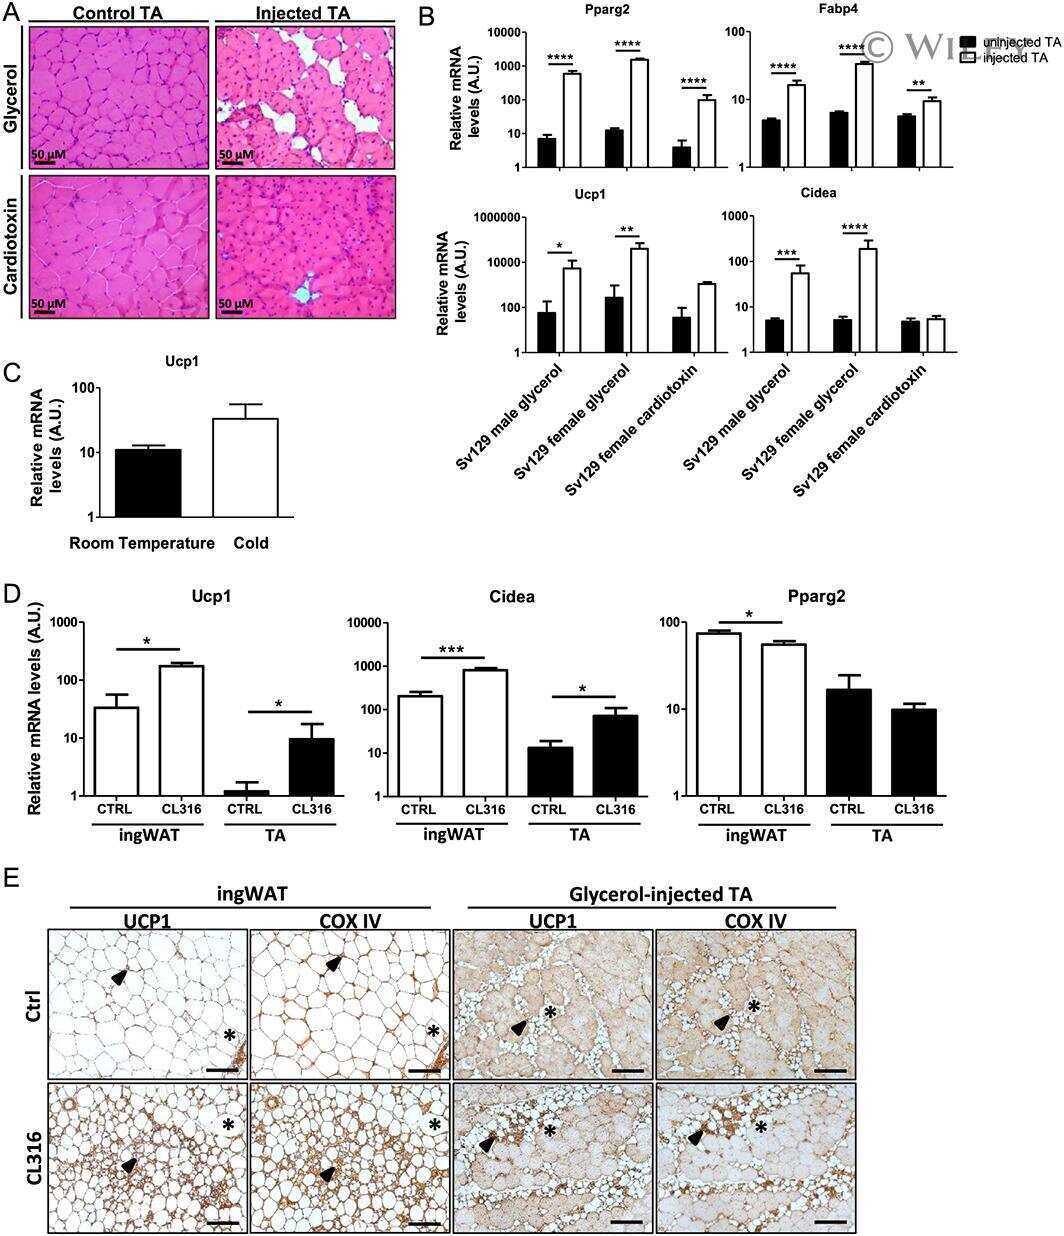
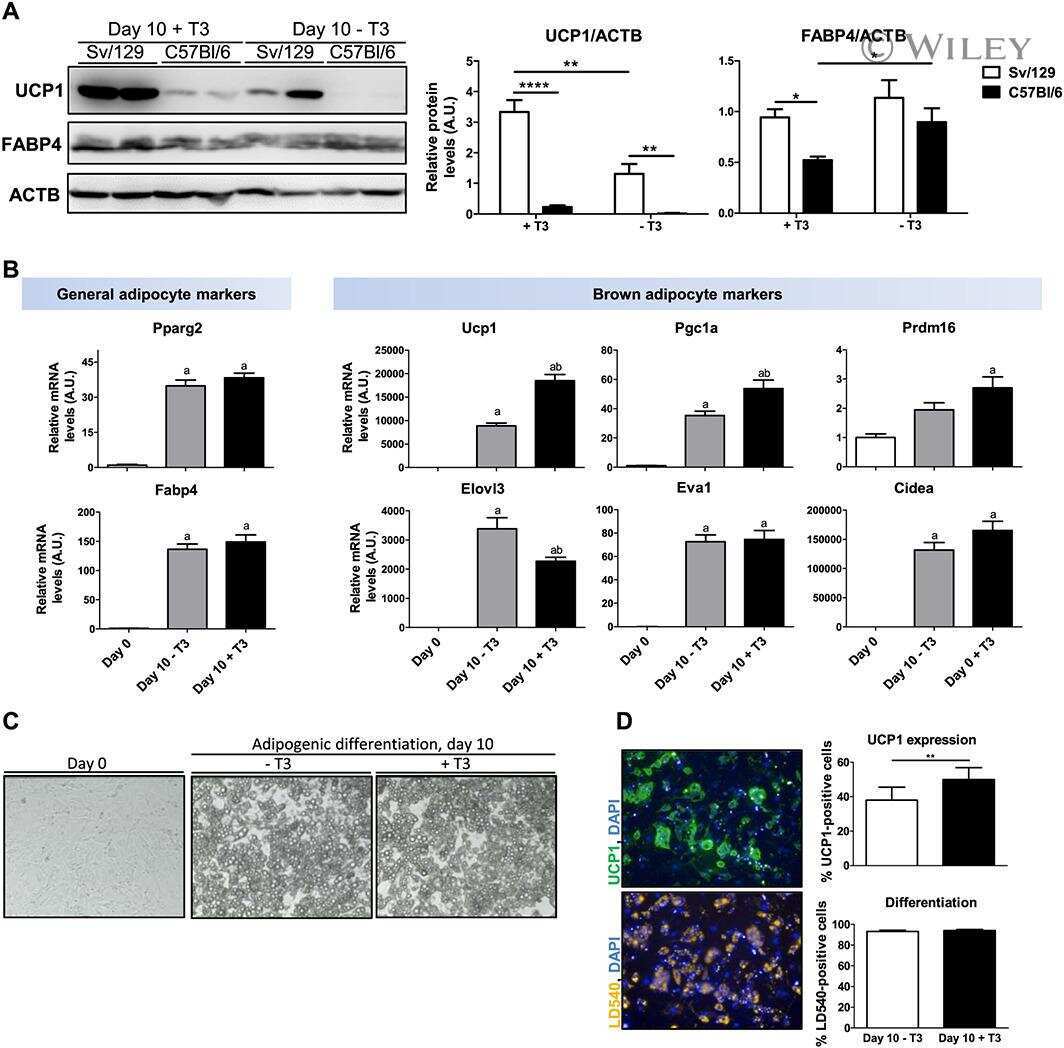
Uncoupling protein 1 expression in adipocytes derived from skeletal muscle fibro/adipogenic progenitors is under genetic and hormonal control.
Gorski T, Mathes S, Krützfeldt J
Journal of cachexia, sarcopenia and muscle 2018 Apr;9(2):384-399
Journal of cachexia, sarcopenia and muscle 2018 Apr;9(2):384-399
Jak-TGFβ cross-talk links transient adipose tissue inflammation to beige adipogenesis.
Babaei R, Schuster M, Meln I, Lerch S, Ghandour RA, Pisani DF, Bayindir-Buchhalter I, Marx J, Wu S, Schoiswohl G, Billeter AT, Krunic D, Mauer J, Lee YH, Granneman JG, Fischer L, Müller-Stich BP, Amri EZ, Kershaw EE, Heikenwälder M, Herzig S, Vegiopoulos A
Science signaling 2018 Apr 24;11(527)
Science signaling 2018 Apr 24;11(527)
Membrane Trafficking Protein CDP138 Regulates Fat Browning and Insulin Sensitivity through Controlling Catecholamine Release.
Zhou QL, Song Y, Huang CH, Huang JY, Gong Z, Liao Z, Sharma AG, Greene L, Deng JZ, Rigor MC, Xie X, Qi S, Ayala JE, Jiang ZY
Molecular and cellular biology 2018 Apr 15;38(8)
Molecular and cellular biology 2018 Apr 15;38(8)
Retinoic acid induces white adipose tissue browning by increasing adipose vascularity and inducing beige adipogenesis of PDGFRα(+) adipose progenitors.
Wang B, Fu X, Liang X, Deavila JM, Wang Z, Zhao L, Tian Q, Zhao J, Gomez NA, Trombetta SC, Zhu MJ, Du M
Cell discovery 2017;3:17036
Cell discovery 2017;3:17036
Alcohol intake aggravates adipose browning and muscle atrophy in cancer-associated cachexia.
Wang B, Zhang F, Zhang H, Wang Z, Ma YN, Zhu MJ, Du M
Oncotarget 2017 Nov 21;8(59):100411-100420
Oncotarget 2017 Nov 21;8(59):100411-100420
Cyclin C regulates adipogenesis by stimulating transcriptional activity of CCAAT/enhancer-binding protein α.
Song Z, Xiaoli AM, Zhang Q, Zhang Y, Yang EST, Wang S, Chang R, Zhang ZD, Yang G, Strich R, Pessin JE, Yang F
The Journal of biological chemistry 2017 May 26;292(21):8918-8932
The Journal of biological chemistry 2017 May 26;292(21):8918-8932
Resveratrol supplementation of high-fat diet-fed pregnant mice promotes brown and beige adipocyte development and prevents obesity in male offspring.
Zou T, Chen D, Yang Q, Wang B, Zhu MJ, Nathanielsz PW, Du M
The Journal of physiology 2017 Mar 1;595(5):1547-1562
The Journal of physiology 2017 Mar 1;595(5):1547-1562
The Gq signalling pathway inhibits brown and beige adipose tissue.
Klepac K, Kilić A, Gnad T, Brown LM, Herrmann B, Wilderman A, Balkow A, Glöde A, Simon K, Lidell ME, Betz MJ, Enerbäck S, Wess J, Freichel M, Blüher M, König G, Kostenis E, Insel PA, Pfeifer A
Nature communications 2016 Mar 9;7:10895
Nature communications 2016 Mar 9;7:10895
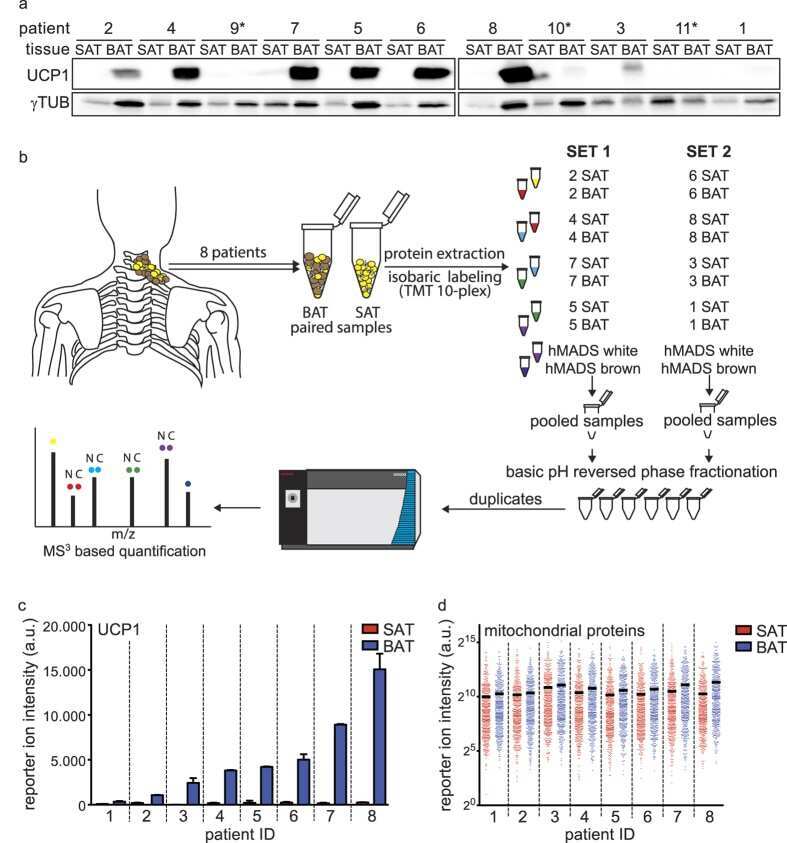
Proteomic Analysis of Human Brown Adipose Tissue Reveals Utilization of Coupled and Uncoupled Energy Expenditure Pathways.
Müller S, Balaz M, Stefanicka P, Varga L, Amri EZ, Ukropec J, Wollscheid B, Wolfrum C
Scientific reports 2016 Jul 15;6:30030
Scientific reports 2016 Jul 15;6:30030
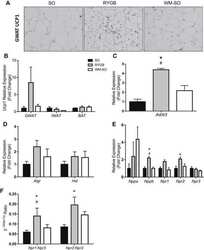
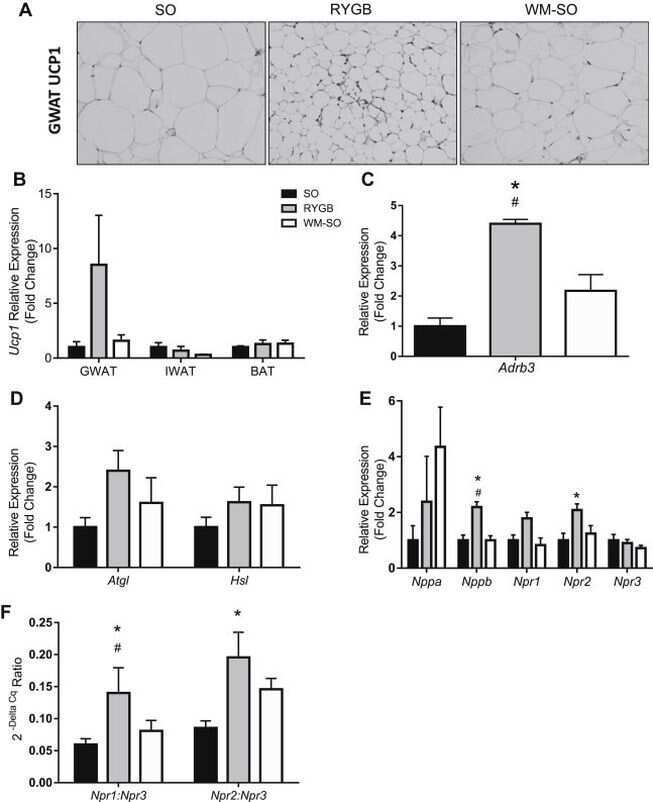
Activation of natriuretic peptides and the sympathetic nervous system following Roux-en-Y gastric bypass is associated with gonadal adipose tissues browning.
Neinast MD, Frank AP, Zechner JF, Li Q, Vishvanath L, Palmer BF, Aguirre V, Gupta RK, Clegg DJ
Molecular metabolism 2015 May;4(5):427-36
Molecular metabolism 2015 May;4(5):427-36
Apelin Enhances Brown Adipogenesis and Browning of White Adipocytes.
Than A, He HL, Chua SH, Xu D, Sun L, Leow MK, Chen P
The Journal of biological chemistry 2015 Jun 5;290(23):14679-91
The Journal of biological chemistry 2015 Jun 5;290(23):14679-91
Microbiota depletion promotes browning of white adipose tissue and reduces obesity.
Suárez-Zamorano N, Fabbiano S, Chevalier C, Stojanović O, Colin DJ, Stevanović A, Veyrat-Durebex C, Tarallo V, Rigo D, Germain S, Ilievska M, Montet X, Seimbille Y, Hapfelmeier S, Trajkovski M
Nature medicine 2015 Dec;21(12):1497-1501
Nature medicine 2015 Dec;21(12):1497-1501
MiR-27 orchestrates the transcriptional regulation of brown adipogenesis.
Sun L, Trajkovski M
Metabolism: clinical and experimental 2014 Feb;63(2):272-82
Metabolism: clinical and experimental 2014 Feb;63(2):272-82
MyomiR-133 regulates brown fat differentiation through Prdm16.
Trajkovski M, Ahmed K, Esau CC, Stoffel M
Nature cell biology 2012 Dec;14(12):1330-5
Nature cell biology 2012 Dec;14(12):1330-5
No comments: Submit comment
Supportive validation
- Submitted by
- Invitrogen Antibodies (provider)
- Main image
- Experimental details
- NULL
- Submitted by
- Invitrogen Antibodies (provider)
- Main image
- Experimental details
- NULL
- Submitted by
- Invitrogen Antibodies (provider)
- Main image
- Experimental details
- NULL
- Submitted by
- Invitrogen Antibodies (provider)
- Main image
- Experimental details
- NULL
- Submitted by
- Invitrogen Antibodies (provider)
- Main image
- Experimental details
- NULL

- Submitted by
- Invitrogen Antibodies (provider)
- Main image
- Experimental details
- NULL
- Submitted by
- Invitrogen Antibodies (provider)
- Main image
- Experimental details
- NULL

- Submitted by
- Invitrogen Antibodies (provider)
- Main image
- Experimental details
- NULL
- Submitted by
- Invitrogen Antibodies (provider)
- Main image
- Experimental details
- NULL
- Submitted by
- Invitrogen Antibodies (provider)
- Main image

- Experimental details
- NULL
- Submitted by
- Invitrogen Antibodies (provider)
- Main image

- Experimental details
- NULL
- Submitted by
- Invitrogen Antibodies (provider)
- Main image
- Experimental details
- NULL
- Submitted by
- Invitrogen Antibodies (provider)
- Main image

- Experimental details
- NULL
- Submitted by
- Invitrogen Antibodies (provider)
- Main image
- Experimental details
- NULL
- Submitted by
- Invitrogen Antibodies (provider)
- Main image

- Experimental details
- NULL
- Submitted by
- Invitrogen Antibodies (provider)
- Main image

- Experimental details
- NULL
- Submitted by
- Invitrogen Antibodies (provider)
- Main image

- Experimental details
- NULL
- Submitted by
- Invitrogen Antibodies (provider)
- Main image
- Experimental details
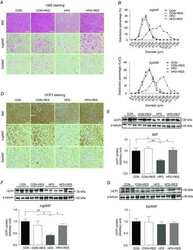
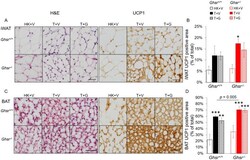
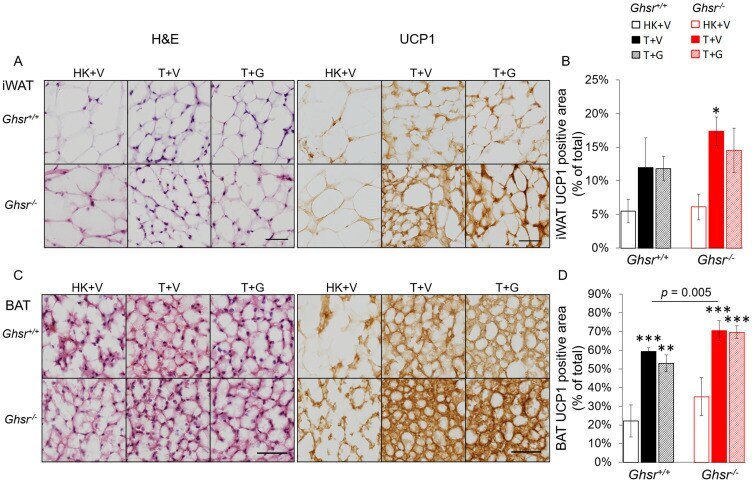
- Figure 5 Expression of UCP-1 in iWAT and BAT. HK+V: heat-killed + vehicle; T+V: tumor + vehicle; T+G: tumor + ghrelin. ( A ) Representative H&E and IHC images of UCP-1 in iWAT. ( B ) UCP-1 positive area is expressed as % of the total analyzed area in iWAT ( n = 4-6). ( C ) Representative H&E and IHC images of UCP-1 in BAT. ( D ) UCP-1 positive area is expressed as % of the total analyzed area in BAT ( n = 4-6). Two-way ANOVA was performed to detect genotype and treatment differences. * p < 0.05; ** p < 0.01; *** p < 0.001 compared to HK+V within the same genotype. Genotype effects are shown as p -values above the corresponding figures ( p < .05). Data are shown as mean +- SE. Scale bars, 50 mum.
- Submitted by
- Invitrogen Antibodies (provider)
- Main image
- Experimental details
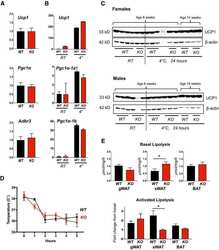
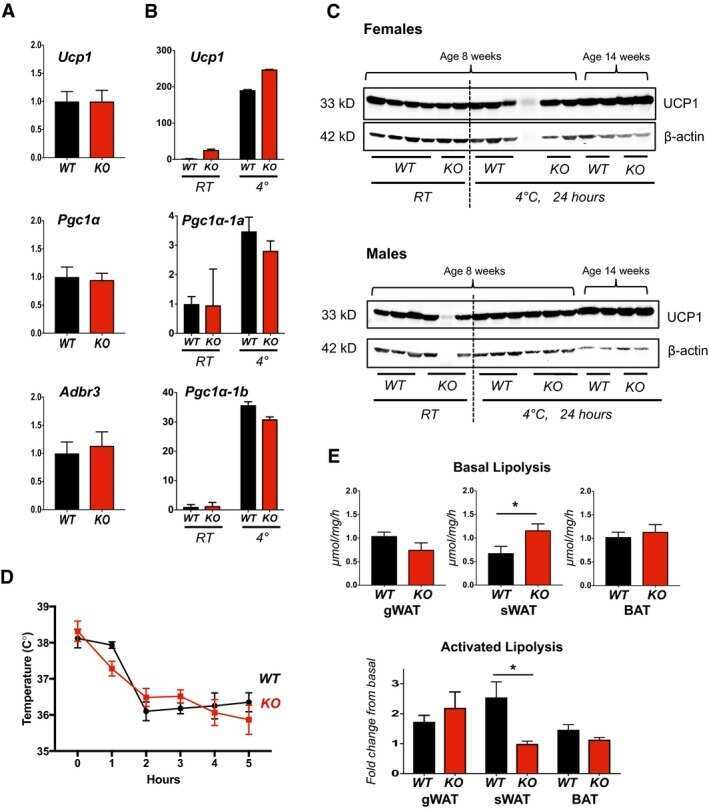
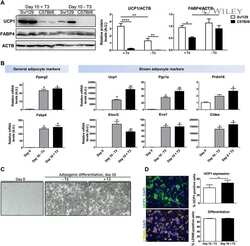
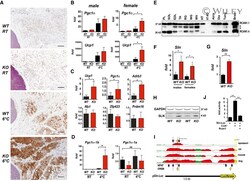
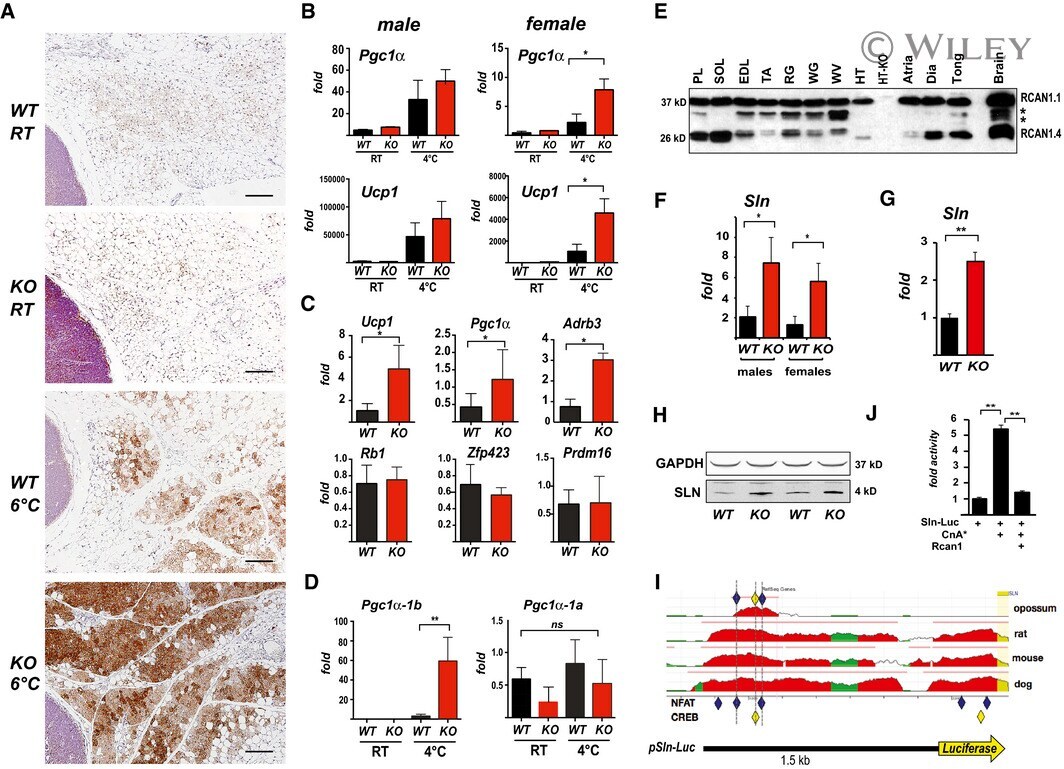
- Rcan1-KO mice show enhanced beiging of adipocytes in sWAT and elevated expression of SLN skeletal muscle Representative H&E histological sections of sWAT from WT and KO mice probed with anti-UCP1 antibodies. Mice were either maintained at 24degC (RT) or housed at 6degC for 5 days. Scale bar = 200 mum. Transcript levels of Pgc1alpha and Ucp1 in sWAT of male and female WT and KO mice after 24 h at RT or 4degC ( n = 5). Transcript levels of Ucp1 , Pgc1alpha , Adrb3 , retinoblastoma 1 ( Rb1 ), zinc finger protein 423 ( Zfp423 ), and PR domain containing 16 ( Prdm16 ) were quantified in sWAT of WT and KO mice after 25 weeks on a HFD ( n = 4-5). Transcript levels of Pgc1alpha-1b and Pgc1alpha-1a isoforms in sWAT of WT and KO 8-week-old females maintained at 24degC (RT) or housed at 4degC for 24 h ( n = 5). Western blot for RCAN1 in various skeletal muscle groups. Each lane was loaded with 20 mug of total protein from plantaris ( PL ), soleus ( SOL ), extensor digitorum longus (EDL), tibialis anterior (TA), red gastrocnemius (RG), white gastrocnemius (WG), white vastus lateralis (WV), heart ventricle (HT), atria, diaphragm (Dia), and tongue (Tong). The lane containing brain extract was loaded with 10 mug of protein. Antibody specificity was validated by running 20 mug of protein from the heart of an Rcan1-KO animal (HT-KO). The asterisks * indicate the location of putative proteolytic fragments of RCAN1.1. Transcript levels of Sln in skeletal muscle (tibialis anterior) of 8- to 10-
- Submitted by
- Invitrogen Antibodies (provider)
- Main image
- Experimental details
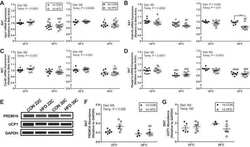
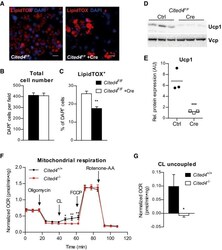
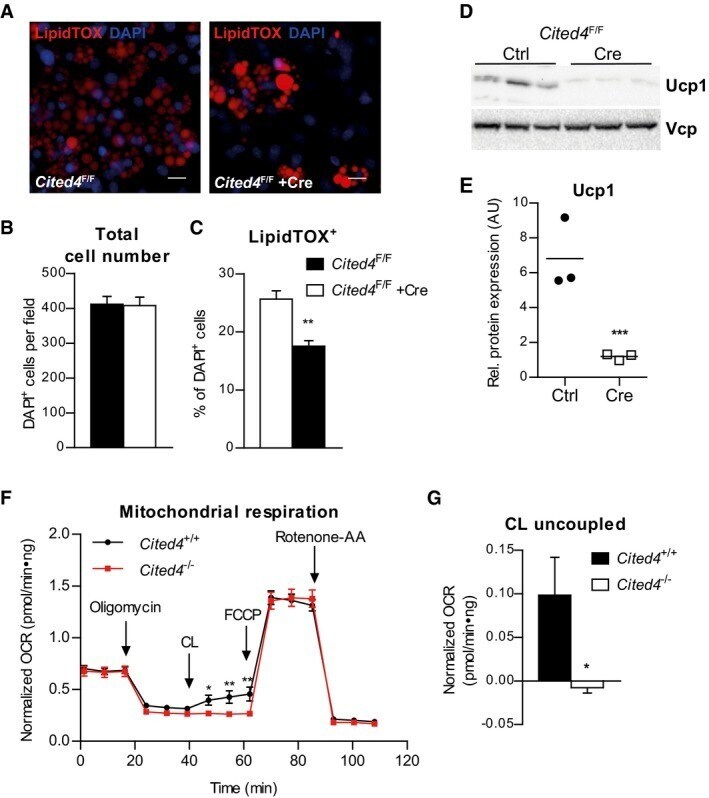
- Figure 2 Cited4 deficiency in progenitors affects Ucp1 protein expression and beta3-adrenoreceptor mediated uncoupled respiration A-C Quantitative fluorescence microscopy of LipidTOX- and DAPI-stained female Cited4 F/F Lin - Sca1 + progenitor cells transfected with Cre or control mRNA prior to differentiation in the presence of 100 nM Rosi for 8 days ( n = 5). ** P = 0.002 in t -test (Cre vs. Ctrl). Scale bar is 10 mum. D, E Ucp1 expression in female Cited4 F/F Lin - Sca1 + progenitor cells transfected with Cre or control mRNA prior to differentiation in the presence of 100 nM Rosi for 8 days, as determined by Western blot with VCP as loading control ( n = 3). *** P = 0.0008 in t -test (Cre vs. Ctrl). F Cellular respiration in female Lin - Sca1 + progenitor cells differentiated in the presence of 100 nM Rosi for 8 days. The extracellular oxygen consumption rate (OCR) was determined upon injection of the indicated substances and normalized to DNA content. CL: CL-316243. Representative experiment ( n = 9). * P = 0.041 (47 min), ** P = 0.009 (55 min), ** P = 0.003 (62 min) in 2 x 2 ANOVA with Holm-Sidak posttests ( Cited4 -/- vs. Cited4 +/+ ). G Normalized CL-stimulated uncoupled respiration of cells in (F). Values represent the means of the three time points after CL injection after subtraction of the means of the oligomycin time points ( n = 9). * P = 0.027 in t -test ( Cited4 -/- vs. Cited4 +/+ ). Data information: Data are presented as mean +- SEM. Source data are a
- Submitted by
- Invitrogen Antibodies (provider)
- Main image
- Experimental details
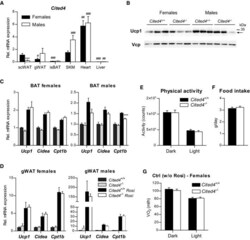
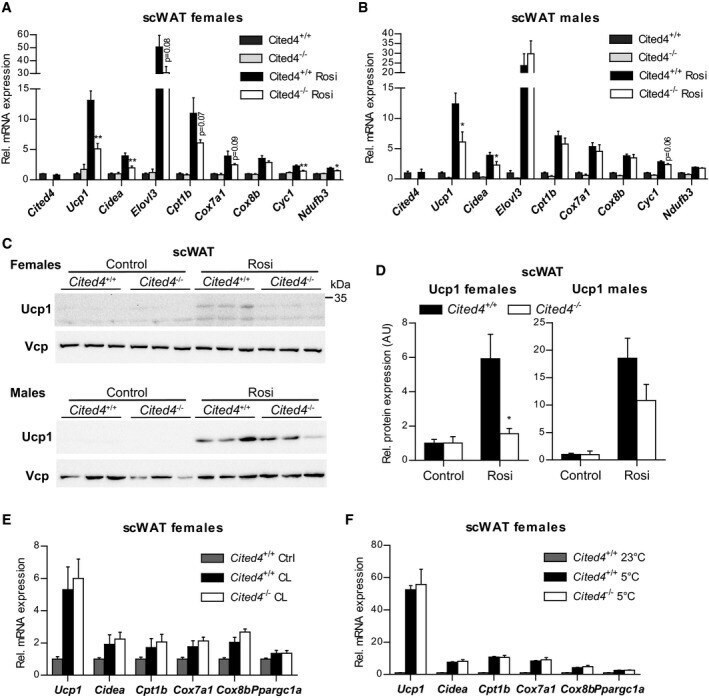
- Figure EV3 Cited4 deficiency specifically affects rosiglitazone-mediated thermogenic expression in subcutaneous fat A mRNA expression in wild-type mice without treatment, as determined by qRT-PCR ( n = 6). scWAT: subcutaneous white adipose tissue; gWAT: gonadal WAT; isBAT: interscapular brown adipose tissue; SKM: gastrocnemius skeletal muscle. 2 x 2 ANOVA with Holm-Sidak posttests, *** P = 0.0004 (female vs. male), ### P = 0.0004, ### P = 7 x 10 -6 , ### P = 6 x 10 -9 , ### P = 3 x 10 -10 , (isBAT, SKM, heart, liver, respectively, vs. scWAT within indicated sex), # P = 0.032 (females: gWAT vs. scWAT), ## P = 0.006 (females: Heart vs. scWAT), ## P = 0.006 (males: Liver vs. scWAT). B Ucp1 expression in scWAT of mice fed a diet with 0.0075% Rosi or control diet for 2.5 weeks, determined by Western blot with VCP as loading control ( n = 3, same samples as in Fig 4 C and D). C mRNA expression in BAT of mice treated as in (A), determined by qRT-PCR. t -test Cited4 -/- vs. Cited4 +/+ (Rosi), females: n = 5/5/6/6, males: n = 5/4/5/5, *** P = 0.0004. D mRNA expression in gWAT of mice treated as in (A), determined by qRT-PCR. t -test Cited4 -/- vs. Cited4 +/+ (Rosi), females: n = 5/5/6/6, males: n = 5/4/5/5. E Three-day averages of total activity counts per day and mouse of female mice fed a diet with 0.0075% Rosi for 2.5 weeks, determined by Phenomaster ( n = 9/10, t -test). F Three-day averages of food intake per day and mouse of female mice shown in (E) ( n = 9/10, t -te

- Submitted by
- Invitrogen Antibodies (provider)
- Main image

- Experimental details
- Figure 4 Cited4 deficiency specifically affects rosiglitazone-mediated thermogenic expression in subcutaneous fat A, B mRNA expression in scWAT of mice fed a diet with 0.0075% Rosi or control diet for 2.5 weeks, determined by qRT-PCR. t -test Cited4 -/- vs. Cited4 +/+ (Rosi), (A) n = 5/5/6/6, ** P = 0.003 ( Ucp1 ), ** P = 0.008 ( Cidea ), ** P = 0.007 ( Cyc1 ), * P = 0.048 ( Ndufb3 ), (B) n = 5/4/5/5, * P = 0.022 ( Ucp1 ), * P = 0.037 ( Cidea ). C, D Ucp1 expression in scWAT of mice treated as in (A), as determined by Western blot with VCP as loading control. t -test Cited4 -/- vs. Cited4 +/+ (Rosi), females: n = 5/5/6/6, * P = 0.011, males: n = 5/4/5/5. E mRNA expression in scWAT of female mice treated with CL-316,243 (CL) (1 mg/kg/day via Alzet minipumps) or vehicle for 10 days ( n = 5/7/13, t -test Cited4 -/- vs. Cited4 +/+ (CL)). F mRNA expression in scWAT of female mice exposed to 5degC or 23degC for 2 weeks ( n = 5/10/6, t -test Cited4 -/- vs. Cited4 +/+ (5degC)). Data information: Data are presented as mean +- SEM. Source data are available online for this figure.
- Submitted by
- Invitrogen Antibodies (provider)
- Main image

- Experimental details
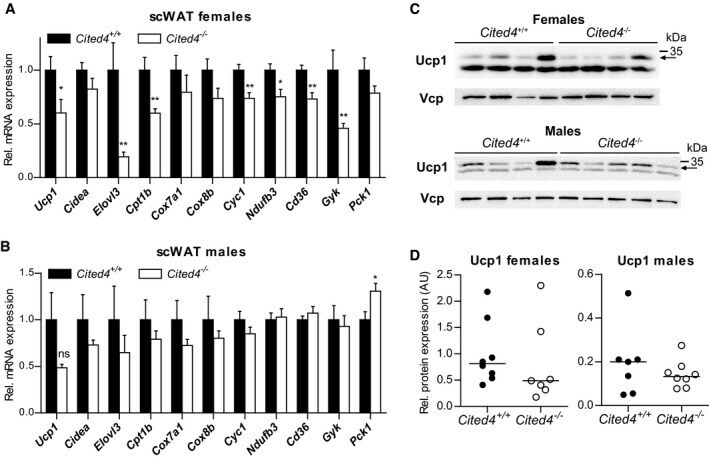
- Figure 6 Sex-specific involvement of Cited4 in thermogenic expression upon therapeutic rosiglitazone treatment A, B mRNA expression in scWAT of mice fed a high-fat diet (HFD) for 11 weeks followed by 5 weeks of HFD with 0.0075% Rosi (qRT-PCR). t -test Cited4 -/- vs. Cited4 +/+ , (A) n = 8/7, * P = 0.029 ( Ucp1 ), ** P = 0.009 ( Elovl3 ), ** P = 0.006 ( Cpt1b ), ** P = 0.004 ( Cyc1 ), * P = 0.016 ( Ndufb3 ), ** P = 0.003 ( Cd36 ), ** P = 0.009 ( Gyk ), (B) n = 7/8, * P = 0.026 ( Pck1 ). C, D Ucp1 protein expression in scWAT of mice treated as in (A), determined by Western blot with VCP as loading control ( n = 8/7 for females and n = 7/8 for males). Arrow indicates the band specific to Ucp1 (see Appendix Fig S5F ). Data information: Data presented as mean +- SEM (A and B), individual mice (D, males), or means of replicate blots with independent lysates from the same mice (D, females). Source data are available online for this figure.
- Submitted by
- Invitrogen Antibodies (provider)
- Main image
- Experimental details
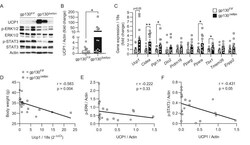
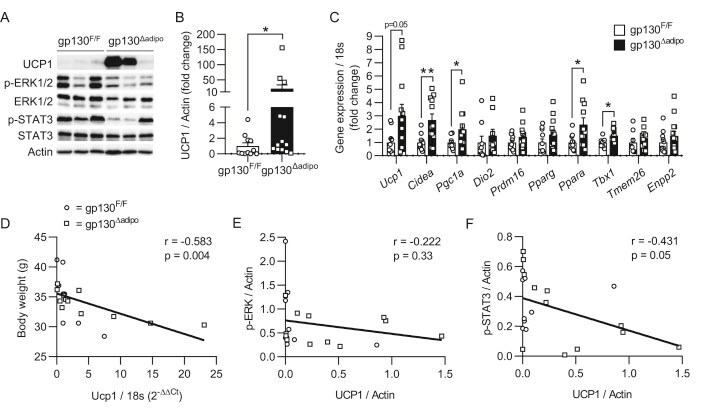
- Figure 1 Increased browning in ingWAT of HFD-fed gp130 Deltaadipo mice. ( A ) Representative Western blot of respective targets in ingWAT from HFD-fed gp130 F/F and gp130 Deltaadipo mice. ( B ) Quantification of UCP1 protein levels in ingWAT of HFD-fed gp130 F/F (n = 11) and gp130 Deltaadipo (n = 13) mice. ( C ) Gene expression levels of respective targets in ingWAT from HFD-fed gp130 F/F (n = 8-11) and gp130 Deltaadipo mice (n = 9-14). ( D ) Body weight of HFD-fed gp130 F/F and gp130 Deltaadipo mice at time of sacrifice and corresponding Ucp1 gene expression level in ingWAT (n = 22). ( E-F ) UCP1 and corresponding p-ERK1/2 or p-STAT3 protein levels in ingWAT from HFD-fed gp130 F/F and gp130 Deltaadipo mice (n = 21). Open circles/squares represent individual gp130 F/F and gp130 Deltaadipo ingWAT samples, respectively. *, p < 0.05; **, p < 0.01. Panel B, Mann-Whitney test; panel C, Student's t-test; panels D, E, and F, Linear Regression analysis. Error bars represent S.E. Figure 1
- Submitted by
- Invitrogen Antibodies (provider)
- Main image
- Experimental details
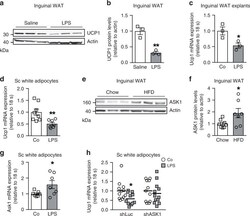
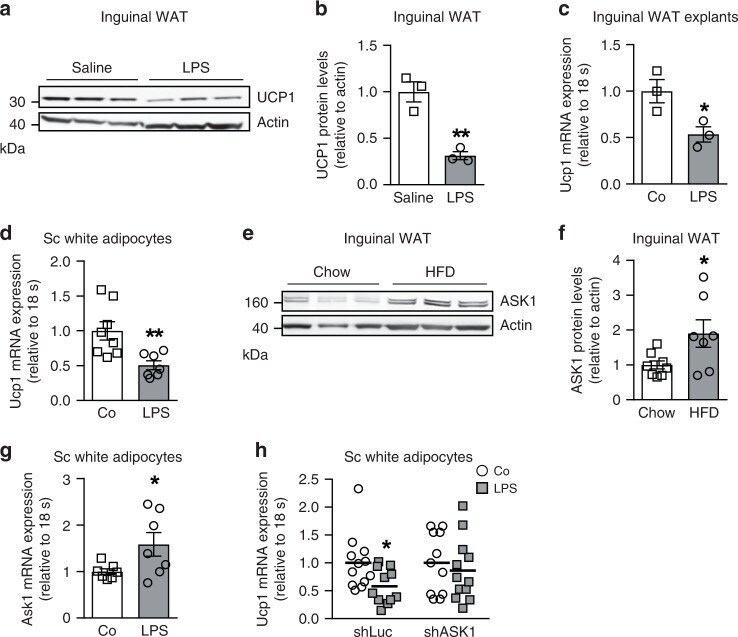
- Fig. 1 LPS treatment blunts UCP1 expression in subcutaneous adipocytes ASK1-dependently. a , b Western blot and quantified protein levels of UCP1 in total lysates of inguinal white adipose tissue harvested from cold-exposed C57BL/6J mice chronically treated with or without LPS. n = 3 mice per group. ** p = 0.004. c Ucp1 mRNA expression in inguinal fat explants harvested from C57BL/6J mice were treated with or without 100 ng/ml LPS and subsequently with 10 uM isoproterenol for 8 h. n = 3 biological replicates. * p = 0.036. d Ucp1 mRNA expression in subcutaneous adipocytes pre-treated with or without 100 ng/ml LPS for 24 h followed by stimulation with 0.1 uM isoproterenol for 6 h. n = 7 (LPS) or n = 8 (control) biological replicates. ** p = 0.007. e , f Western blot and quantified protein levels of ASK1 in total lysates of inguinal white adipose tissue harvested from C57BL/6J mice fed a chow or HFD for 20 weeks. n = 8 (chow) and n = 7 (HFD) mice per group. * p = 0.037. g Ask1 mRNA expression in subcutaneous adipocytes treated with or without 100 ng/ml LPS treatment for 24 h. n = 7 biological replicates. * p = 0.046. h Ucp1 mRNA expression in subcutaneous adipocytes transfected with control shRNA lentivirus (shLuc) or shRNA lentivirus targeting ASK1 (shASK1) pre-treated with 100 ng/ml LPS for 24 h followed by stimulation with 0.1 uM isoproterenol for 6 h. n = 11 (shASK1 control and shLuc LPS) or n = 12 (shASK1 LPS and shLuc control) biological replicates. * p = 0.027. Values are
- Submitted by
- Invitrogen Antibodies (provider)
- Main image

- Experimental details
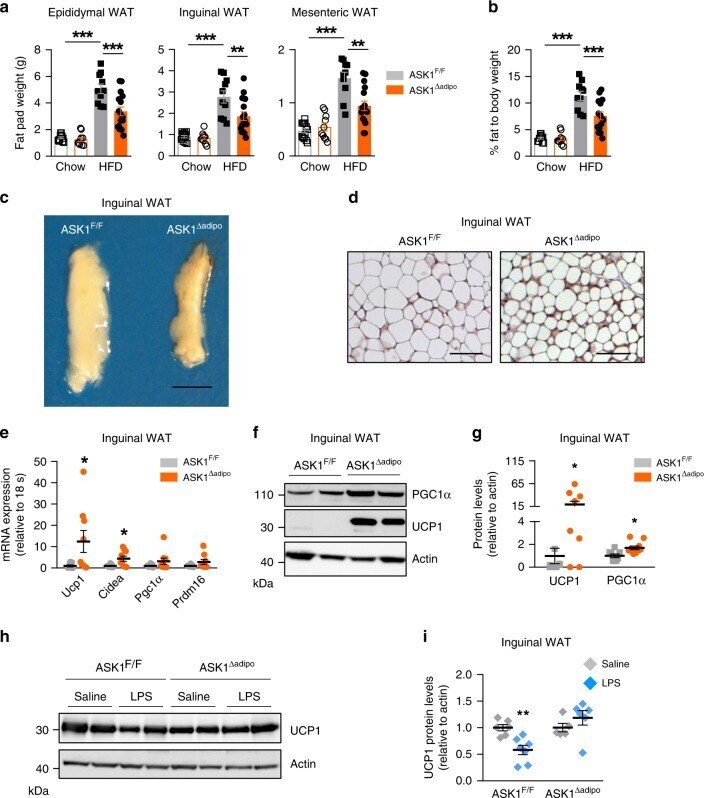
- Fig. 4 Increased adipose tissue browning in HFD-fed ASK1 Deltaadipo mice. a , b Fat pad mass as well as total body fat mass (chow-fed: ASK1 F/F , n = 13; ASK1 adipo , n = 10; HFD-fed: ASK1 F/F , n = 10; ASK1 adipo , n = 16) in mice at 18 weeks of age. ** p = 0.005; *** p < 0.001. c Representative image of inguinal adipose tissue of a HFD-fed ASK1 F/F and ASK1 adipo mouse (scale bar: 10 mm). d Representative immunohistochemistry for UCP1 in inguinal adipose tissue of a HFD-fed ASK1 F/F ( n = 3 mice) and ASK1 adipo mouse ( n = 3 mice) (scale bar: 50 um). e mRNA expression of respective genes in inguinal adipose tissue of HFD-fed ASK1 F/F ( n = 8) and ASK1 Deltaadipo ( n = 9) mice. * p = 0.027 (Ucp1), * p = 0.028 (Cidea). f , g Representative western blot and quantification of UCP1 and PGC1alpha protein levels in inguinal adipose tissue harvested from HFD-fed ASK1 F/F ( n = 8) and ASK1 Deltaadipo ( n = 10) mice. * p = 0.031 (Ucp1), * p = 0.015 (Cidea). h , i Representative western blot and quantified protein levels of UCP1 in total lysates of inguinal white adipose tissue harvested from cold-exposed mice chronically treated with or without LPS (saline ASK1 F/F , n = 6 mice; saline ASK1 adipo , n = 5 mice; LPS ASK1 F/F , n = 7 mice; LPS ASK1 adipo , n = 6 mice). ** p = 0.003. Values are expressed as mean +- SEM. Statistical tests used: two-sided t -tests for, e (Cidea), i two-sided Mann-Whitney for e (UCP1), g ANOVA for ( a and b ). Source data are provided as a Source Data file.
- Submitted by
- Invitrogen Antibodies (provider)
- Main image
- Experimental details
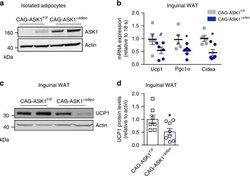
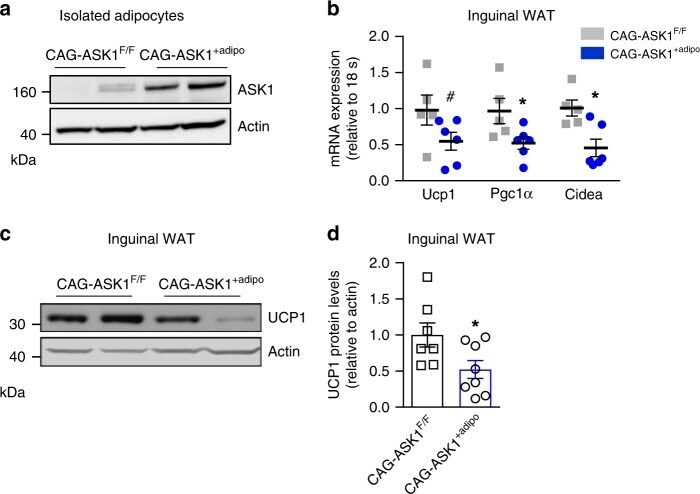
- Fig. 5 Adipocyte-specific ASK1 overexpression decreases adipose tissue browning. a Protein levels of ASK1 in lysate of isolated adipocytes harvested from CAG-ASK1 F/F and CAG-ASK1 +adipo mice ( n = 2 mice per group). b mRNA expression of respective genes in inguinal adipose tissue of cold-exposed CAG-ASK1 F/F ( n = 5) and CAG-ASK1 +adipo ( n = 6) mice. # p = 0.094, * p = 0.042, * p = 0.017. c , d Representative western blot and quantification of UCP1 protein levels in inguinal adipose tissue harvested from cold-exposed CAG-ASK1 F/F ( n = 7) and CAG-ASK1 +adipo ( n = 8) mice. * p = 0.037. Values are expressed as mean +- SEM. Statistical tests used: two-sided t -tests for ( b ) (Ucp1 and Pgc1alpha), d two-sided Mann-Whitney for ( b ) (Cidea). Source data are provided as a Source Data file.
- Submitted by
- Invitrogen Antibodies (provider)
- Main image
- Experimental details
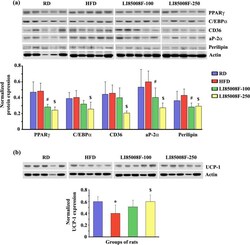
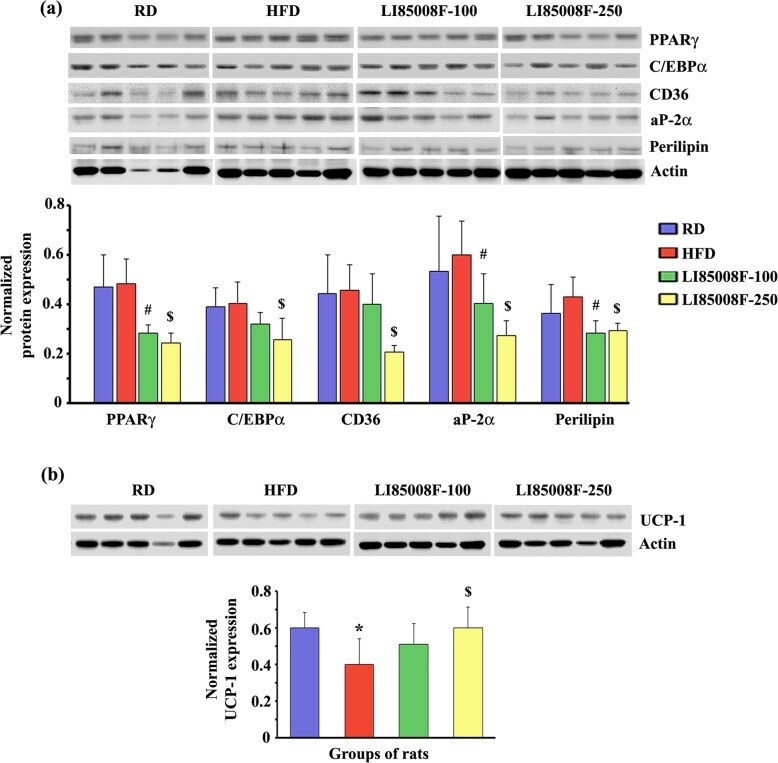
- Fig. 3 LI85008F modulates the expression of key adipogenic and thermoregulatory proteins in white fat tissue of high-fat diet-fed obese rats. Immunoblot images present the protein expression of key modulators of lipogenesis ( a ) and UCP-1 ( b ) in the inguinal fat tissue of individual animals in different groups, as indicated. In the bar diagrams, each bar presents the mean +- SD of the protein expressions ( n = 5) normalized with the respective actin expression. The groups of animals are regular diet (RD), high-fat diet (HFD), LI85008F-100 and LI85008F-250, respectively, as described in the Materials and Methods. *, # and $ indicate significance ( P < 0.05) in RD vs. HFD, HFD vs. LI85008F-100, and HFD vs. LI85008F-250 comparison analysis, respectively, using one-way ANOVA
- Submitted by
- Invitrogen Antibodies (provider)
- Main image

- Experimental details
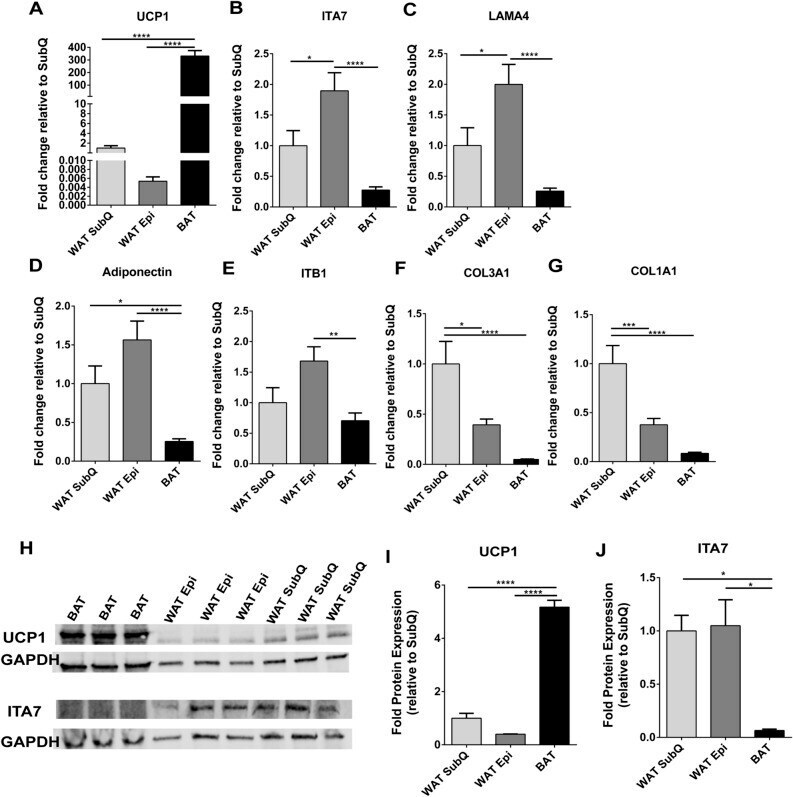
- Figure 4 ITA7 and LAMA4 are inversely correlated with the expression of UCP1 in adipose tissue. ( A ) UCP1, ( B ) ITA7, ( C ) LAMA4, ( D ) Adiponectin, ( E ) ITB1, ( F ) CO3A1 and ( G ) CO1A1 fold gene expression in epidydimal white adipose tissue (WAT Epi) and brown adipose tissue (BAT) with respect to subcutaneous white adipose tissue (WAT SubQ). n = 6 animals with two replicates per adipose tissue sample. ( H ) Protein expression of UCP1 and ITA7 in different adipose depots was assessed by western blot. Full-length blots are presented in Supplementary Fig. 5 . ( I ) UCP1 and ( J ) ITA7 band intensity was quantifed and normalized to total GAPDH signals. n = 3 animals. Data are presented as mean +- standard error of the mean with * p < 0.05, ** p < 0.01, **** p < 0.0001 as significant from one-way ANOVA followed with Tukey's multiple comparisons test.
- Submitted by
- Invitrogen Antibodies (provider)
- Main image

- Experimental details
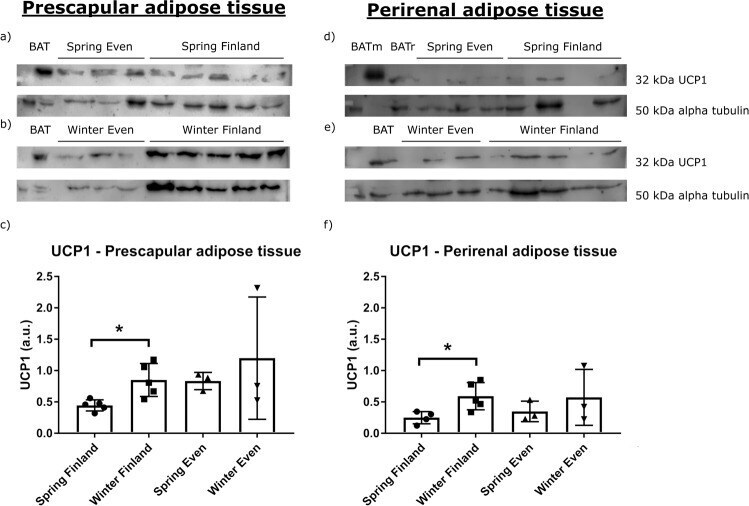
- Fig. 4 UCP1 expression in each seasons and regions. The western blots and relative expression of UCP1 from a - c reindeer prescapular and d - f perirenal adipose tissue total proteins. The upper blots on the left side show UCP1 content in prescapular adipose tissue a in spring in Even reindeer ( n = 3) and Finnish reindeer ( n = 5), b in winter in Even reindeer ( n = 3) and Finnish reindeer ( n = 5), and the lower graph shows c their relative expression levels. The upper blots on the right side show UCP1 content in perirenal adipose tissue d in spring in Even reindeer ( n = 3) and Finnish reindeer ( n = 4), e in winter in Even reindeer ( n = 3) and Finnish reindeer ( n = 5), and the lower graph shows f their relative expression levels. Samples contained 50 ug of total protein per lane, except the reindeer BAT (brown adipose tissue; BAT and BATr) samples with 5 ug and mouse BAT (BATm) with 1 ug of protein. Alpha tubulin was used as a loading control. The relative expression of UCP1 was normalized to alpha tubulin and presented as mean arbitrary units (a.u.) +- SD ( c , f ). Significant differences between seasons are indicated with a bar and an asterisk (* p < 0.05).
- Submitted by
- Invitrogen Antibodies (provider)
- Main image
- Experimental details
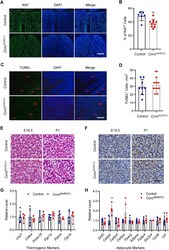
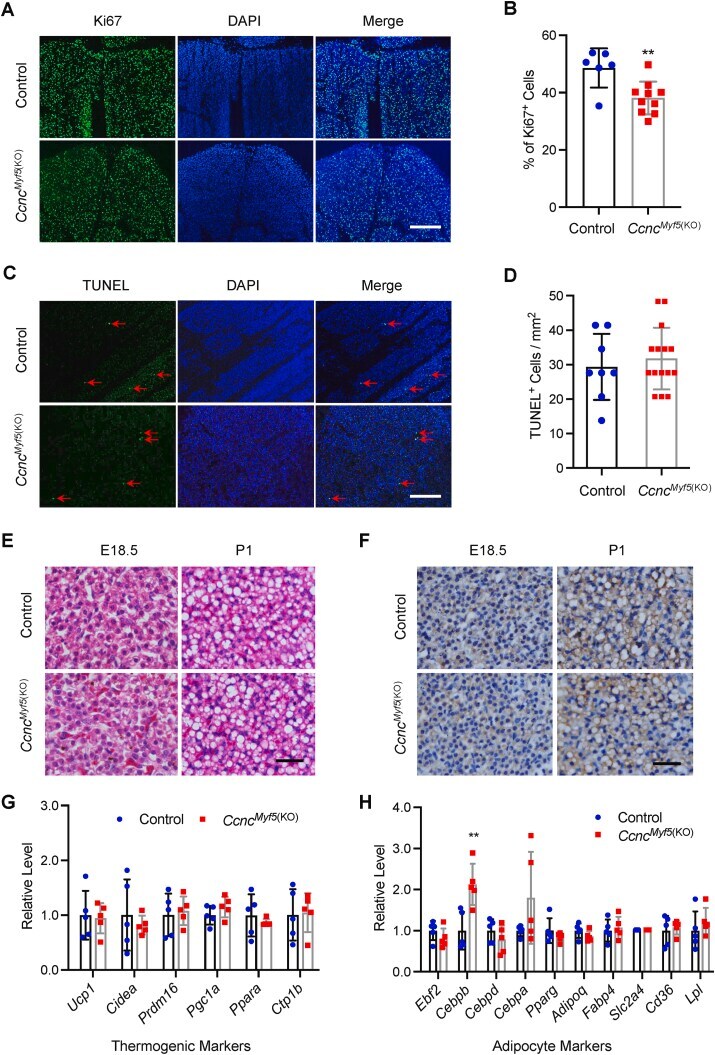
- Figure 2 CCNC deficiency in the Myf5 + lineage inhibits cell proliferation, but not affecting brown adipogenesis and cell death. ( A ) Representative images from Ki67 immunofluorescence on cryosections of BAT from the control and Ccnc Myf5 (KO) mice at E18.5. Scale bar, 200 mum. ( B ) Quantification of Ki67 positive cells. ( C ) Representative images of TUNEL assays on cryosections of BAT from the control and Ccnc Myf5 (KO) mice at E18.5. Scale bar, 200 mum. ( D ) Quantification of apoptotic cells. ( E ) H&E staining of paraffin sections of BAT from the control and Ccnc Myf5 (KO) mice at E18.5 and P1. Scale bar, 30 mum. ( F ) Representative images of UCP1 immunohistochemistry on paraffin sections of BAT from the control and Ccnc Myf5 (KO) mice at E18.5 and P1. Scale bar, 30 mum. ( G, H ) qRT-PCR analysis of thermogenic genes ( G ) and pan-adipose genes ( H ) in BAT from the control and Ccnc Myf5 (KO) mice at E18.5. ** p < 0.01 vs control. (For interpretation of the references to color in this figure legend, the reader is referred to the Web version of this article.) Figure 2
- Submitted by
- Invitrogen Antibodies (provider)
- Main image
- Experimental details
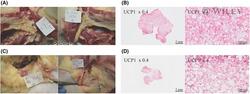
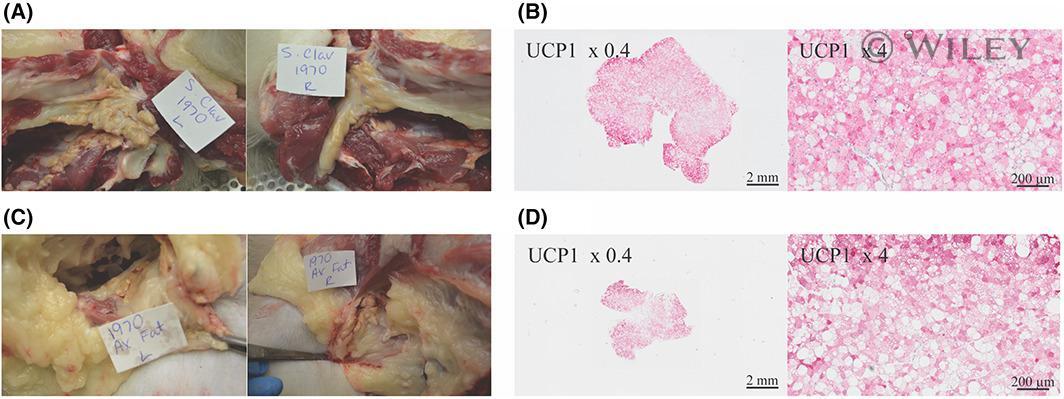
- 2 FIGURE Widespread supraclavicular BAT observed on XECT (Figure 1) visualized during (A) necropsy and (B) confirmed by histology with UCP1 staining. Large axillary BAT pockets seen on XECT in the same rhesus macaque were confirmed at (C) necropsy and (D) by UCP1 staining. BAT, brown adipose tissue; UCP1, uncoupling protein 1; XECT, xenon-enhanced computed tomography [Color figure can be viewed at wileyonlinelibrary.com ]
- Submitted by
- Invitrogen Antibodies (provider)
- Main image
- Experimental details
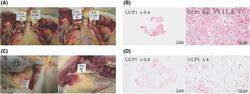
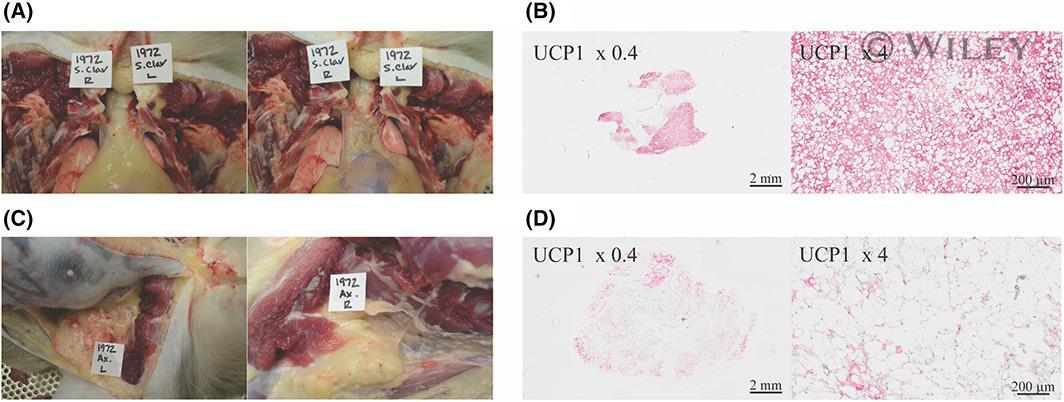
- 4 FIGURE Pockets of supraclavicular BAT seen on XECT of a prediabetic rhesus macaque (Figure 3) were visualized during (A) necropsy and confirmed on (B) histology with UCP1 staining. Limited axillary radiodensity enhancement on XECT of the same rhesus macaque (Figure 3) was consistent with little BAT observation during (C) necropsy and histology with (D) UCP1 staining. BAT, brown adipose tissue; UCP1, uncoupling protein 1; XECT, xenon-enhanced computed tomography [Color figure can be viewed at wileyonlinelibrary.com ]
- Submitted by
- Invitrogen Antibodies (provider)
- Main image
- Experimental details
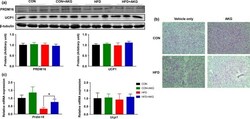
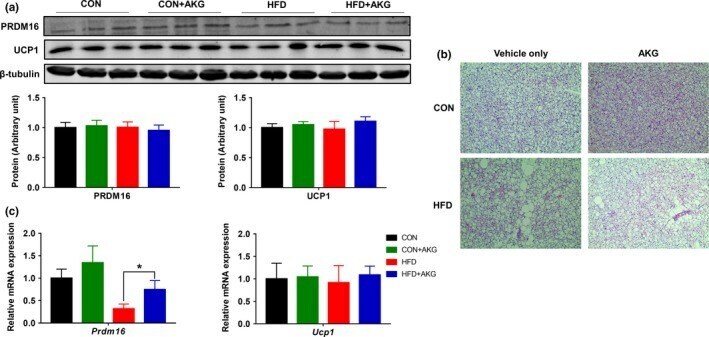
- Figure 4 Effect of alpha-ketoglutarate supplementation on metabolic activity of BAT. (a) PRDM16 and UCP1 contents in BAT analyzed by Western blot. (b) Representative H&E staining of BAT. (c) Prdm16 and Ucp1 mRNA levels in BAT analyzed by q-PCR. * p < .05 ( n = 6, mean +- SEM )
- Submitted by
- Invitrogen Antibodies (provider)
- Main image
- Experimental details
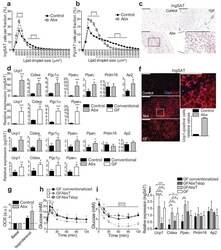
- Figure 2 Microbiota depletion promotes browning of ingSAT and pgVAT. ( a , b ) Cell size profiling of adipocytes from ingSAT ( a ) and pgVAT ( b ) fat of control and 40 days treated Abx mice. Points show mean of pooled fractions from each animal +- sem. ( n = 6 per group). ( c ) H&E staining on sections from ingSAT of mice at 14 weeks of age. Scale bar: 200 mum. ( d, e ) Relative mRNA expression in ingSAT ( d ), or pgVAT ( e ) of mice as in (a), or GF mice with respective controls. ( n = 6 per group). ( f ) Immunohistochemistry on sections from ingSAT of mice at 14 weeks of age. Bars show mean +- sem from automated quantifications of Ucp1-positive cells relative to total cell number. Scale bars: 200 mum (left) or 100 mum (right). ( g ) Oxygen consumption rates (OCR) of primary isolated ingSAT adipocytes from mice as in (a). Bars represent mean +- sd, calculated using averages of two measurements per condition per pooled sample ( n ) of two mice ( n = 4 samples, 8 mice per group). ( h ) OGTT of GF mice transplanted with microbiota from control or Abx-treated mice 3.5 weeks after transplantation. Please refer to main text for details. ( i ) ITT of mice as in (h). ( j ) Relative mRNA expression in ingSAT of mice as in (h) 4 weeks after transplantation. All values in (d,e,h-j) show mean +- sd ( n = 6 per group). Significance was calculated using non-paired two-tailed Students T-test.*: P
