 Explore
 Validate
 Learn
Learn Western blot
Antibody data
- Antibody Data
- Antigen structure
- References [0]
- Comments [0]
- Validations
- Western blot [1]
- Immunohistochemistry [1]
- Flow cytometry [1]
- Other assay [9]
Submit
Validation data
Reference
Comment
Report error
- Product number
- MA1-90582 - Provider product page

- Provider
- Invitrogen Antibodies
- Product name
- CD3e Monoclonal Antibody (SP7)
- Antibody type
- Monoclonal
- Antigen
- Synthetic peptide
- Description
- This antibody reacts with the intracytoplasmic portion of CD3 and stains human T cells in both the cortex and medula of the thymus and in peripheral lymphoid tissues. This antibody is suitable for staining normal and neoplastic T cells in formalin-fixed, paraffin embedded tissues. For tissue staining, antigen retrieval is suggested by boiling tissue sections in 10mM citrate buffer, pH 6.0 for 10 minutes followed by cooling at room temperature for 20 minutes. This antibody is predicted to react with Sheep, Rabbit, Horse, Chicken, Cow, Cat, Dog, Baboon, and Woodchuck. Recommended positive controls: WB - Recombinant human CD3e protein, Jurkat whole cell lysate, Human, mouse and rat thymus tissue lysate| IHC (P) - Pig and rat spleen tissue, human tonsil tissue, mouse epidydimal fat pad and lymph node tissues, rat infarcted heart and spleen tissues Flow Cytometry - Human peripheral blood lymphocytes, Jurkat cells IHC (F) - Mouse brain tissue
- Reactivity
- Human, Mouse, Rat
- Host
- Rabbit
- Isotype
- IgG
- Antibody clone number
- SP7
- Vial size
- 500 µL
- Concentration
- 0.009 mg/mL
- Storage
- -20° C, Avoid Freeze/Thaw Cycles
No comments: Submit comment
Supportive validation
- Submitted by
- Invitrogen Antibodies (provider)
- Main image

- Experimental details
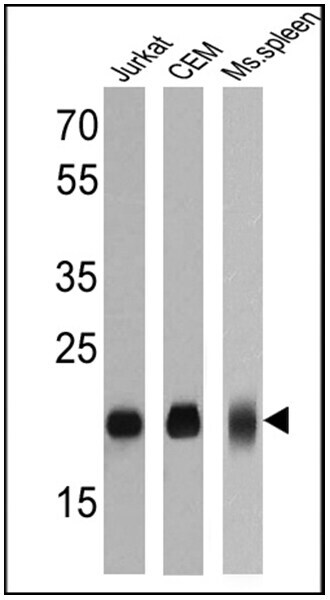
- Western blot analysis of CD3E was performed by loading 25 µg of Jurkat (Lane 1), CEM (Lane 2) and mouse spleen (Lane 3) cell lysates onto an SDS polyacrylamide gel. Proteins were transferred to a PVDF membrane and blocked at 4ºC overnight. The membrane was probed with a CD3E monoclonal antibody (Product # MA1-90582) at a dilution of 1:50 overnight at 4°C, washed in TBST, and probed with an HRP-conjugated secondary antibody for 1 hr at room temperature in the dark. Chemiluminescent detection was performed using Pierce ECL Plus Western Blotting Substrate (Product # 32132). Results show a band at approx. 20 kDa.
Supportive validation
- Submitted by
- Invitrogen Antibodies (provider)
- Main image

- Experimental details
- Immunohistochemical analysis of CD3e in formalin-fixed, paraffin-embedded human tonsil tissue using a CD3E monoclonal antibody (Product # MA1-90582). Detection was performed with a peroxidase-conjugate and AEC chromagen. Note cell membrane staining of T cells.

Supportive validation
- Submitted by
- Invitrogen Antibodies (provider)
- Main image

- Experimental details
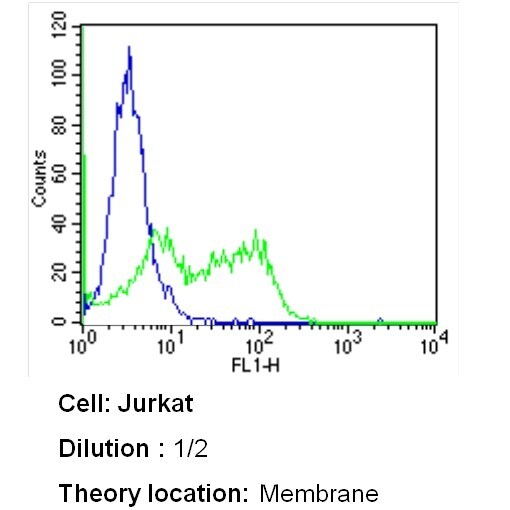
- Flow cytometry analysis of CD3E in Jurkat cells (green) compared to an isotype control (blue). Cells were harvested, adjusted to a concentration of 1-5x10^6 cells/mL, fixed with 2% paraformaldehyde and washed with PBS. Cells were blocked with a 2% solution of BSA-PBS for 30 min at room temperature and incubated with a CD3E monoclonal antibody (Product # MA1-90582) at a dilution of 1:2 for 60 min at room temperature. Cells were then incubated for 40 min at room temperature in the dark using a Dylight 488-conjugated secondary antibody and re-suspended in PBS for FACS analysis.
Supportive validation
- Submitted by
- Invitrogen Antibodies (provider)
- Main image
- Experimental details
- NULL

- Submitted by
- Invitrogen Antibodies (provider)
- Main image
- Experimental details
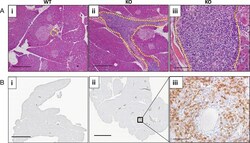
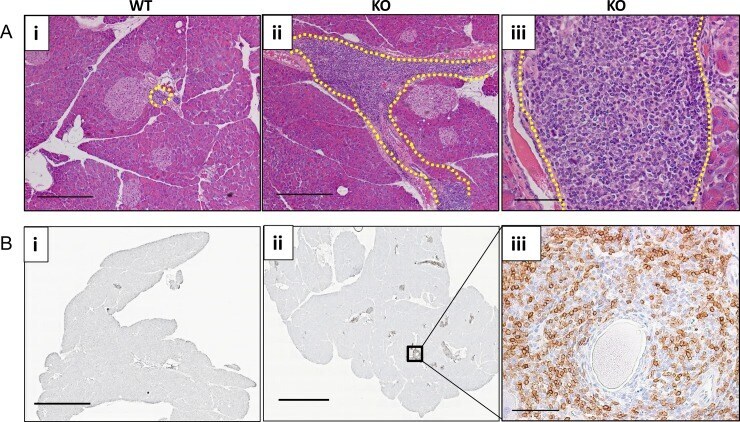
- Fig 5 FGF21 KO animals demonstrate large perivascular inflammation on obesogenic diet. HFD consumption caused severe pancreatic inflammation in FGF21 KO mice (A). H&E staining showing, that compared to WT animals (i), FGF21 KO mice developed severe pancreatic periductal inflammation (outlined area in ii-iii) when consuming a HFD diet for 16 weeks. Lymphocytic nature of inflammatory cells is shown in a higher magnification image (iii). (B) Immunohistochemical analysis for the lymphocytic marker CD3 on the pancreas of WT (i) and FGF21 KO animals (ii-iii) is represented. FGF21 KO showed higher number of CD3, T cell receptor antigen. n = 7 per group. Scale: 1 mm, Ai-ii; 2 mm, Bi-ii; 200 mum, iii.
- Submitted by
- Invitrogen Antibodies (provider)
- Main image
- Experimental details
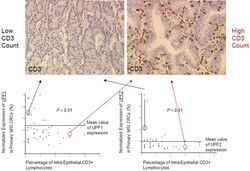
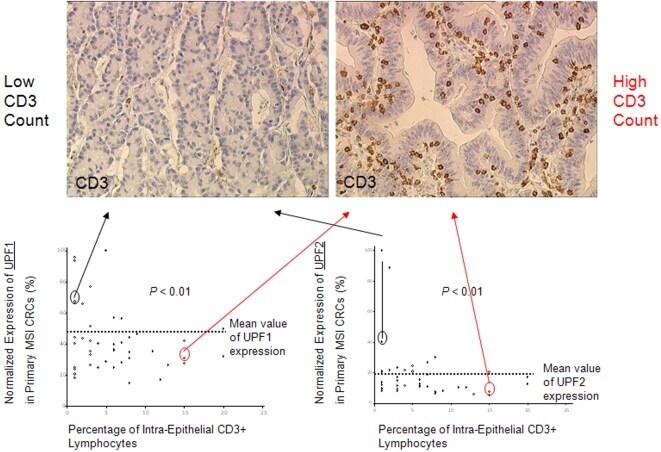
- Figure 4 Relationship between endogenous UPF1 and UPF2 mRNA expression in MSI CRCs and the number of TILs. The overall number of CD3epsilon positive-TILs was significantly related to the endogenous expression of UPF1 and UPF2 in this series of 44 MSI primary CRCs ( P
- Submitted by
- Invitrogen Antibodies (provider)
- Main image

- Experimental details
- Figure 6. PTCL in ITK-SYK CD4-Cre mice. (A) Disruption of the splenic architecture with highly proliferative cells in ITK-SYK CD4-Cre mice was revealed by hematoxylin and eosin (H&E) staining and immunohistochemistry with anti-Ki-67 antibodies. Bars: (black) 1 mm; (white) 50 um. Data shown are representative of five diseased ITK-SYK CD4-Cre mice analyzed. (B) Splenic cells from diseased ITK-SYK CD4-Cre mice were stained against CD4 and CD8 and analyzed by FACS. Selected examples of each type of T cell expansion from a total number of 40 mice analyzed are shown. (C) Bone marrow cell preparations from diseased ITK-SYK CD4-Cre or control (CD4-Cre) mice were stained with antibodies against TCR-beta. The frequency of eGFP + T cells is indicated. Data are representative of five independent experiments with a total number of 15 mice per genotype analyzed. (D) Solid organ infiltration of abnormal CD3 + T cells. Tissue sections from kidney (KID), liver (LIV), and lung (LNG) of affected ITK-SYK CD4-Cre animals were stained with H&E. Immunohistochemistry with anti-CD3 antibodies was additionally performed. Bars: (black) 200 um; (white), 1 mm. Data shown are representative of five diseased ITK-SYK CD4-Cre mice analyzed. (E) Selective expansion of distinct T cell clones. Single cell suspensions from spleen (SPL), kidney (KID), and liver (LIV) of three individual mice were stained with antibodies against CD4, CD8, and a panel of TCR-Vbeta chain-specific antibodies (see Materials and method

- Submitted by
- Invitrogen Antibodies (provider)
- Main image
- Experimental details
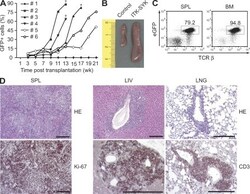
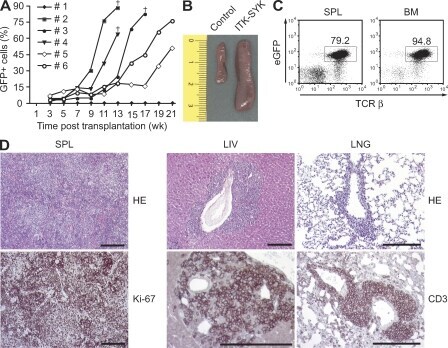
- Figure 7. Proliferation and infiltration of ITK-SYK-expressing T cells upon transplantation. (A) Splenic cells from diseased ITK-SYK CD4-Cre animals older than 12 wk of age were intravenously injected into nude recipient mice for transplantation. The frequencies of ITK-SYK-expressing eGFP + peripheral blood cells in the recipients were monitored over time. Recipients that succumbed to the disease are indicated (+). Representative examples are shown. 9 out of 10 donor mice transplanted the disease. Five independent transplantations were performed. (B) Spleens from a control and a representative recipient mouse from A are shown (in centimeters). (C) Recipients were sacrificed upon signs of disease, and bone marrow (BM) and spleen (SPL) suspensions were stained against TCR-beta. Representative frequencies of eGFP fluorescent T cells in spleen and bone marrow of 10 analyzed diseased recipients are indicated. (D) Tissue sections from spleen (SPL), liver (LIV), and lung (LNG) were analyzed after H&E staining or immunohistochemistry with anti-CD3 or anti-Ki-67 antibodies. Bars, 1 mm. Representative examples of four analyzed diseased recipients are shown.
- Submitted by
- Invitrogen Antibodies (provider)
- Main image
- Experimental details
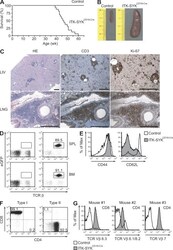
- Figure 8. ITK-SYK CD19-Cre mice develop clonal PTCLs. (A) ITK-SYK CD19-Cre mice succumb to disease. Kaplan-Meier curve of ITK-SYK CD19-Cre ( n = 18) and control (CD19-Cre) mice ( n = 10). (B) Splenomegaly in ITK-SYK CD19-Cre mice. Representative spleens from 50-wk-old control and ITK-SYK CD19-Cre mice are shown (in centimeters). (C) Solid organ infiltration with abnormally proliferating T cells in ITK-SYK CD19-Cre mice. H&E staining and immunohistochemistry with anti-CD3 and anti-Ki-67 antibodies were performed on liver (LIV) and lung (LNG) sections. Bars, 1 mm. Data representative of six diseased ITK-SYK CD19-Cre mice are shown. (D) Bone marrow (BM) or spleen (SPL) cell suspensions of 50-wk-old control and ITK-SYK CD19-Cre mice were stained against TCR-beta. The frequency of eGFP + T cells in a representative ITK-SYK CD19-Cre mouse is indicated. (E) Expanded T cells in ITK-SYK CD19-Cre mice display an activated phenotype. CD44 and CD62L surface expression on affected T cells or controls was assessed using FACS. One representative example of CD4 + T cells is shown. (F) Spleen cells from diseased ITK-SYK CD19-Cre mice ( n = 16) were stained against CD4 and CD8. Examples of preferential CD4 + T cell (Type I) or CD8 + T cell (Type II) expansions are shown. (G) T cell populations in ITK-SYK CD19-Cre mice are clonal. Single cell suspensions from spleens of individual mice were stained with antibodies against CD4, CD8, and a panel of antibodies against TCR-Vbeta chains (see Materia

- Submitted by
- Invitrogen Antibodies (provider)
- Main image

- Experimental details
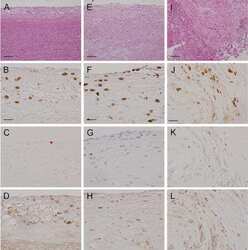
- Figure 2 Histological and biochemical analysis of mice lacking Dicer in Schwann cells. ( A-C ) Longitudinal sections of sciatic nerves from 22-day old Dicer fl/fl Dhh-Cre + and control Dicer wt/fl Dhh-Cre + littermates stained with haematoxylin and eosin (HE) or decorated with S100, MIB1, CD3, or CD68 antibody. At least four nerves were analyzed per genotype. Scale bars = 50 um. S100 positivity indicates Schwann cell development progresses at least up to the stage of immature Schwann cells ( A ). Increased proliferation in Dicer mutant nerves, as indicated by mitotic events (black arrows in A ) and increased percentage of positive nuclei in MIB1 immunohistochemistry ( B ). Quantification of MIB1-positive nuclei shows a significantly higher percentage of proliferating cells in Dicer fl/fl Dhh-Cre + compared to Dicer wt/fl Dhh-Cre + littermate nerves. Error bars indicate standard deviation, p = 0.0003, p value was determined using unpaired two-tailed student's t-test ( B ). Few CD3-positive T cells and an increased percentage of CD68-positive macrophages infiltrated the nerves of Dicer fl/fl Dhh-Cre + mice ( C ). Biochemical analysis of signal transduction pathways and myelin components by Western blot ( D ). Compared to control Dicer wt/fl Dhh-Cre + littermates, phospho-Akt and phospho-Erk were significantly increased in sciatic nerves of 18-day old mice lacking Dicer in Schwann cells, while total Akt and Erk protein levels were unchanged compared to controls, and NFkappaB was

- Submitted by
- Invitrogen Antibodies (provider)
- Main image
- Experimental details
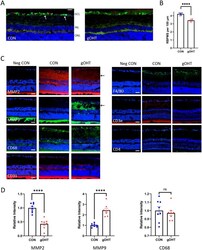
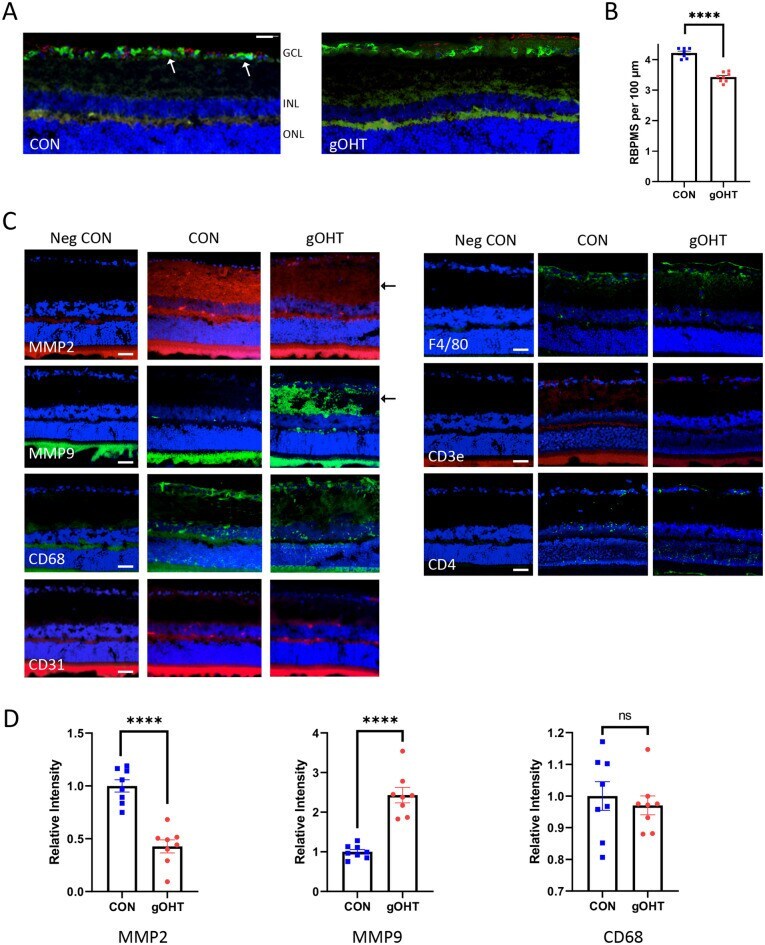
- Figure 3 Chronic gOHT results in inner retinal neuropathology. ( A ) Representative retinal images from CON and gOHT eyes after 17 weeks in the gOHT group, stained for RBPMS (green, arrows) and GFAP (red), in addition to the nuclear marker DAPI (blue) (scale bar indicates 50 mum). ( B ) Corresponding quantification of RGC density indicates significantly decreased survival in gOHT compared to CON (****p < 0.0001, bars are SE). ( C ) Representative immunostaining panels of CON and gOHT retinas in the same orientation. MMP-2 signal decreased and MMP-9 signal is increased in the gOHT inner retina compared to CON eyes (arrows). There was no notable difference in staining for CD68, CD31, F4/80, CD3e or CD4 between gOHT and CON. Note: negative controls (Neg CON) are sections stained with a secondary antibody alone. (scale bars indicate 50 mum). ( D ) Quantification of staining across image sets shows a significant decrease for MMP2, a significant increase for MMP9, and no change for CD68 markers (n = 8, bars are SE, ****p < 0.0001, ns; not significant). GCL, ganglion cell layer; INL, inner nuclear layer; Neg CON, Negative Control; ONL, outer nuclear layer.
- Submitted by
- Invitrogen Antibodies (provider)
- Main image
- Experimental details
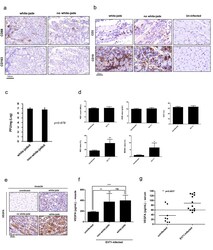
- Additional file 1: Figure S1. Comparisons between white-jaded and non-white-jaded muscles. a & b Paraffin-embedded muscle sections were stained with various antibodies specific for lymphocyte and macrophage markers. Massive infiltration of M1 macrophage (CD68) was detected in both white-jaded and non-white-jaded muscles. c Infectious virus was recovered and titrated from EV-A71-infected muscle. No significant difference was found between white-jaded and non-white-jaded muscle. d Analysis by complete blood count (CBC) revealed no statistically significant difference in the total numbers of red blood cells (RBC), hemoglobin concentration (HGB value) and hematocrit (HCT value) between uninfected ( N = 3) and EV-A71-infected ( N = 6) mice. In contrast to the significant decrease of lymphocytes in EV-A71-infected mice, both neutrophil (NEU) and monocyte (MONO) were increased significantly in EV-A71 infected mice. e Strong VEGFA expression was detected by IHC in both white-jaded and non-white-jaded muscles. f Similar levels of VEGFA protein expression were detected by ELISA between white-jaded and non-white-jaded muscles. ns, not statistically significant. g A significantly increased level of VEGFA in the blood circulation was detected by ELISA in EV-A71-infected mice (6-9 dpi) with disease manifestation. No increase in VEGF was detected in uninfected control mice. Dotted line represents the detection sensitivity in this ELISA kit.
