Explore
 Validate
 Learn
Learn Flow cytometry
Antibody data
- Antibody Data
- Antigen structure
- References [30]
- Comments [0]
- Validations
- Flow cytometry [1]
- Other assay [26]
Submit
Validation data
Reference
Comment
Report error
- Product number
- 12-0037-41 - Provider product page

- Provider
- Invitrogen Antibodies
- Product name
- CD3 Monoclonal Antibody (OKT3), PE, eBioscience™
- Antibody type
- Monoclonal
- Antigen
- Other
- Description
- Description: The OKT3 monoclonal antibody reacts with an epitope on the epsilon-subunit within the human CD3 complex. The OKT3 antibody has been reported to have potent immunosuppressive properties in vivo and has been proven effective in the treatment of renal, heart and liver allograft rejection. The CD3 subunits, gamma, delta, and epsilon chains, are required for proper assembly, trafficking and surface expression of the TCR complex. CD3 is expressed by thymocytes in a developmentally regulated manner and by all mature T cells. Crosslinking of TCR initiates an intracellular biochemical pathway resulting in cellular activation and proliferation.
- Conjugate
- Yellow dye
- Antibody clone number
- OKT3
- Concentration
- 5 µL/Test
Submitted references Broad and potent neutralizing human antibodies to tick-borne flaviviruses protect mice from disease.
Changes in circulating exosome molecular profiles following surgery/(chemo)radiotherapy: early detection of response in head and neck cancer patients.
Imbalance between T helper 1 and regulatory T cells plays a detrimental role in experimental Parkinson's disease in mice.
HDAC Inhibitor, CG-745, Enhances the Anti-Cancer Effect of Anti-PD-1 Immune Checkpoint Inhibitor by Modulation of the Immune Microenvironment.
Small-molecule MMP2/MMP9 inhibitor SB-3CT modulates tumor immune surveillance by regulating PD-L1.
IL-10 Restores MHC Class I Expression and Interferes With Immunity in Papillary Thyroid Cancer With Hashimoto Thyroiditis.
Selective Killing of Activated T Cells by 5-Aminolevulinic Acid Mediated Photodynamic Effect: Potential Improvement of Extracorporeal Photopheresis.
Senolytics prevent mt-DNA-induced inflammation and promote the survival of aged organs following transplantation.
Pyridoxal-5'-Phosphate Promotes Immunomodulatory Function of Adipose-Derived Mesenchymal Stem Cells through Indoleamine 2,3-Dioxygenase-1 and TLR4/NF-κB Pathway.
Integrating Ligand-Receptor Interactions and In Vitro Evolution for Streamlined Discovery of Artificial Nucleic Acid Ligands.
MicroRNA‑155 inhibits the proliferation of CD8+ T cells via upregulating regulatory T cells in vitiligo.
Cdc42 Couples T Cell Receptor Endocytosis to GRAF1-Mediated Tubular Invaginations of the Plasma Membrane.
Quantitative Interactomics in Primary T Cells Provides a Rationale for Concomitant PD-1 and BTLA Coinhibitor Blockade in Cancer Immunotherapy.
Unleashing Type-2 Dendritic Cells to Drive Protective Antitumor CD4(+) T Cell Immunity.
Site-specific PEGylation of an anti-CEA/CD3 bispecific antibody improves its antitumor efficacy.
Transcriptomal signatures of vaccine adjuvants and accessory immunostimulation of sentinel cells by toll-like receptor 2/6 agonists.
Restimulation-induced T-cell death through NTB-A/SAP signaling pathway is impaired in tuberculosis patients with depressed immune responses.
MicroRNA expression profiles in human CD3(+) T cells following stimulation with anti-human CD3 antibodies.
NKG2D Ligand-Targeted Bispecific T-Cell Engagers Lead to Robust Antitumor Activity against Diverse Human Tumors.
Umbilical Cord-Derived Mesenchymal Stem Cells Suppress Autophagy of T Cells in Patients with Systemic Lupus Erythematosus via Transfer of Mitochondria.
Expression of the galectin-9-Tim-3 pathway in glioma tissues is associated with the clinical manifestations of glioma.
MiRNA-22 inhibits oncogene galectin-1 in hepatocellular carcinoma.
Oncogenic NRAS hyper-activates multiple pathways in human cord blood stem/progenitor cells and promotes myelomonocytic proliferation in vivo.
A novel antibody-drug conjugate targeting SAIL for the treatment of hematologic malignancies.
IL-12 secreting tumor-targeted chimeric antigen receptor T cells eradicate ovarian tumors in vivo.
Towards programming immune tolerance through geometric manipulation of phosphatidylserine.
TL1A induces TCR independent IL-6 and TNF-α production and growth of PLZF⁺ leukocytes.
Bioengineering T cells to target carbohydrate to treat opportunistic fungal infection.
A mutation in the human Uncoordinated 119 gene impairs TCR signaling and is associated with CD4 lymphopenia.
Lateral compartmentalization of T cell receptor versus CD45 by galectin-N-glycan binding and microfilaments coordinate basal and activation signaling.
Agudelo M, Palus M, Keeffe JR, Bianchini F, Svoboda P, Salát J, Peace A, Gazumyan A, Cipolla M, Kapoor T, Guidetti F, Yao KH, Elsterová J, Teislerová D, Chrdle A, Hönig V, Oliveira T, West AP, Lee YE, Rice CM, MacDonald MR, Bjorkman PJ, Růžek D, Robbiani DF, Nussenzweig MC
The Journal of experimental medicine 2021 May 3;218(5)
The Journal of experimental medicine 2021 May 3;218(5)
Changes in circulating exosome molecular profiles following surgery/(chemo)radiotherapy: early detection of response in head and neck cancer patients.
Theodoraki MN, Laban S, Jackson EK, Lotfi R, Schuler PJ, Brunner C, Hoffmann TK, Whiteside TL, Hofmann L
British journal of cancer 2021 Dec;125(12):1677-1686
British journal of cancer 2021 Dec;125(12):1677-1686
Imbalance between T helper 1 and regulatory T cells plays a detrimental role in experimental Parkinson's disease in mice.
Li W, Luo Y, Xu H, Ma Q, Yao Q
The Journal of international medical research 2021 Apr;49(4):300060521998471
The Journal of international medical research 2021 Apr;49(4):300060521998471
HDAC Inhibitor, CG-745, Enhances the Anti-Cancer Effect of Anti-PD-1 Immune Checkpoint Inhibitor by Modulation of the Immune Microenvironment.
Kim YD, Park SM, Ha HC, Lee AR, Won H, Cha H, Cho S, Cho JM
Journal of Cancer 2020;11(14):4059-4072
Journal of Cancer 2020;11(14):4059-4072
Small-molecule MMP2/MMP9 inhibitor SB-3CT modulates tumor immune surveillance by regulating PD-L1.
Ye Y, Kuang X, Xie Z, Liang L, Zhang Z, Zhang Y, Ma F, Gao Q, Chang R, Lee HH, Zhao S, Su J, Li H, Peng J, Chen H, Yin M, Peng C, Yang N, Wang J, Liu J, Liu H, Han L, Chen X
Genome medicine 2020 Sep 28;12(1):83
Genome medicine 2020 Sep 28;12(1):83
IL-10 Restores MHC Class I Expression and Interferes With Immunity in Papillary Thyroid Cancer With Hashimoto Thyroiditis.
Lu ZW, Hu JQ, Liu WL, Wen D, Wei WJ, Wang YL, Wang Y, Liao T, Ji QH
Endocrinology 2020 Oct 1;161(10)
Endocrinology 2020 Oct 1;161(10)
Selective Killing of Activated T Cells by 5-Aminolevulinic Acid Mediated Photodynamic Effect: Potential Improvement of Extracorporeal Photopheresis.
Darvekar S, Juzenas P, Oksvold M, Kleinauskas A, Holien T, Christensen E, Stokke T, Sioud M, Peng Q
Cancers 2020 Feb 6;12(2)
Cancers 2020 Feb 6;12(2)
Senolytics prevent mt-DNA-induced inflammation and promote the survival of aged organs following transplantation.
Iske J, Seyda M, Heinbokel T, Maenosono R, Minami K, Nian Y, Quante M, Falk CS, Azuma H, Martin F, Passos JF, Niemann CU, Tchkonia T, Kirkland JL, Elkhal A, Tullius SG
Nature communications 2020 Aug 27;11(1):4289
Nature communications 2020 Aug 27;11(1):4289
Pyridoxal-5'-Phosphate Promotes Immunomodulatory Function of Adipose-Derived Mesenchymal Stem Cells through Indoleamine 2,3-Dioxygenase-1 and TLR4/NF-κB Pathway.
Li C, Huang J, Zhu H, Shi Q, Li D, Ju X
Stem cells international 2019;2019:3121246
Stem cells international 2019;2019:3121246
Integrating Ligand-Receptor Interactions and In Vitro Evolution for Streamlined Discovery of Artificial Nucleic Acid Ligands.
Zumrut HE, Batool S, Argyropoulos KV, Williams N, Azad R, Mallikaratchy PR
Molecular therapy. Nucleic acids 2019 Sep 6;17:150-163
Molecular therapy. Nucleic acids 2019 Sep 6;17:150-163
MicroRNA‑155 inhibits the proliferation of CD8+ T cells via upregulating regulatory T cells in vitiligo.
Lv M, Li Z, Liu J, Lin F, Zhang Q, Li Z, Wang Y, Wang K, Xu Y
Molecular medicine reports 2019 Oct;20(4):3617-3624
Molecular medicine reports 2019 Oct;20(4):3617-3624
Cdc42 Couples T Cell Receptor Endocytosis to GRAF1-Mediated Tubular Invaginations of the Plasma Membrane.
Rossatti P, Ziegler L, Schregle R, Betzler VM, Ecker M, Rossy J
Cells 2019 Nov 4;8(11)
Cells 2019 Nov 4;8(11)
Quantitative Interactomics in Primary T Cells Provides a Rationale for Concomitant PD-1 and BTLA Coinhibitor Blockade in Cancer Immunotherapy.
Celis-Gutierrez J, Blattmann P, Zhai Y, Jarmuzynski N, Ruminski K, Grégoire C, Ounoughene Y, Fiore F, Aebersold R, Roncagalli R, Gstaiger M, Malissen B
Cell reports 2019 Jun 11;27(11):3315-3330.e7
Cell reports 2019 Jun 11;27(11):3315-3330.e7
Unleashing Type-2 Dendritic Cells to Drive Protective Antitumor CD4(+) T Cell Immunity.
Binnewies M, Mujal AM, Pollack JL, Combes AJ, Hardison EA, Barry KC, Tsui J, Ruhland MK, Kersten K, Abushawish MA, Spasic M, Giurintano JP, Chan V, Daud AI, Ha P, Ye CJ, Roberts EW, Krummel MF
Cell 2019 Apr 18;177(3):556-571.e16
Cell 2019 Apr 18;177(3):556-571.e16
Site-specific PEGylation of an anti-CEA/CD3 bispecific antibody improves its antitumor efficacy.
Pan H, Liu J, Deng W, Xing J, Li Q, Wang Z
International journal of nanomedicine 2018;13:3189-3201
International journal of nanomedicine 2018;13:3189-3201
Transcriptomal signatures of vaccine adjuvants and accessory immunostimulation of sentinel cells by toll-like receptor 2/6 agonists.
Salyer ACD, David SA
Human vaccines & immunotherapeutics 2018 Jul 3;14(7):1686-1696
Human vaccines & immunotherapeutics 2018 Jul 3;14(7):1686-1696
Restimulation-induced T-cell death through NTB-A/SAP signaling pathway is impaired in tuberculosis patients with depressed immune responses.
Hernández Del Pino RE, Pellegrini JM, Rovetta AI, Peña D, Álvarez GI, Rolandelli A, Musella RM, Palmero DJ, Malbran A, Pasquinelli V, García VE
Immunology and cell biology 2017 Sep;95(8):716-728
Immunology and cell biology 2017 Sep;95(8):716-728
MicroRNA expression profiles in human CD3(+) T cells following stimulation with anti-human CD3 antibodies.
Sousa IG, do Almo MM, Simi KC, Bezerra MA, Andrade RV, Maranhão AQ, Brigido MM
BMC research notes 2017 Mar 14;10(1):124
BMC research notes 2017 Mar 14;10(1):124
NKG2D Ligand-Targeted Bispecific T-Cell Engagers Lead to Robust Antitumor Activity against Diverse Human Tumors.
Godbersen C, Coupet TA, Huehls AM, Zhang T, Battles MB, Fisher JL, Ernstoff MS, Sentman CL
Molecular cancer therapeutics 2017 Jul;16(7):1335-1346
Molecular cancer therapeutics 2017 Jul;16(7):1335-1346
Umbilical Cord-Derived Mesenchymal Stem Cells Suppress Autophagy of T Cells in Patients with Systemic Lupus Erythematosus via Transfer of Mitochondria.
Chen J, Wang Q, Feng X, Zhang Z, Geng L, Xu T, Wang D, Sun L
Stem cells international 2016;2016:4062789
Stem cells international 2016;2016:4062789
Expression of the galectin-9-Tim-3 pathway in glioma tissues is associated with the clinical manifestations of glioma.
Liu Z, Han H, He X, Li S, Wu C, Yu C, Wang S
Oncology letters 2016 Mar;11(3):1829-1834
Oncology letters 2016 Mar;11(3):1829-1834
MiRNA-22 inhibits oncogene galectin-1 in hepatocellular carcinoma.
You Y, Tan JX, Dai HS, Chen HW, Xu XJ, Yang AG, Zhang YJ, Bai LH, Bie P
Oncotarget 2016 Aug 30;7(35):57099-57116
Oncotarget 2016 Aug 30;7(35):57099-57116
Oncogenic NRAS hyper-activates multiple pathways in human cord blood stem/progenitor cells and promotes myelomonocytic proliferation in vivo.
Wang T, Li C, Xia C, Dong Y, Yang D, Geng Y, Cai J, Zhang J, Zhang X, Wang J
American journal of translational research 2015;7(10):1963-73
American journal of translational research 2015;7(10):1963-73
A novel antibody-drug conjugate targeting SAIL for the treatment of hematologic malignancies.
Kim SY, Theunissen JW, Balibalos J, Liao-Chan S, Babcock MC, Wong T, Cairns B, Gonzalez D, van der Horst EH, Perez M, Levashova Z, Chinn L, D'Alessio JA, Flory M, Bermudez A, Jackson DY, Ha E, Monteon J, Bruhns MF, Chen G, Migone TS
Blood cancer journal 2015 May 29;5(5):e316
Blood cancer journal 2015 May 29;5(5):e316
IL-12 secreting tumor-targeted chimeric antigen receptor T cells eradicate ovarian tumors in vivo.
Koneru M, Purdon TJ, Spriggs D, Koneru S, Brentjens RJ
Oncoimmunology 2015 Mar;4(3):e994446
Oncoimmunology 2015 Mar;4(3):e994446
Towards programming immune tolerance through geometric manipulation of phosphatidylserine.
Roberts RA, Eitas TK, Byrne JD, Johnson BM, Short PJ, McKinnon KP, Reisdorf S, Luft JC, DeSimone JM, Ting JP
Biomaterials 2015 Dec;72:1-10
Biomaterials 2015 Dec;72:1-10
TL1A induces TCR independent IL-6 and TNF-α production and growth of PLZF⁺ leukocytes.
Reichwald K, Jørgensen TZ, Tougaard P, Skov S
PloS one 2014;9(1):e85793
PloS one 2014;9(1):e85793
Bioengineering T cells to target carbohydrate to treat opportunistic fungal infection.
Kumaresan PR, Manuri PR, Albert ND, Maiti S, Singh H, Mi T, Roszik J, Rabinovich B, Olivares S, Krishnamurthy J, Zhang L, Najjar AM, Huls MH, Lee DA, Champlin RE, Kontoyiannis DP, Cooper LJ
Proceedings of the National Academy of Sciences of the United States of America 2014 Jul 22;111(29):10660-5
Proceedings of the National Academy of Sciences of the United States of America 2014 Jul 22;111(29):10660-5
A mutation in the human Uncoordinated 119 gene impairs TCR signaling and is associated with CD4 lymphopenia.
Gorska MM, Alam R
Blood 2012 Feb 9;119(6):1399-406
Blood 2012 Feb 9;119(6):1399-406
Lateral compartmentalization of T cell receptor versus CD45 by galectin-N-glycan binding and microfilaments coordinate basal and activation signaling.
Chen IJ, Chen HL, Demetriou M
The Journal of biological chemistry 2007 Nov 30;282(48):35361-72
The Journal of biological chemistry 2007 Nov 30;282(48):35361-72
No comments: Submit comment
Supportive validation
- Submitted by
- Invitrogen Antibodies (provider)
- Main image
- Experimental details
- Staining of normal human peripheral blood cells with Mouse IgG2a K Isotype Control PE (Product # 12-4724-81) (open histogram) or Anti-Human CD3 PE (filled histogram). Cells in the lymphocyte gate were analyzed.
- Conjugate
- Yellow dye

Supportive validation
- Submitted by
- Invitrogen Antibodies (provider)
- Main image

- Experimental details
- NULL
- Conjugate
- Yellow dye

- Submitted by
- Invitrogen Antibodies (provider)
- Main image
- Experimental details
- NULL
- Conjugate
- Yellow dye
- Submitted by
- Invitrogen Antibodies (provider)
- Main image
- Experimental details
- NULL
- Conjugate
- Yellow dye
- Submitted by
- Invitrogen Antibodies (provider)
- Main image
- Experimental details
- NULL
- Conjugate
- Yellow dye
- Submitted by
- Invitrogen Antibodies (provider)
- Main image
- Experimental details
- NULL
- Conjugate
- Yellow dye
- Submitted by
- Invitrogen Antibodies (provider)
- Main image
- Experimental details
- NULL
- Conjugate
- Yellow dye

- Submitted by
- Invitrogen Antibodies (provider)
- Main image
- Experimental details
- NULL
- Conjugate
- Yellow dye
- Submitted by
- Invitrogen Antibodies (provider)
- Main image
- Experimental details
- NULL
- Conjugate
- Yellow dye

- Submitted by
- Invitrogen Antibodies (provider)
- Main image
- Experimental details
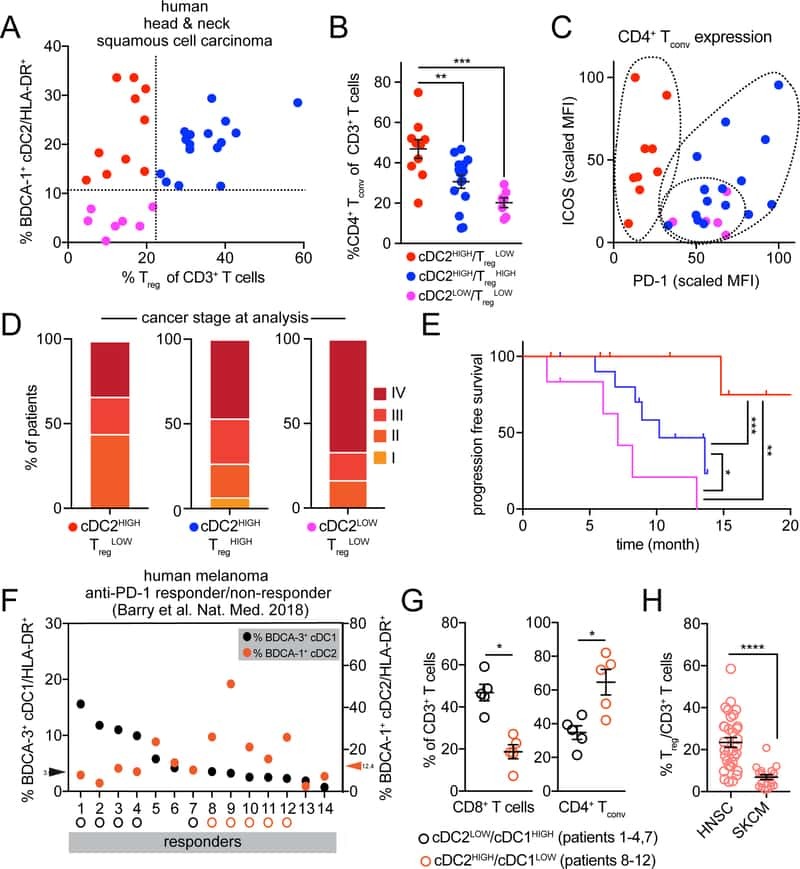
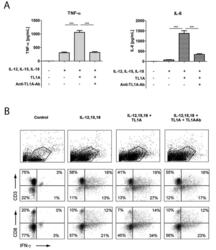
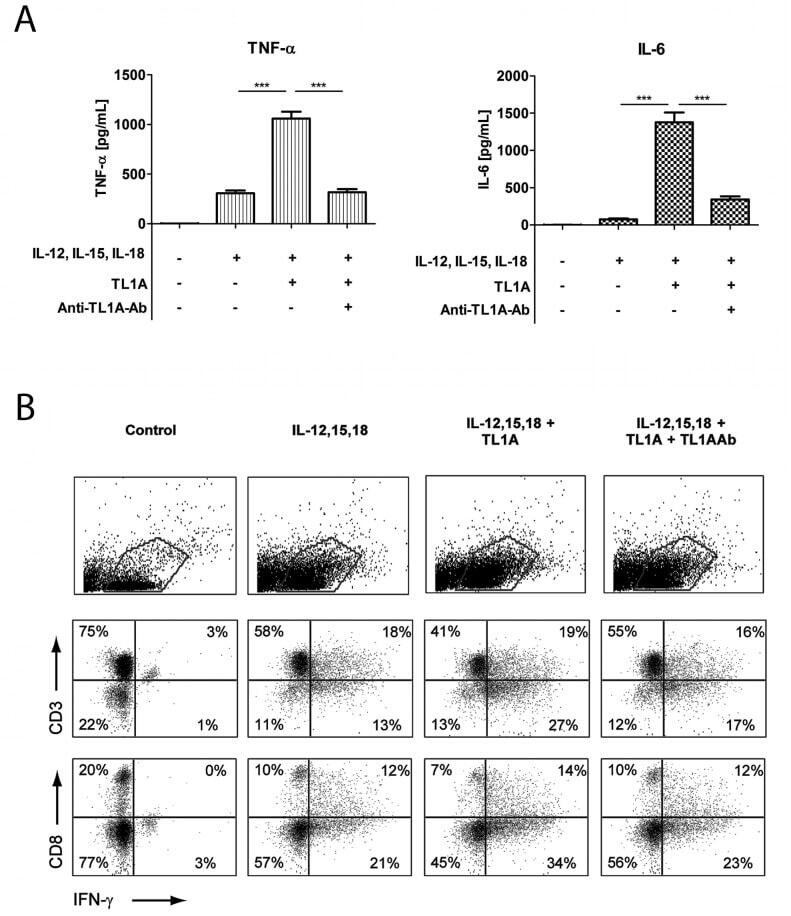
- Figure 9 IL-6 produced by PBLs depleted for CD4 + , CD8 + , HLA-DR + or CD56 + /CD16 + cells. (A) Freshly purified PBLs stained for CD4, CD8, CD3, HLA-DR, CD16, CD56. Depletion controls for PBLs depleted for CD4 + , CD8 + , HLA-DR + or CD16 + /CD56 + cells. PBLs and depletions were stimulated for 7 days with combinations of IL-12 (4 ng/mL), IL-15 (10 ng/mL), IL-18 (40 ng/mL) and TL1A (100 ng/mL) and stained for CD4, CD8, CD3, HLA-DR, CD16 and CD56 expression. (B) IL-6 production after 7 days by PBLs and depletions stimulated with IL-12, IL-15, IL-18 and TL1A as described above. Error bars represent the SEM of two measurements. Statistically significant differences by t-test: *** = p
- Conjugate
- Yellow dye

- Submitted by
- Invitrogen Antibodies (provider)
- Main image
- Experimental details
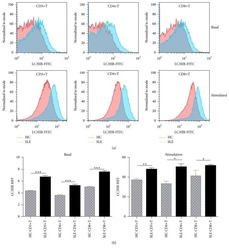
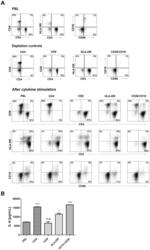
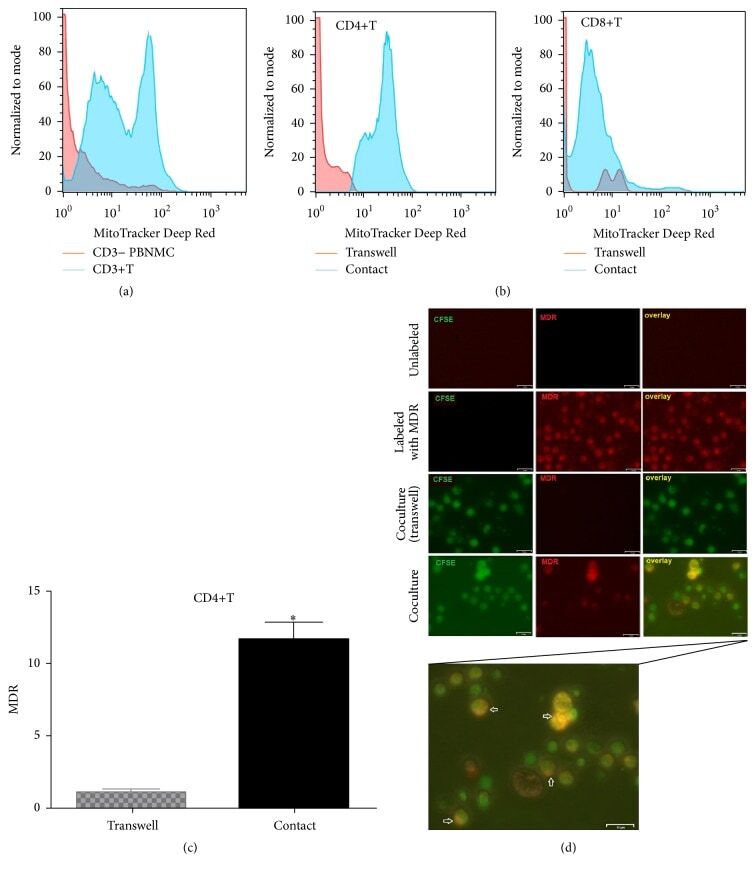
- Figure 7 UC-MSCs transferred mitochondria to activate T cells. PBMCs from SLE patients were labeled with carboxyfluorescein succinimidyl amino ester (CFSE) and treated with anti-CD3/CD28 antibodies for two days. Then they were cocultured with UC-MSCs for 12 h, which had been prelabeled with respiratory mitochondrion specific probe Mitotracker Deep Red (MDR). PBMCs were cultured with UC-MSCs through transwell as control. Then PBMCs were stained with anti-CD3, anti-CD4, or anti-CD8 dye and detected for MDR fluorescence with flow cytometry. Fluorescence microscopy was carried out similarly with anti-CD3/28 stimulation for 12 h and then cocultured for 6 h. All experiments were performed in triplicate. (a) T cells (CD3 positive) rather than non-T cells (CD3 negative) got MDR staining. (b-d) T cells cultured with UC-MSCs directly rather than through transwell got transferred mitochondria ( n = 3). Arrows indicated transferred mitochondria within lymphocytes. * p < 0.05.
- Conjugate
- Yellow dye
- Submitted by
- Invitrogen Antibodies (provider)
- Main image
- Experimental details
- Figure 2 TL1A induces IL-6 and TNF-alpha. Freshly purified PBMCs were incubated with IL-12 (2 ng/mL), IL-15 (10 ng/mL), IL-18 (10 ng/mL), TL1A (100 ng/mL) and TL1AAb (1 ug/mL, blocking antibody). Extra IL-15 (2 ng/mL) was added on day 3. ( A ) After 6 days, supernatants were collected and different cytokines were measured by bead-based ELISA. Error bars represent the SEM of eight measurements. Statistically significant differences are indicated by ***(t-test, P
- Conjugate
- Yellow dye
- Submitted by
- Invitrogen Antibodies (provider)
- Main image
- Experimental details
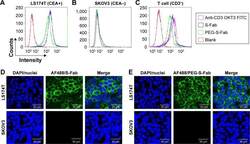
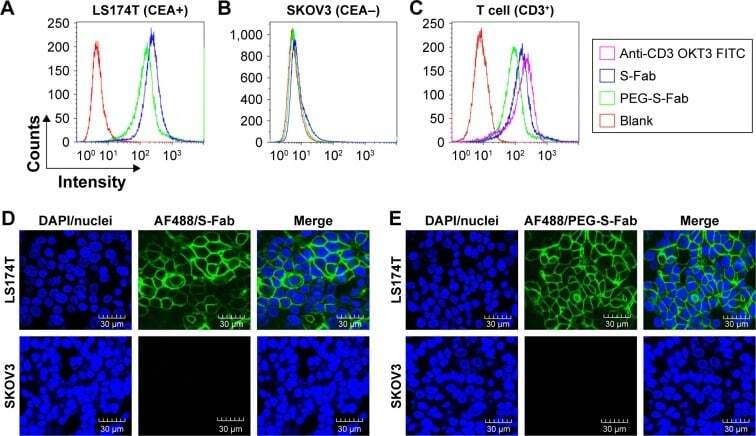
- Figure 4 PEG-S-Fab can bind CEA on tumor cells and CD3 + on T cells. Notes: Flow cytometry analysis of PEG-S-Fab and S-Fab on CEA-positive LS174T cells ( A ), CEA-negative SKOV3 cells ( B ), and CD3 + T cells ( C ). The positive control anti-CD3 antibody OKT3 was used for T-cell flow cytometry. Confocal microscopy of immunofluorescence staining as described in the ""Materials and methods"" section. S-Fab ( D ) and PEG-S-Fab ( E ) on LS174T cells (upper panel) and SKOV3 cells (lower panel), respectively. The scale bar represents 30 mum. AF488, stained by the goat antihuman IgG (H + L)-AlexaFluor 488 antibody; LS174T, human colorectal cell line LS174T; SKOV3, human ovarian cancer cell line SKOV3. Abbreviations: CEA, carcinoembryonic antigen; DAPI, 4',6-diamidino-2-phenylindole; IgG, immunoglobulin G; PEG, polyethylene glycol; PEG-S-Fab, PEGylated S-Fab; S-Fab, single-domain antibody-linked Fab; FITC, fluoresceine isothiocyanate.
- Conjugate
- Yellow dye
- Submitted by
- Invitrogen Antibodies (provider)
- Main image
- Experimental details
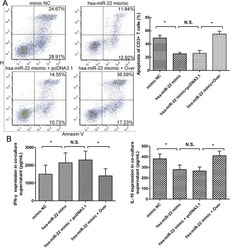
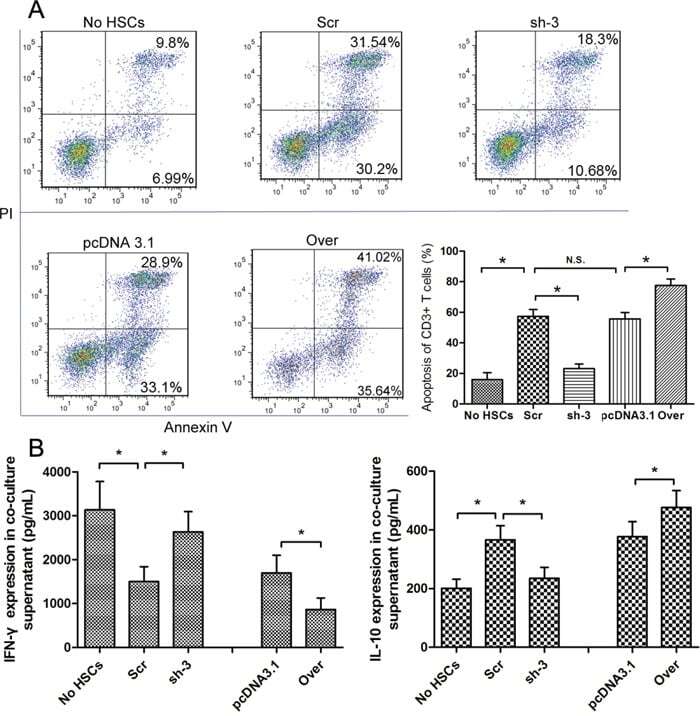
- Figure 4 The expression of galectin-1 in HSCs promotes HSC-induced T cell apoptosis and Th1/Th2 cytokine balance skewing A. Flow cytometry (annexin V-FITC apoptosis detection) analyses to detect T cell apoptosis in CD3+ T cells, cultured alone or co-cultured with HSCs subjected to different pre-treatments (cell transfection for galectin-1 knockdown and overexpression: sh-3 group versus Scr group; Over group versus pcDNA3.1 group) for 48 hours at a ratio of 10:1 (T:HSC), B. ELISA showing the levels of cytokines (IFN-gamma and IL-10) in the supernatant. Data are shown as the means (+- SD) of triplicates (n = 7). *P < 0.05. NC, negative control group; Scr, non-targeting scrambled sequence group; sh, small hairpin RNA sequence transfection group; pcDNA3.1, negative control group; Over, galectin-1 overexpression group; No HSCs, T cells cultured alone.
- Conjugate
- Yellow dye
- Submitted by
- Invitrogen Antibodies (provider)
- Main image

- Experimental details
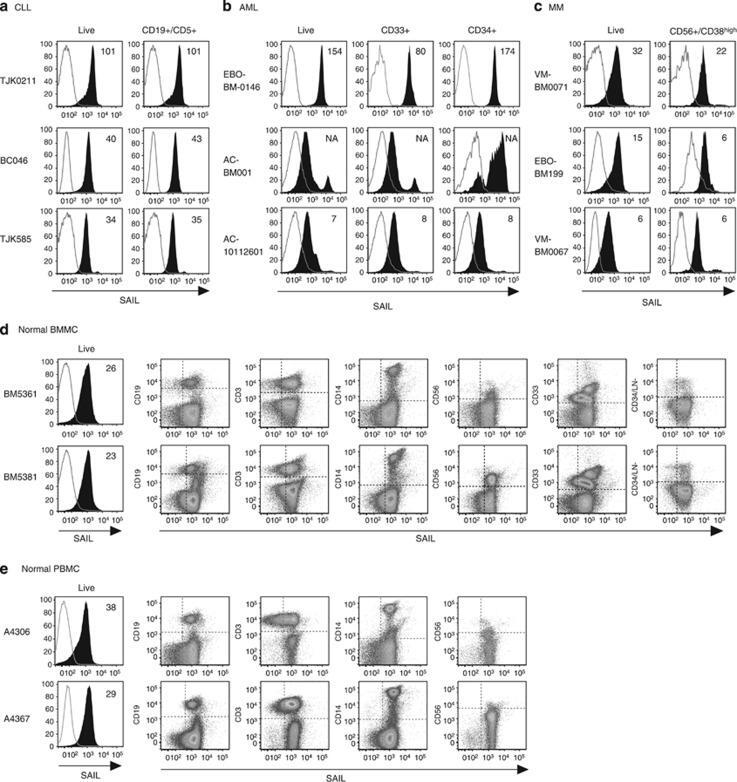
- Figure 2 Cell surface expression of SAIL in CLL, AML and MM patient samples and normal BMMC and PBMC controls. ( a ) Three CLL specimens analyzed by flow cytometry. CLL cells were identified as CD19/CD5 double-positive cells. The histograms present SAIL (filled) and isotype control (open) staining in the live-cell and the CLL population. ( b ) Flow cytometry analysis of three AML specimens. SAIL expression is assessed in live-cells, CD33-positive and CD34-positive cells. ( c ) Flow cytometry analysis of three MM specimens. CD38 high cells with CD56 expression were gated for MM cells. SAIL expression is assessed in the live-cell and the MM population. ( d and e ) Flow cytometry analysis of SAIL expression in BMMC ( d ) and PBMC ( e ) via co-staining with CD19, CD3, CD14, CD56, CD33, CD34 and a cocktail of lineage (LN) markers. Numbers in histograms are median-fluorescence-intensity fold-change values relative to the isotype control. Three and two representative examples are shown for the tumor and normal samples, respectively.
- Conjugate
- Yellow dye
- Submitted by
- Invitrogen Antibodies (provider)
- Main image
- Experimental details
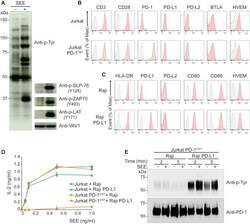
- Figure 3 Outcome of PD-1-PD-L1 Engagement at T Cell-APC Interface (A) Jurkat-PD-1 OST cells were stimulated with Raji cells that have been preincubated in the absence (-) or presence (+) of 200 ng/mL SEE and lysed 2 min after the initiation of cell-cell contact. Immunoblot analysis of equal amounts of lysates from the specified conditions probed with antibody to phosphorylated proteins (Anti-p-Tyr) or with phospho-tyrosine-specific antibodies directed against SLP76 pY128, ZAP70 pY493, LAT pY171 or VAV1 (loading control). Left margin, molecular size in kilodaltons (kDa). Data are representative of three independent experiments. (B) Expression of CD3, CD28, PD-1, PD-L1, PD-L2, BTLA, and HVEM at the surface of Jurkat cells and Jurkat-PD-1 OST cells, analyzed using flow cytometry. (C) Expression of HLA-DR, PD-L1, PD-L2, CD80, CD86, and HVEM at the surface of Raji cells and Raji-PD-L1 cells, analyzed using flow cytometry. In (B) and (C), gray shaded curves correspond to isotype-matched control antibody (negative control), and data are representative of two independent experiments. (D) IL-2 production by Jurkat and Jurkat-PD-1 OST cells stimulated for 24 h with either Raji or Raji-PD-L1 cells in the absence (0) or presence of the specified amounts of SEE. Data are representative of three independent experiments, and mean and SEM are shown. (E) Jurkat-PD-1 OST cells stimulated at 37degC with Raji or Raji-PD-L1 cells preincubated in the absence (-) or presence (+) of 200 ng/mL SEE an
- Conjugate
- Yellow dye
- Submitted by
- Invitrogen Antibodies (provider)
- Main image
- Experimental details
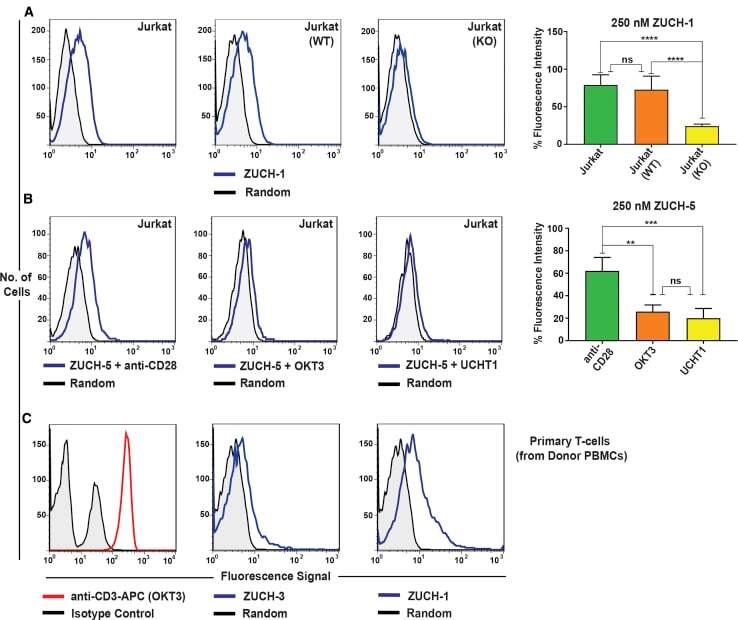
- Figure 6 Characterization of Aptamer Specificity against TCR-CD3epsilon (A) Flow-cytometric analyses of binding of the highest affinity aptamer, ZUCH-1, against Jurkat.E6 cells used in SELEX (left), against wild-type Jurkat cells used for generating CRISPR knockout cell lines (middle), against CRISPR double-knockout Jurkat cells (right), and the overall conclusion from six independent specificity analyses (far right). Aptamer ZUCH-1 does not bind to knockout cells, thereby demonstrating epitope specificity (ordinary one-way ANOVA, using Tukey''s multiple comparisons test performed on GraphPad Prism to obtain statistical significance: ****p
- Conjugate
- Yellow dye
- Submitted by
- Invitrogen Antibodies (provider)
- Main image
- Experimental details
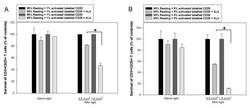
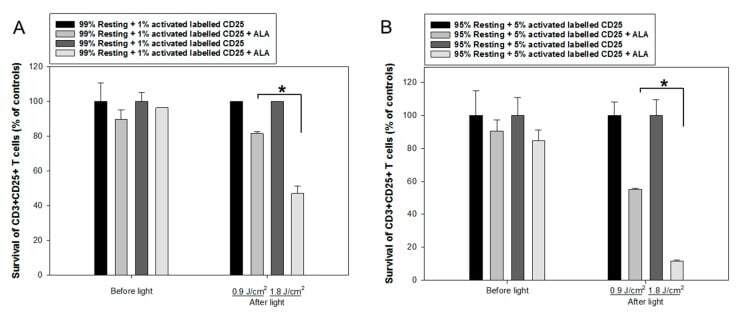
- Figure 7 ALA-PDT of mixed populations of resting and activated cells. Healthy donor PBMCs were activated in vitro with anti-CD3/CD28 antibodies for three days. The activated T cells were then labeled with anti-human CD25-FITC antibody. The resting and CD25-FITC labeled activated T cells were mixed in certain ratios as indicated. The mixed cells were incubated with 3 mM ALA for 1 h at 37 degC and then irradiated with the LED blue light at 0.9 J/cm 2 or 1.8 J/cm 2 . The cell survivals were measured 2 h after light irradiation with flow cytometry as described in Figure 3 . The control samples without light are also included. ( A ) Mixture of 1% CD25-FITC labelled activated T cells with 99% resting PBMCs. ( B ) Mixture of 5% CD25-FITC labelled activated T cells with 95% resting PBMCs. * p < 0.05.
- Conjugate
- Yellow dye
- Submitted by
- Invitrogen Antibodies (provider)
- Main image
- Experimental details
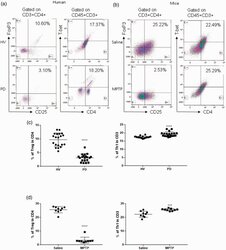
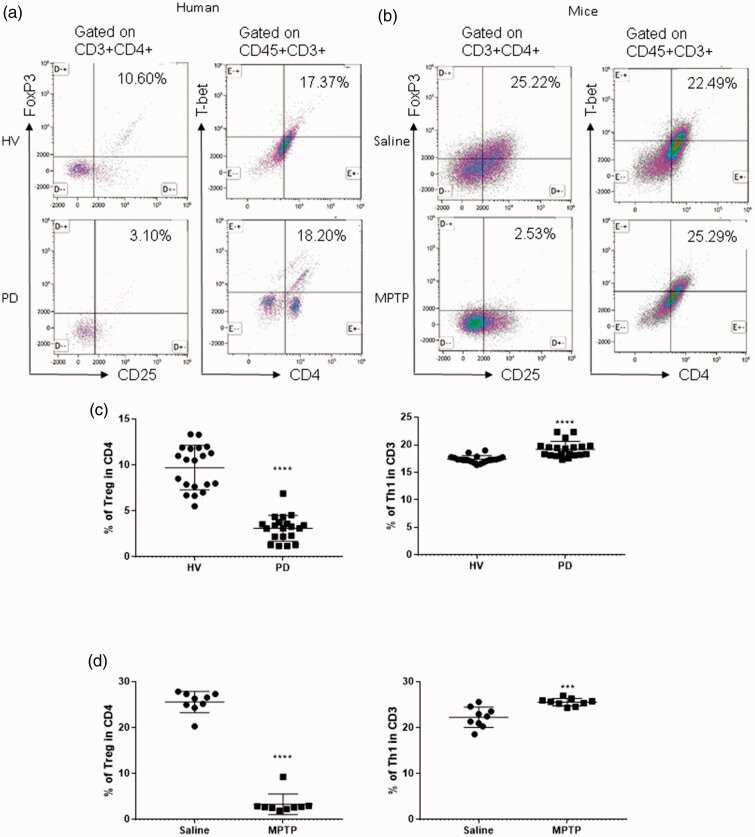
- Figure 1. Patients with Parkinson's disease (PD) and mice with experimental PD exhibit decreased regulatory T (Treg) and increased T helper 1 (Th1) cell numbers in the blood. Treg cells were defined as CD3+CD4+CD25+FoxP3+ cells, whereas Th1 cells were identified as CD3+CD4+T-bet+ cells. (a) Representative plots of Treg and Th1 cells in patients with PD and healthy volunteers (HVs). (b) Representative plots of Treg and Th1 cells in control mice (Saline) and 1-methyl-4-phenyl-1,2,3,6-tetrahydropyridine (MPTP)-treated mice. (c) Patients with PD exhibited lower Treg cell levels and greater Th1 cell levels in the blood than HVs. n = 20. ****, p < 0.0001 by a two-tailed Student's t tests. (d) MPTP-induced experimental PD mice had fewer Treg and more Th1 cells in the circulation than saline-treated mice. n = 9/group in each experiment performed in triplicate. ***, p < 0.001; ****, p < 0.0001, according to Student's t test.
- Conjugate
- Yellow dye
- Submitted by
- Invitrogen Antibodies (provider)
- Main image
- Experimental details
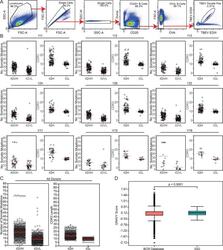
- Figure S2. Sorting strategy and antibody sequence analysis. (A) Sorting strategy. Forward and side scatter (FSC and SSC, respectively) were used to gate on single lymphocytes. Dump channel included CD3, CD8, CD14, CD16, and a viability dye. CD20 + B cells that failed to bind OVA (OVA - ) but did bind to the TBEV EDIII bait coupled with both PE and AF647 fluorophores were purified. (B) For each donor, the number of V gene somatic nucleotide mutations is shown on the left and the amino acid length of the CDR3 is shown on the right. (C) As in B, but for all donors combined. For B and C, horizontal red lines indicate the mean. (D) Distribution of hydrophobicity GRAVY scores at the IGH CDR3 of antibodies from all donors combined and compared with human repertoire (). P < 0.0001 was determined using the Wilcoxon nonparametric test. Related to Fig. 2 , Table S2 , and Table S3 .
- Conjugate
- Yellow dye
- Submitted by
- Invitrogen Antibodies (provider)
- Main image
- Experimental details
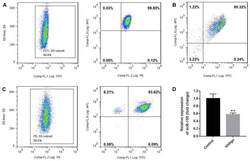
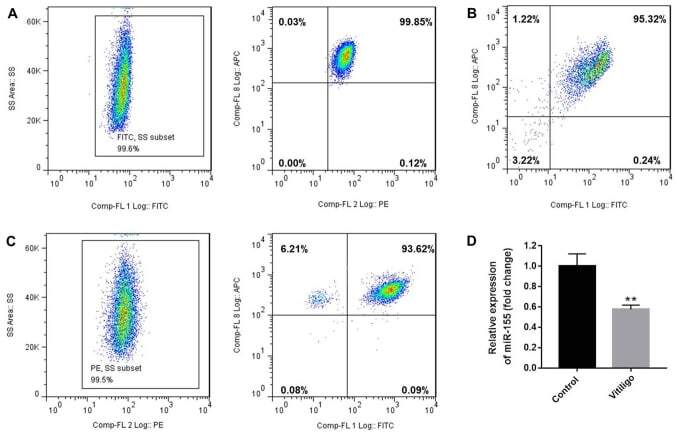
- Figure 1. Purity of CD3 + CD4 + CD45RA + T cells, CD3 + CD8 + T cells and CD4 + CD25 + FoxP3 + Treg cells. CD3 + CD4 + CD45RA + T cells and CD3 + CD8 + T cells were purified by magnetic cell sorting, and their purity was determined by flow cytometry. (A) The purity of CD3 + CD4 + CD45RA + T cells was 99.45% (CD3 + T cells, 99.6%; CD4 + CD45RA + T cells, 99.85%). (B) The purity of CD3 + CD8 + T cells was 95.32%. (C) The purity of CD4 + CD25 + FoxP3 + Treg cells was 93.15% (CD4 + T cells, 99.5%; CD25 + FoxP3 + T cells, 93.62%). (D) miR-155 expression in T cells of the patients with vitiligo and healthy donor was detected by reverse transcription quantitative polymerase chain reaction. **P
- Conjugate
- Yellow dye
- Submitted by
- Invitrogen Antibodies (provider)
- Main image
- Experimental details
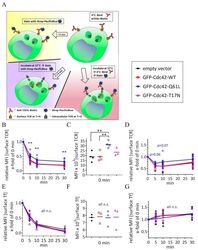
- Figure 4 Expression of Cdc42-Q61L selectively impairs internalization of the TCR-CD3 complex. ( A ) Schematic of the flow-cytometry based internalization assay; cells are labelled at 4 degC with a functional biotinylated anti-CD3epsilon and either (yellow) directly stained with Pacific Blue-streptavidin to measure surface expression of TCR-CD3 complex in resting cells, (blue) activated by incubation at 37 degC and stained with Pacific Blue-streptavidin to detect remaining TCR-CD3 at the cell surface after activation-induced internalization, or (red) activated by incubation at 37 degC, re-labelled with biotinylated anti-CD3epsilon and stained with Pacific Blue-streptavidin to detect total surface TCR-CD3 in activated cells. ( B ) Remaining TCR-CD3 at the cell surface detected by an antibody against CD3epsilon (clone OKT3) after activation-induced internalization in cells expressing an empty vector, GFP-WT-Cdc42, GFP-Cdc42-Q61L, or GFP-Cdc42-T17N. ( C ) Surface expression of TCR-CD3 complex in cells expressing the same constructs as in ( B ). ( D ) Total surface TCR-CD3 in activated cells transfected as in ( B ). ( E ) Internalization of biotinylated Tf detected with Pacific Blue-streptavidin after incubation at 37 degC as described for anti-CD3epsilon in ( A ), in cells activated by soluble anti-CD3epsilon and expressing the same constructs as in ( B ). ( F ) Surface expression of Tf in cells expressing the same constructs as in ( B ). ( G ) Total Tf at the cell surface detect
- Conjugate
- Yellow dye

- Submitted by
- Invitrogen Antibodies (provider)
- Main image
- Experimental details
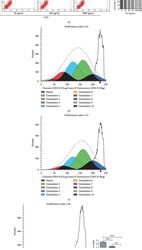
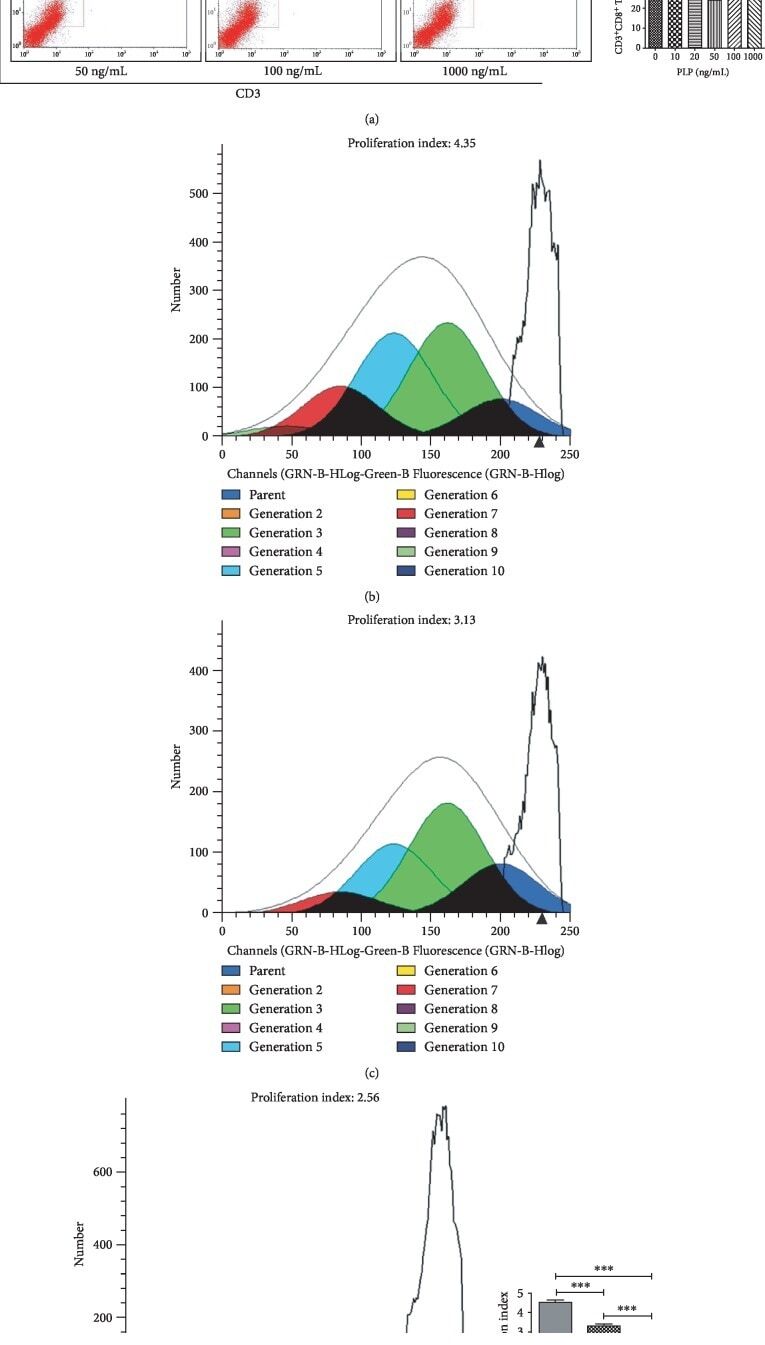
- Figure 3 Flow cytometric analysis of the proportion and proliferation ability of CD3 + CD8 + T lymphocytes. (a) Proportion of CD3 + CD8 + T lymphocytes. (b) Blank group. (c) Control group, lymphocytes cocultured with A-MSCs stimulated at 0 ng/mL PLP. (d) Treated group, lymphocytes cocultured with A-MSCs stimulated at 50 ng/mL PLP.
- Conjugate
- Yellow dye
- Submitted by
- Invitrogen Antibodies (provider)
- Main image
- Experimental details
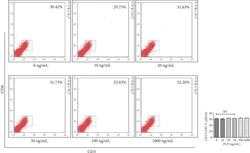
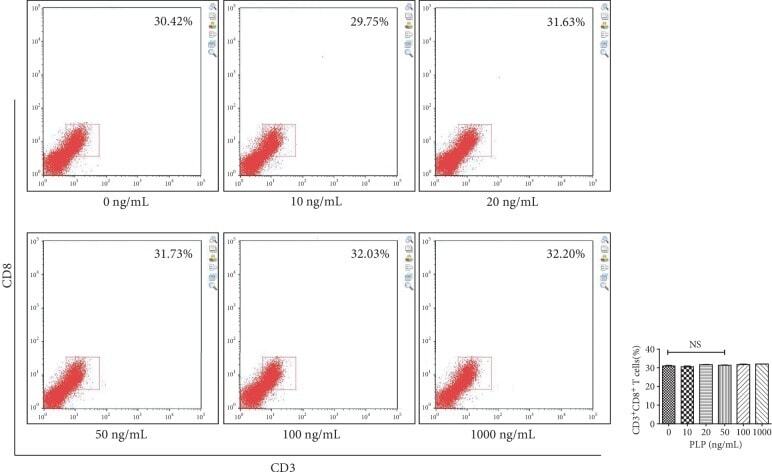
- Figure 13 Flow cytometric analysis of the proportion of CD3 + CD8 + T lymphocytes after A-MSCs coculture with TLR3 and TLR4 inhibition. There was no significant difference in the proportion of CD3 + CD8 + T lymphocytes between concentrations.
- Conjugate
- Yellow dye
- Submitted by
- Invitrogen Antibodies (provider)
- Main image
- Experimental details
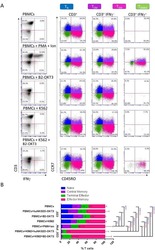
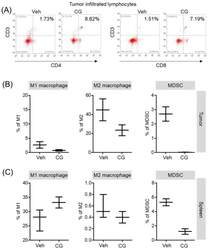
- Figure 6 The proportion of MDSCs and M1/M2 macrophage were changed by CG-745 treatment in Hepa1-6 syngeneic mouse model: (A-C) Hepa1-6 inoculated C57BL/6 mice were treated with vehicle or 15 mg/kg/day of CG (CG-745) by intraperitoneally for 5 days/week for 3 weeks. Tumor (A, B) and spleen (C) were harvested from each individual mouse. Cells were stained with fluorescence-conjugated antibodies specific to CD3, CD4, CD8, CD25 and Foxp3, and subjected to flow cytometry analysis. The graph shows means with error bars. Error bars represent standard deviations for 3 samples in each group. Results are representative of three separate experiments (A). p < 0.05.
- Conjugate
- Yellow dye
- Submitted by
- Invitrogen Antibodies (provider)
- Main image
- Experimental details
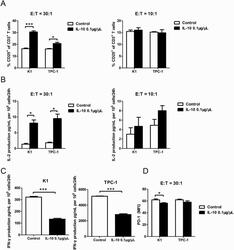
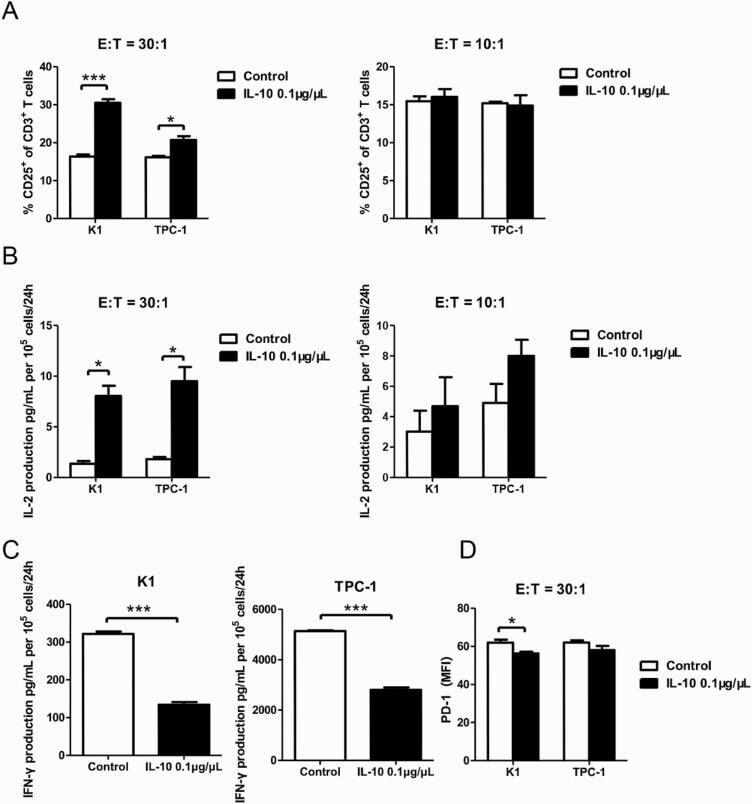
- Figure 4. IL-10 promotes T-cell activation in cocultures of CD3 + CD8 + CD25 + T cells and PTC cell lines. ( A ) Flow cytometry results of the CD25 + fraction of CD3 + T cells in coculture systems containing activated CD3 + CD8 + CD25 + T lymphocytes (effector cells, E) and pretreated PTC cells (K-1 and TPC-1 treated with 0.1 mug/muL of IL-10 for 24 hours; target cells, T) at various E:T ratios (30:1 and 10:1) (* P < 0.05, *** P < 0.001). ( B ) IL-2 production in coculture systems (details described above) measured by ELISA (* P < 0.05). ( C ) IFN-gamma production in coculture systems of CD3 + CD8 + CD25 + T lymphocytes and IL-10-stimulated PTC cells (K-1 and TPC-1) at a 30:1 ratio (*** P < 0.001). ( D ) Mean fluorescence intensity (MFI) of PD-1 expression in coculture systems of activated CD3 + CD8 + CD25 + T lymphocytes and IL-10 pretreated PTC cells at a 30:1 ratio (* P < 0.05). All tests were conducted in triplicate. ELISA, enzyme-linked immunosorbent assay; H, hours; IFN, interferon; IL, interleukin; PD-1, programmed death-1; PTC, papillary thyroid cancer.
- Conjugate
- Yellow dye
- Submitted by
- Invitrogen Antibodies (provider)
- Main image
- Experimental details
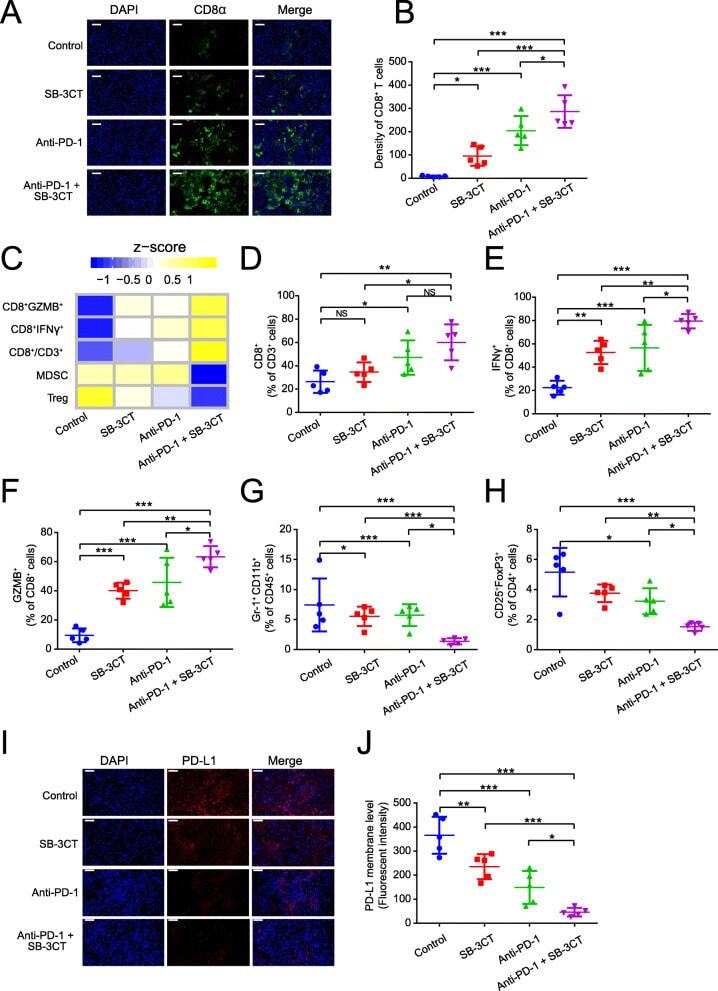
- Fig. 3 Immune features in tumors for B16F10 xenograft mouse model with SB-3CT treatment. a Fluorescence expression and b quantification of CD8 + T cells. c Heatmap of Z -score normalized percentage of immune cell populations ( d - h ) in TILs for B16F10 tumor-bearing mice treated with anti-PD-1 and SB-3CT in combination or alone. d - h In the implanted B16F10 tumors from mice treated with or without SB-3CT and PD-1 blockade, fluorescence-activated cell sorting (FACS) was used to measure d CD8 + in CD3 + T cells, e CD8 + IFNgamma + in CD8 + T cells, f CD8 + GZMB + in CD8 + T cells, g Gr-1 + CD11b + MDSCs in CD45 + cells, and h CD25 + FOXP3 + Treg in CD4 + cells. i Fluorescence expression and j quantification of PD-L1 in B16F10 tumor-bearing wild-type C57/BL6 mice treated with isotype, SB-3CT, anti-PD-1, or combination strategy. Sample size is 5 in each cohort. Scale bars, 50 mum. Results are mean +- s.d. ns, p > 0.05,* p < 0.05, ** p < 0.01, and *** p < 0.001, as determined by one-way ANOVA and Dunnett's multiple comparison test
- Conjugate
- Yellow dye