Explore
 Validate
 Learn
Learn Flow cytometry
Antibody data
- Antibody Data
- Antigen structure
- References [41]
- Comments [0]
- Validations
- Flow cytometry [2]
- Other assay [34]
Submit
Validation data
Reference
Comment
Report error
- Product number
- 12-0038-41 - Provider product page

- Provider
- Invitrogen Antibodies
- Product name
- CD3 Monoclonal Antibody (UCHT1), PE, eBioscience™
- Antibody type
- Monoclonal
- Antigen
- Other
- Description
- Description: The UCHT1 monoclonal antibody reacts with human CD3e, a 20 kDa subunit of the TCR complex. Along with the other CD3 subunits gamma and delta, the epsilon chain is required for proper assembly, trafficking and surface expression of the TCR complex. CD3 is expressed by thymocytes in a developmentally regulated manner and by all mature T cells. Crosslinking of TCR via immobilized UCHT1 initiates an intracellular biochemical pathway resulting in cellular activation and proliferation. Applications Reported: The UCHT1 antibody has been reported for use in flow cytometric analysis. Applications Tested: The UCHT1 antibody has been pre-titrated and tested by flow cytometric analysis of normal human peripheral blood cells. This can be used at 5 µL (0.06 µg) per test. A test is defined as the amount (µg) of antibody that will stain a cell sample in a final volume of 100 µL. Cell number should be determined empirically but can range from 10^5 to 10^8 cells/test. Excitation: 488-561 nm; Emission: 578 nm; Laser: Blue Laser, Green Laser, Yellow-Green Laser. Filtration: 0.2 µm post-manufacturing filtered.
- Reactivity
- Human
- Host
- Mouse
- Conjugate
- Yellow dye
- Isotype
- IgG
- Antibody clone number
- UCHT1
- Vial size
- 25 Tests
- Concentration
- 5 µL/Test
- Storage
- 4° C, store in dark, DO NOT FREEZE!
Submitted references Nanobody-derived bispecific CAR-T cell therapy enhances the anti-tumor efficacy of T cell lymphoma treatment.
Myeloid-intrinsic cell cycle-related kinase drives immunosuppression to promote tumorigenesis.
WT1 Pulsed Human CD141+ Dendritic Cell Vaccine Has High Potential in Solid Tumor-Targeted Immunotherapy.
Bispecific T-Cell Engaging Antibodies Against MUC16 Demonstrate Efficacy Against Ovarian Cancer in Monotherapy and in Combination With PD-1 and VEGF Inhibition.
Mitochondrial Functions Are Compromised in CD4 T Cells From ART-Controlled PLHIV.
Aberrant gut-microbiota-immune-brain axis development in premature neonates with brain damage.
Single-cell RNA sequencing reveals ex vivo signatures of SARS-CoV-2-reactive T cells through 'reverse phenotyping'.
Dendritic Cell Maturation Regulates TSPAN7 Function in HIV-1 Transfer to CD4(+) T Lymphocytes.
Single-cell transcriptomics reveals regulators underlying immune cell diversity and immune subtypes associated with prognosis in nasopharyngeal carcinoma.
Aging affects responsiveness of peripheral blood mononuclear cells to immunosuppression of periodontal ligament stem cells.
Involvement of natural killer cells in the pathogenesis of endometriosis in patients with pelvic pain.
Selective Killing of Activated T Cells by 5-Aminolevulinic Acid Mediated Photodynamic Effect: Potential Improvement of Extracorporeal Photopheresis.
Th2-like T Follicular Helper Cells Promote Functional Antibody Production during Plasmodium falciparum Infection.
Skewed T cell responses to Epstein-Barr virus in long-term asymptomatic kidney transplant recipients.
Inflammation induced by incomplete radiofrequency ablation accelerates tumor progression and hinders PD-1 immunotherapy.
Loss of ARPC1B impairs cytotoxic T lymphocyte maintenance and cytolytic activity.
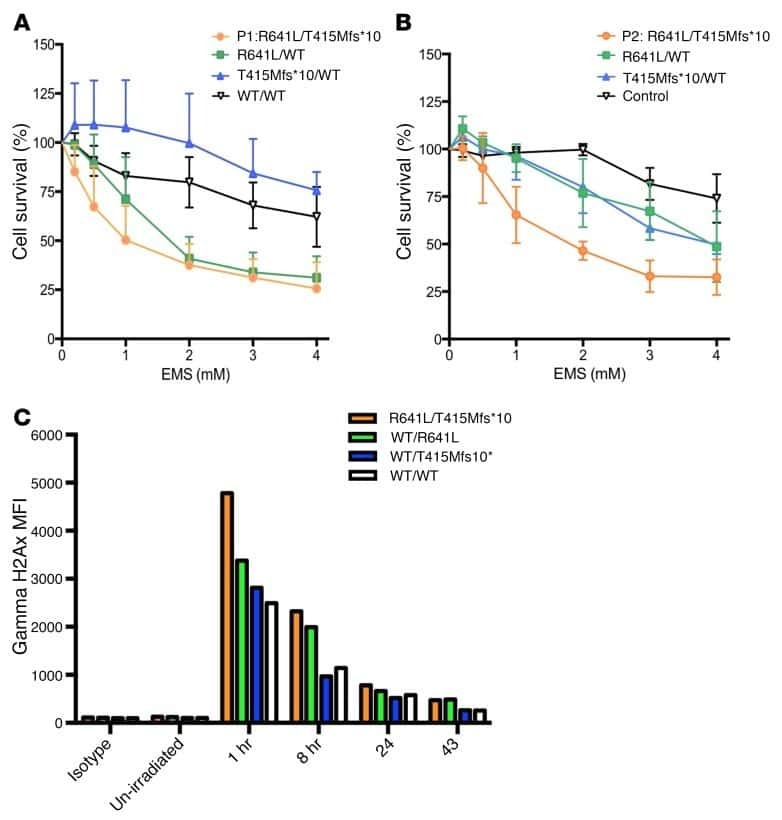
Biallelic mutations in DNA ligase 1 underlie a spectrum of immune deficiencies.
Antigen receptor-redirected T cells derived from hematopoietic precursor cells lack expression of the endogenous TCR/CD3 receptor and exhibit specific antitumor capacities.
Follicular Regulatory T Cells Are Highly Permissive to R5-Tropic HIV-1.
Guidelines for the use of flow cytometry and cell sorting in immunological studies.
A Safety Checkpoint to Eliminate Cancer Risk of the Immune Evasive Cells Derived from Human Embryonic Stem Cells.
Blocking the recruitment of naive CD4(+) T cells reverses immunosuppression in breast cancer.
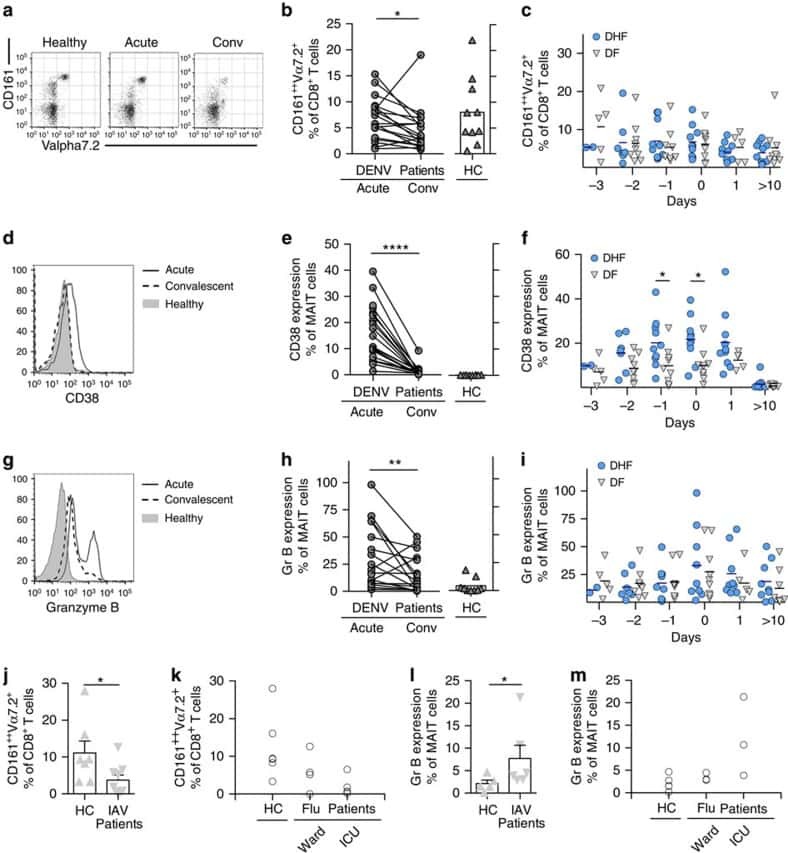
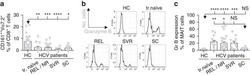
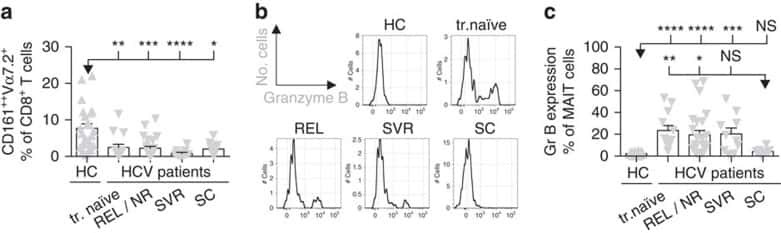
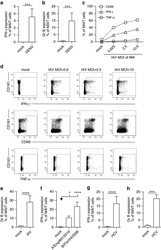
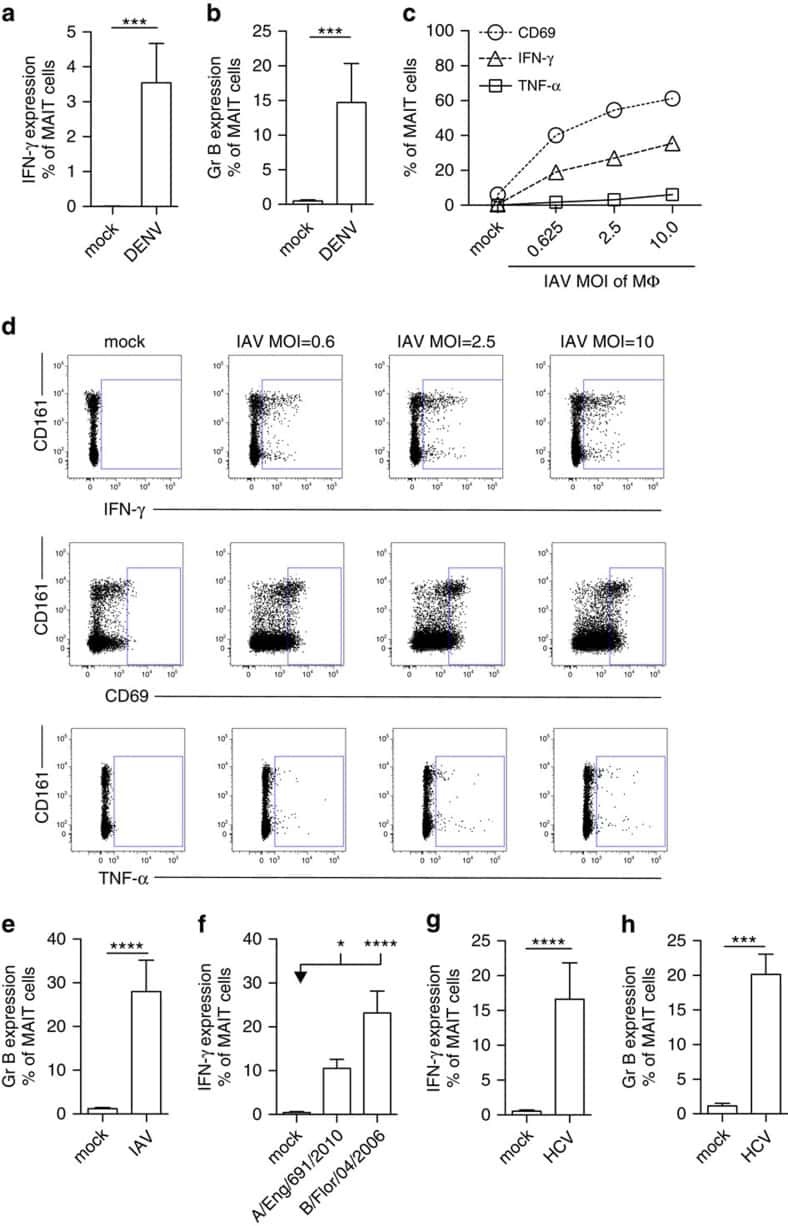
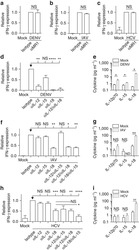
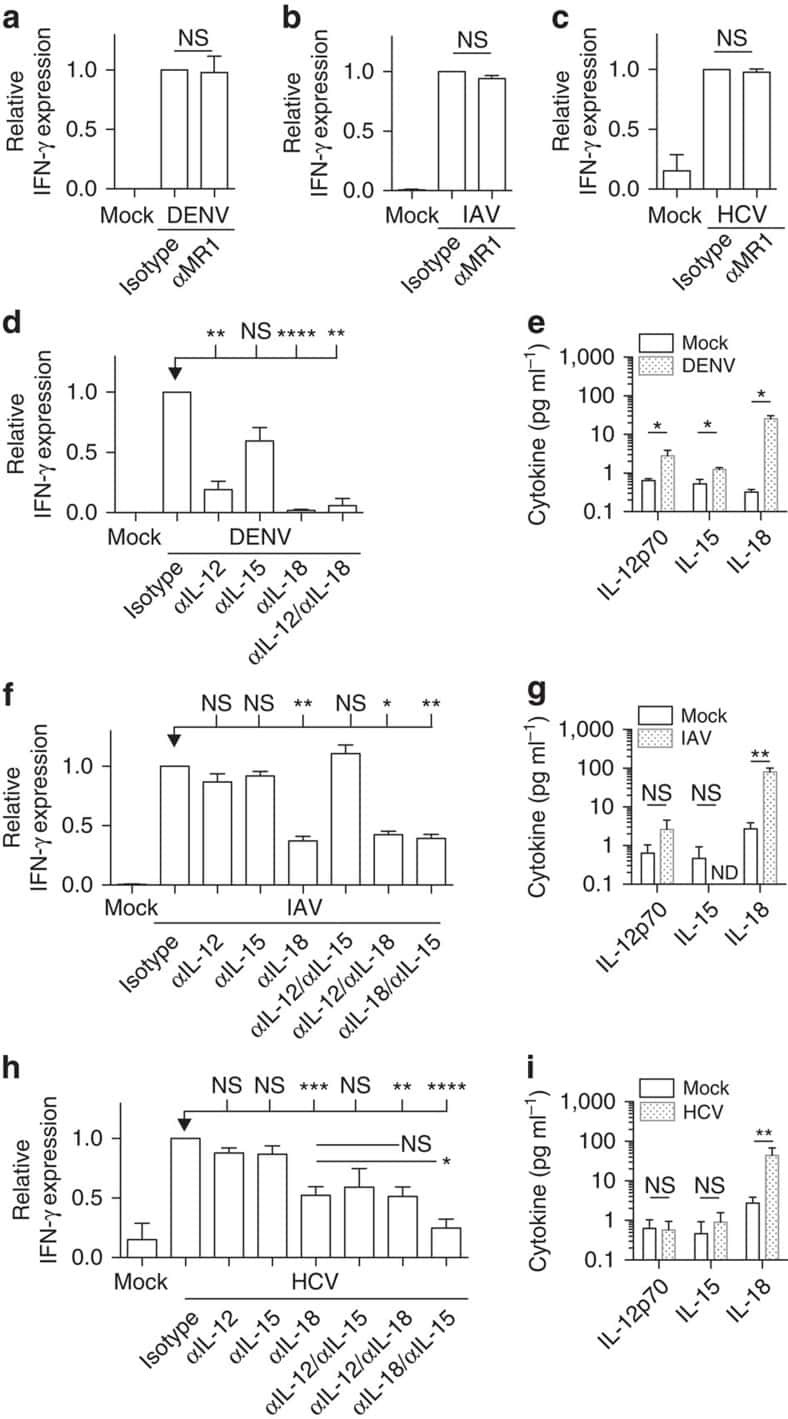
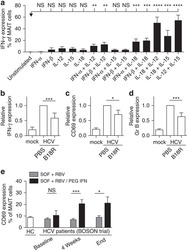
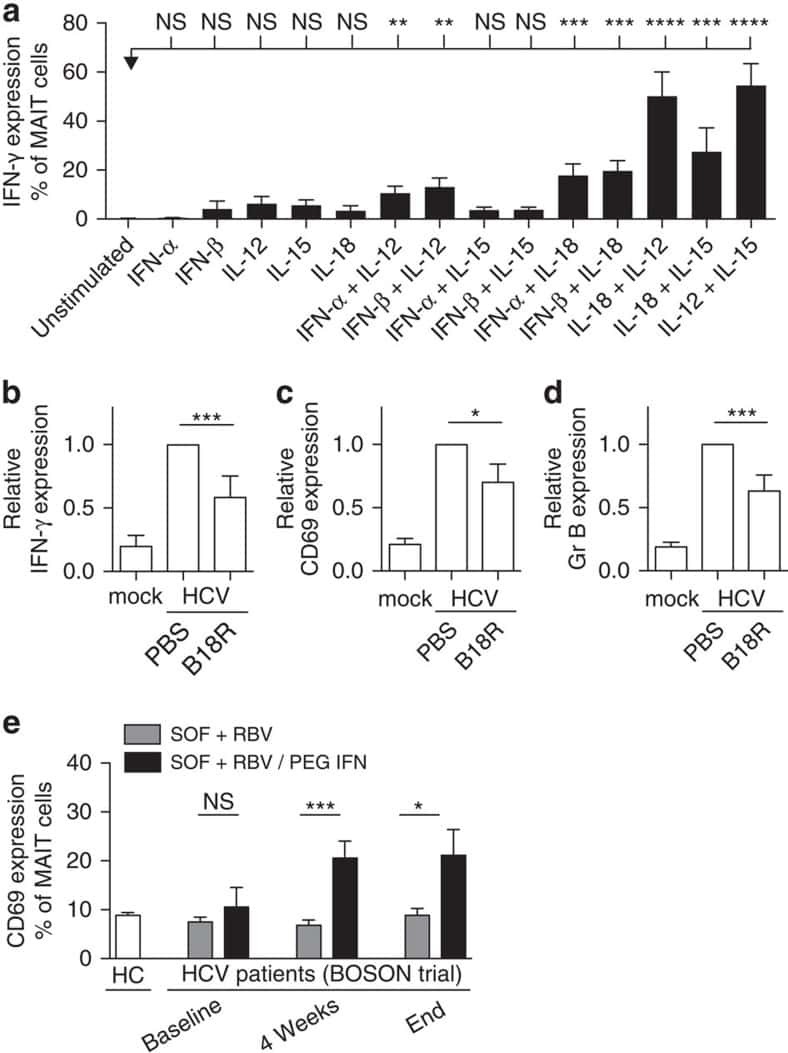
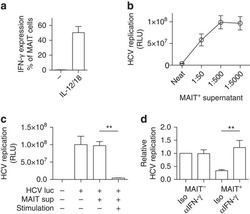
MAIT cells are activated during human viral infections.
Interaction among activated lymphocytes and mesenchymal cells through podoplanin is critical for a high IL-17 secretion.
Antibodies to P-selectin glycoprotein ligand-1 block dendritic cell-mediated enterovirus 71 transmission and prevent virus-induced cells death.
Regulatory Dendritic Cells Restrain NK Cell IFN-γ Production through Mechanisms Involving NKp46, IL-10, and MHC Class I-Specific Inhibitory Receptors.
Follicular regulatory T cells impair follicular T helper cells in HIV and SIV infection.
Oncogenic Transformation Can Orchestrate Immune Evasion and Inflammation in Human Mesenchymal Stem Cells Independently of Extrinsic Immune-Selective Pressure.
Induction of type I and type III interferons by Borrelia burgdorferi correlates with pathogenesis and requires linear plasmid 36.
Depressive symptoms post hip fracture in older adults are associated with phenotypic and functional alterations in T cells.
Novel lentiviral vectors with mutated reverse transcriptase for mRNA delivery of TALE nucleases.
A comparison of DNA methylation specific droplet digital PCR (ddPCR) and real time qPCR with flow cytometry in characterizing human T cells in peripheral blood.
Human mesenchymal stromal cells modulate T-cell responses through TNF-α-mediated activation of NF-κB.
Trypan blue exclusion assay by flow cytometry.
MHC multimer-guided and cell culture-independent isolation of functional T cell receptors from single cells facilitates TCR identification for immunotherapy.
Recombinant influenza virus carrying the respiratory syncytial virus (RSV) F85-93 CTL epitope reduces RSV replication in mice.
Epigenetic biomarkers of T-cells in human glioma.
Penicillium marneffei-stimulated dendritic cells enhance HIV-1 trans-infection and promote viral infection by activating primary CD4+ T cells.
Replication of Epstein-Barr virus primary infection in human tonsil tissue explants.
The effects of trastuzumab on the CD4+CD25+FoxP3+ and CD4+IL17A+ T-cell axis in patients with breast cancer.
An antibody against the surfactant protein A (SP-A)-binding domain of the SP-A receptor inhibits T cell-mediated immune responses to Mycobacterium tuberculosis.
Xia B, Lin K, Wang X, Chen F, Zhou M, Li Y, Lin Y, Qiao Y, Li R, Zhang W, He X, Zou F, Li L, Lu L, Chen C, Li W, Zhang H, Liu B
Molecular therapy oncolytics 2023 Sep 21;30:86-102
Molecular therapy oncolytics 2023 Sep 21;30:86-102
Myeloid-intrinsic cell cycle-related kinase drives immunosuppression to promote tumorigenesis.
Zhou J, Wang H, Shu T, Wang J, Yang W, Li J, Ding L, Liu M, Sun H, Wong J, Lai PB, Tsang SW, Ward SE, Chow KL, Sung JJ, Sze-Lok Cheng A
iScience 2023 Oct 20;26(10):107626
iScience 2023 Oct 20;26(10):107626
WT1 Pulsed Human CD141+ Dendritic Cell Vaccine Has High Potential in Solid Tumor-Targeted Immunotherapy.
Cho SY, Jeong SM, Jeon YJ, Yang SJ, Hwang JE, Yoo BM, Kim HS
International journal of molecular sciences 2023 Jan 12;24(2)
International journal of molecular sciences 2023 Jan 12;24(2)
Bispecific T-Cell Engaging Antibodies Against MUC16 Demonstrate Efficacy Against Ovarian Cancer in Monotherapy and in Combination With PD-1 and VEGF Inhibition.
Yeku OO, Rao TD, Laster I, Kononenko A, Purdon TJ, Wang P, Cui Z, Liu H, Brentjens RJ, Spriggs D
Frontiers in immunology 2021;12:663379
Frontiers in immunology 2021;12:663379
Mitochondrial Functions Are Compromised in CD4 T Cells From ART-Controlled PLHIV.
Zhao J, Schank M, Wang L, Li Z, Nguyen LN, Dang X, Cao D, Khanal S, Nguyen LNT, Thakuri BKC, Ogbu SC, Lu Z, Wu XY, Morrison ZD, Gazzar ME, Liu Y, Zhang J, Ning S, Moorman JP, Yao ZQ
Frontiers in immunology 2021;12:658420
Frontiers in immunology 2021;12:658420
Aberrant gut-microbiota-immune-brain axis development in premature neonates with brain damage.
Seki D, Mayer M, Hausmann B, Pjevac P, Giordano V, Goeral K, Unterasinger L, Klebermaß-Schrehof K, De Paepe K, Van de Wiele T, Spittler A, Kasprian G, Warth B, Berger A, Berry D, Wisgrill L
Cell host & microbe 2021 Oct 13;29(10):1558-1572.e6
Cell host & microbe 2021 Oct 13;29(10):1558-1572.e6
Single-cell RNA sequencing reveals ex vivo signatures of SARS-CoV-2-reactive T cells through 'reverse phenotyping'.
Fischer DS, Ansari M, Wagner KI, Jarosch S, Huang Y, Mayr CH, Strunz M, Lang NJ, D'Ippolito E, Hammel M, Mateyka L, Weber S, Wolff LS, Witter K, Fernandez IE, Leuschner G, Milger K, Frankenberger M, Nowak L, Heinig-Menhard K, Koch I, Stoleriu MG, Hilgendorff A, Behr J, Pichlmair A, Schubert B, Theis FJ, Busch DH, Schiller HB, Schober K
Nature communications 2021 Jul 26;12(1):4515
Nature communications 2021 Jul 26;12(1):4515
Dendritic Cell Maturation Regulates TSPAN7 Function in HIV-1 Transfer to CD4(+) T Lymphocytes.
Perot BP, García-Paredes V, Luka M, Ménager MM
Frontiers in cellular and infection microbiology 2020;10:70
Frontiers in cellular and infection microbiology 2020;10:70
Single-cell transcriptomics reveals regulators underlying immune cell diversity and immune subtypes associated with prognosis in nasopharyngeal carcinoma.
Chen YP, Yin JH, Li WF, Li HJ, Chen DP, Zhang CJ, Lv JW, Wang YQ, Li XM, Li JY, Zhang PP, Li YQ, He QM, Yang XJ, Lei Y, Tang LL, Zhou GQ, Mao YP, Wei C, Xiong KX, Zhang HB, Zhu SD, Hou Y, Sun Y, Dean M, Amit I, Wu K, Kuang DM, Li GB, Liu N, Ma J
Cell research 2020 Nov;30(11):1024-1042
Cell research 2020 Nov;30(11):1024-1042
Aging affects responsiveness of peripheral blood mononuclear cells to immunosuppression of periodontal ligament stem cells.
Li X, Zhang B, Wang H, Zhao X, Zhang Z, Ding G, Wei F
The Journal of international medical research 2020 Jul;48(7):300060520930853
The Journal of international medical research 2020 Jul;48(7):300060520930853
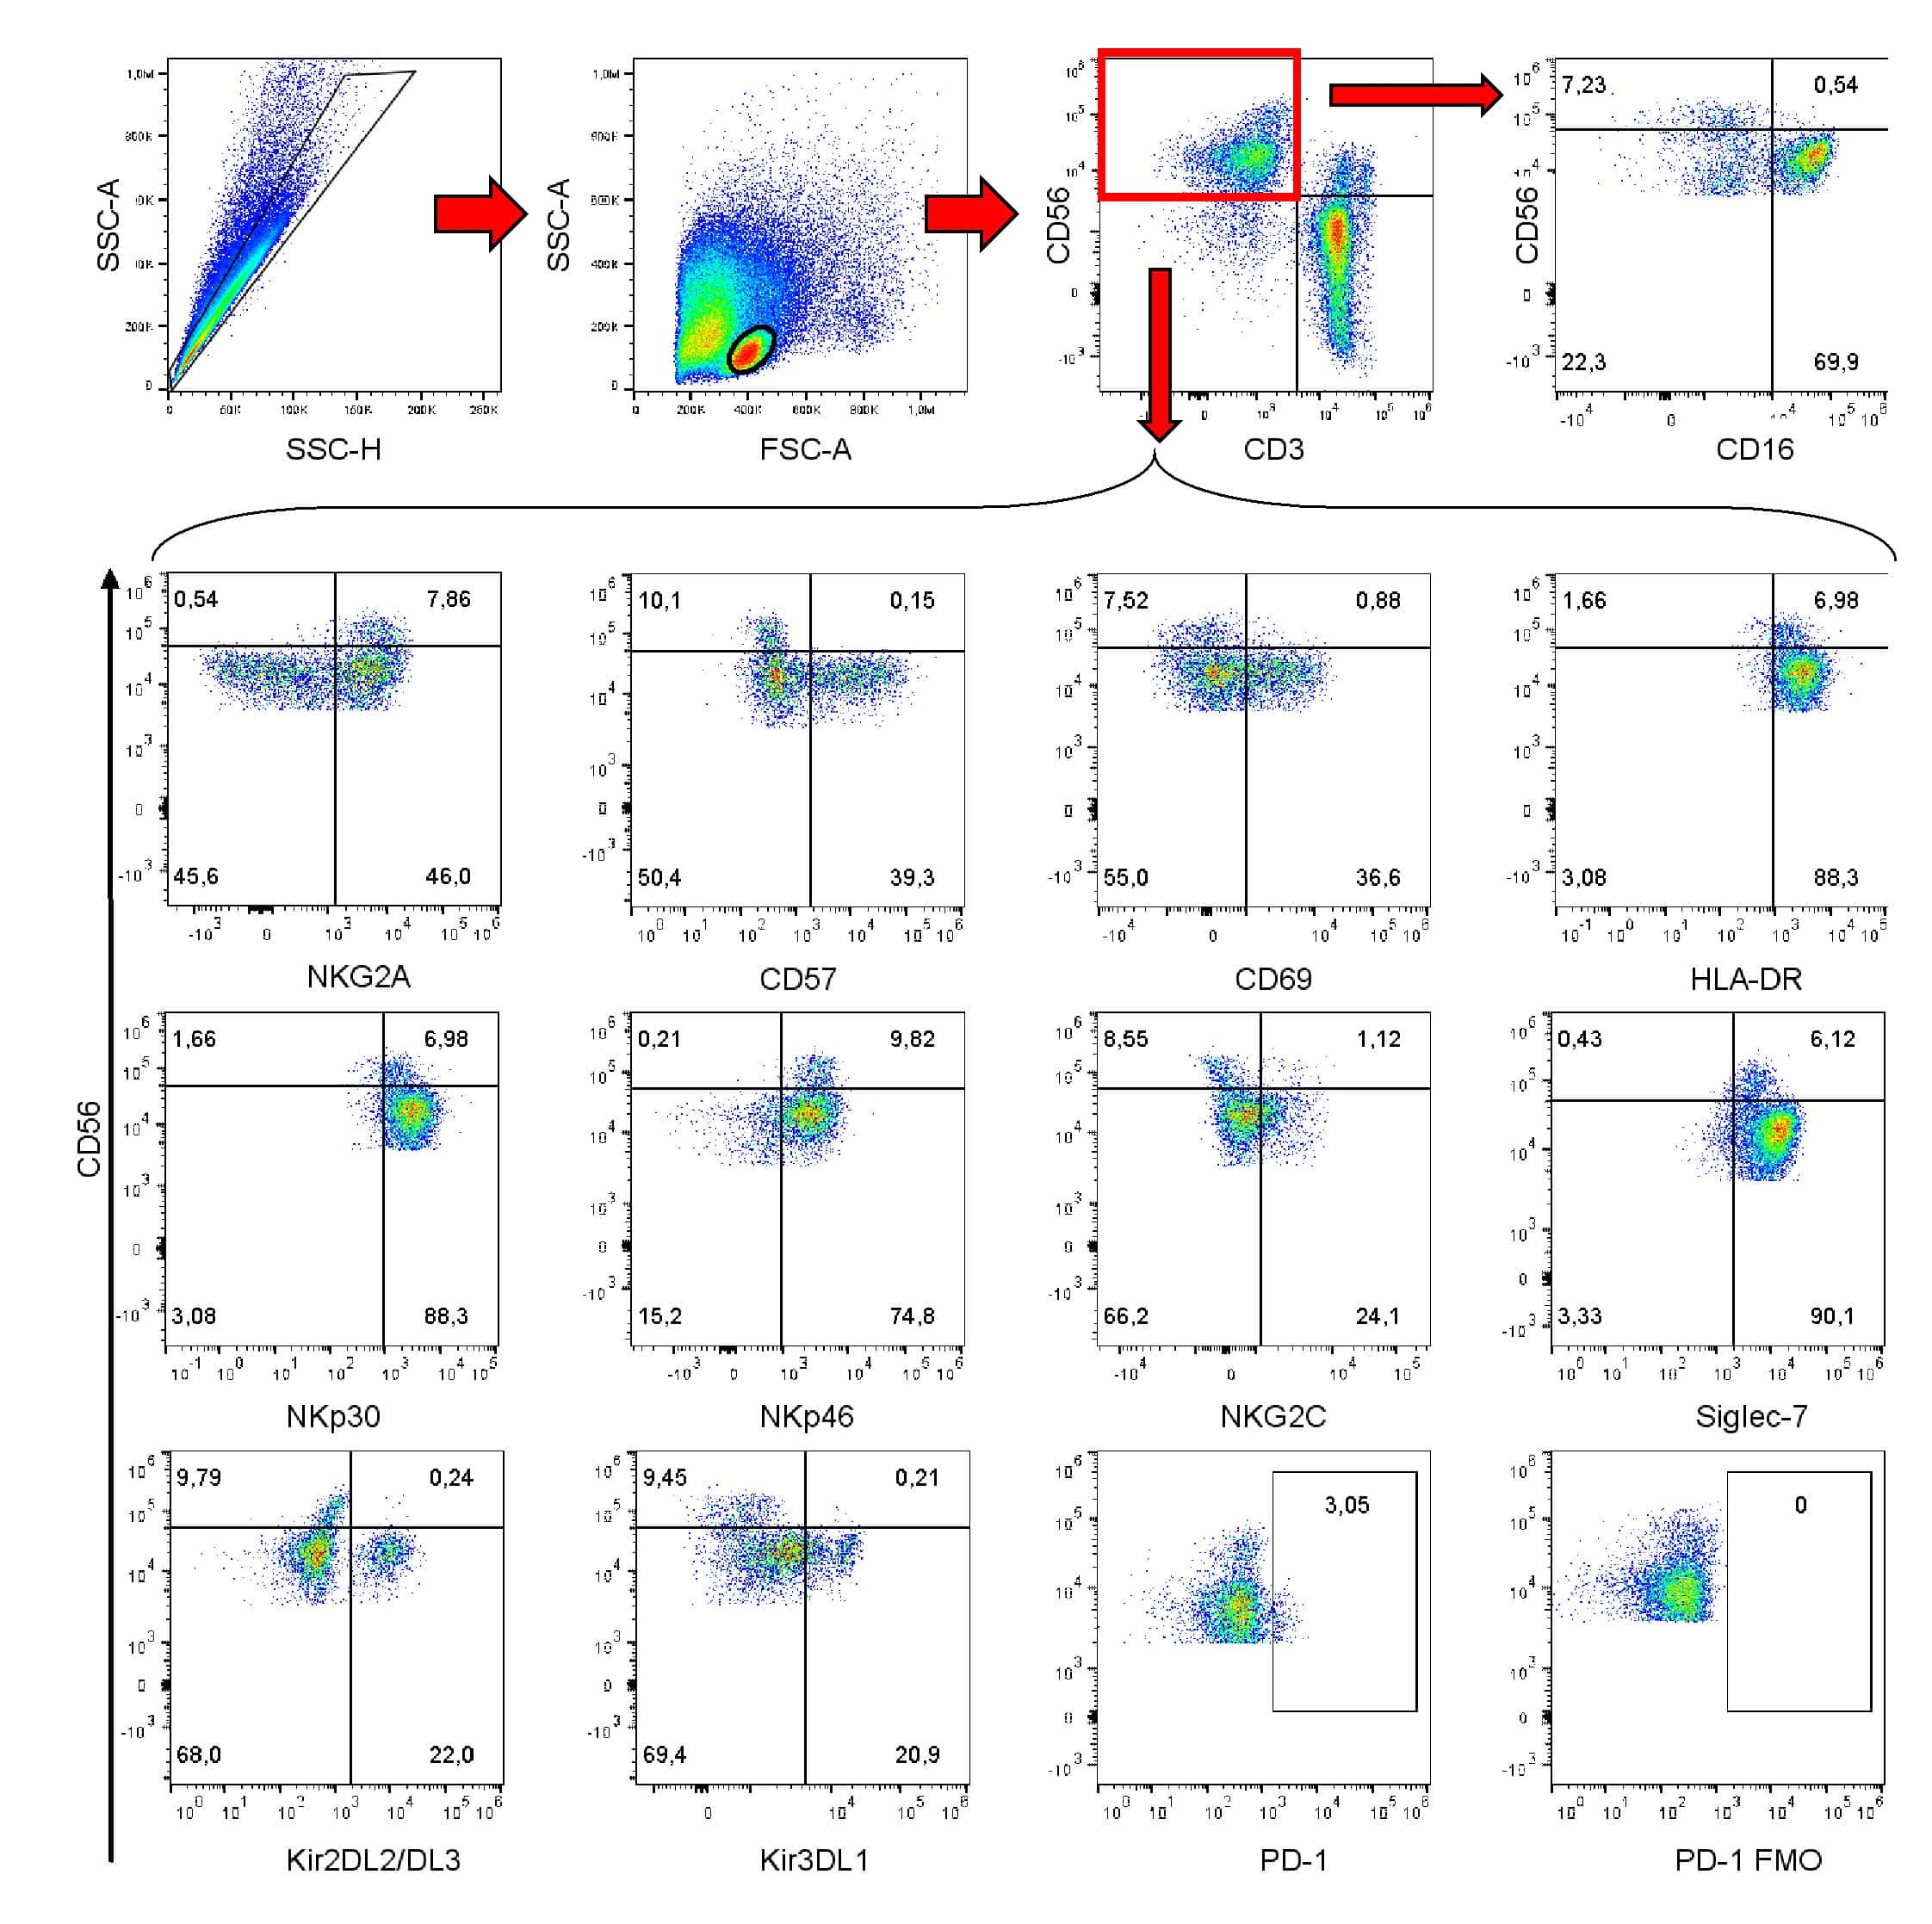
Involvement of natural killer cells in the pathogenesis of endometriosis in patients with pelvic pain.
He J, Xu Y, Yi M, Gu C, Zhu Y, Hu G
The Journal of international medical research 2020 Jul;48(7):300060519871407
The Journal of international medical research 2020 Jul;48(7):300060519871407
Selective Killing of Activated T Cells by 5-Aminolevulinic Acid Mediated Photodynamic Effect: Potential Improvement of Extracorporeal Photopheresis.
Darvekar S, Juzenas P, Oksvold M, Kleinauskas A, Holien T, Christensen E, Stokke T, Sioud M, Peng Q
Cancers 2020 Feb 6;12(2)
Cancers 2020 Feb 6;12(2)
Th2-like T Follicular Helper Cells Promote Functional Antibody Production during Plasmodium falciparum Infection.
Chan JA, Loughland JR, de Labastida Rivera F, SheelaNair A, Andrew DW, Dooley NL, Wines BD, Amante FH, Webb L, Hogarth PM, McCarthy JS, Beeson JG, Engwerda CR, Boyle MJ
Cell reports. Medicine 2020 Dec 22;1(9):100157
Cell reports. Medicine 2020 Dec 22;1(9):100157
Skewed T cell responses to Epstein-Barr virus in long-term asymptomatic kidney transplant recipients.
Nakid-Cordero C, Arzouk N, Gauthier N, Tarantino N, Larsen M, Choquet S, Burrel S, Autran B, Vieillard V, Guihot A
PloS one 2019;14(10):e0224211
PloS one 2019;14(10):e0224211
Inflammation induced by incomplete radiofrequency ablation accelerates tumor progression and hinders PD-1 immunotherapy.
Shi L, Wang J, Ding N, Zhang Y, Zhu Y, Dong S, Wang X, Peng C, Zhou C, Zhou L, Li X, Shi H, Wu W, Long X, Wu C, Liao W
Nature communications 2019 Nov 28;10(1):5421
Nature communications 2019 Nov 28;10(1):5421
Loss of ARPC1B impairs cytotoxic T lymphocyte maintenance and cytolytic activity.
Randzavola LO, Strege K, Juzans M, Asano Y, Stinchcombe JC, Gawden-Bone CM, Seaman MN, Kuijpers TW, Griffiths GM
The Journal of clinical investigation 2019 Dec 2;129(12):5600-5614
The Journal of clinical investigation 2019 Dec 2;129(12):5600-5614
Biallelic mutations in DNA ligase 1 underlie a spectrum of immune deficiencies.
Maffucci P, Chavez J, Jurkiw TJ, O'Brien PJ, Abbott JK, Reynolds PR, Worth A, Notarangelo LD, Felgentreff K, Cortes P, Boisson B, Radigan L, Cobat A, Dinakar C, Ehlayel M, Ben-Omran T, Gelfand EW, Casanova JL, Cunningham-Rundles C
The Journal of clinical investigation 2018 Dec 3;128(12):5489-5504
The Journal of clinical investigation 2018 Dec 3;128(12):5489-5504
Antigen receptor-redirected T cells derived from hematopoietic precursor cells lack expression of the endogenous TCR/CD3 receptor and exhibit specific antitumor capacities.
Van Caeneghem Y, De Munter S, Tieppo P, Goetgeluk G, Weening K, Verstichel G, Bonte S, Taghon T, Leclercq G, Kerre T, Debets R, Vermijlen D, Abken H, Vandekerckhove B
Oncoimmunology 2017;6(3):e1283460
Oncoimmunology 2017;6(3):e1283460
Follicular Regulatory T Cells Are Highly Permissive to R5-Tropic HIV-1.
Miller SM, Miles B, Guo K, Folkvord J, Meditz AL, McCarter MD, Levy DN, MaWhinney S, Santiago ML, Connick E
Journal of virology 2017 Sep 1;91(17)
Journal of virology 2017 Sep 1;91(17)
Guidelines for the use of flow cytometry and cell sorting in immunological studies.
Cossarizza A, Chang HD, Radbruch A, Akdis M, Andrä I, Annunziato F, Bacher P, Barnaba V, Battistini L, Bauer WM, Baumgart S, Becher B, Beisker W, Berek C, Blanco A, Borsellino G, Boulais PE, Brinkman RR, Büscher M, Busch DH, Bushnell TP, Cao X, Cavani A, Chattopadhyay PK, Cheng Q, Chow S, Clerici M, Cooke A, Cosma A, Cosmi L, Cumano A, Dang VD, Davies D, De Biasi S, Del Zotto G, Della Bella S, Dellabona P, Deniz G, Dessing M, Diefenbach A, Di Santo J, Dieli F, Dolf A, Donnenberg VS, Dörner T, Ehrhardt GRA, Endl E, Engel P, Engelhardt B, Esser C, Everts B, Dreher A, Falk CS, Fehniger TA, Filby A, Fillatreau S, Follo M, Förster I, Foster J, Foulds GA, Frenette PS, Galbraith D, Garbi N, García-Godoy MD, Geginat J, Ghoreschi K, Gibellini L, Goettlinger C, Goodyear CS, Gori A, Grogan J, Gross M, Grützkau A, Grummitt D, Hahn J, Hammer Q, Hauser AE, Haviland DL, Hedley D, Herrera G, Herrmann M, Hiepe F, Holland T, Hombrink P, Houston JP, Hoyer BF, Huang B, Hunter CA, Iannone A, Jäck HM, Jávega B, Jonjic S, Juelke K, Jung S, Kaiser T, Kalina T, Keller B, Khan S, Kienhöfer D, Kroneis T, Kunkel D, Kurts C, Kvistborg P, Lannigan J, Lantz O, Larbi A, LeibundGut-Landmann S, Leipold MD, Levings MK, Litwin V, Liu Y, Lohoff M, Lombardi G, Lopez L, Lovett-Racke A, Lubberts E, Ludewig B, Lugli E, Maecker HT, Martrus G, Matarese G, Maueröder C, McGrath M, McInnes I, Mei HE, Melchers F, Melzer S, Mielenz D, Mills K, Mirrer D, Mjösberg J, Moore J, Moran B, Moretta A, Moretta L, Mosmann TR, Müller S, Müller W, Münz C, Multhoff G, Munoz LE, Murphy KM, Nakayama T, Nasi M, Neudörfl C, Nolan J, Nourshargh S, O'Connor JE, Ouyang W, Oxenius A, Palankar R, Panse I, Peterson P, Peth C, Petriz J, Philips D, Pickl W, Piconese S, Pinti M, Pockley AG, Podolska MJ, Pucillo C, Quataert SA, Radstake TRDJ, Rajwa B, Rebhahn JA, Recktenwald D, Remmerswaal EBM, Rezvani K, Rico LG, Robinson JP, Romagnani C, Rubartelli A, Ruckert B, Ruland J, Sakaguchi S, Sala-de-Oyanguren F, Samstag Y, Sanderson S, Sawitzki B, Scheffold A, Schiemann M, Schildberg F, Schimisky E, Schmid SA, Schmitt S, Schober K, Schüler T, Schulz AR, Schumacher T, Scotta C, Shankey TV, Shemer A, Simon AK, Spidlen J, Stall AM, Stark R, Stehle C, Stein M, Steinmetz T, Stockinger H, Takahama Y, Tarnok A, Tian Z, Toldi G, Tornack J, Traggiai E, Trotter J, Ulrich H, van der Braber M, van Lier RAW, Veldhoen M, Vento-Asturias S, Vieira P, Voehringer D, Volk HD, von Volkmann K, Waisman A, Walker R, Ward MD, Warnatz K, Warth S, Watson JV, Watzl C, Wegener L, Wiedemann A, Wienands J, Willimsky G, Wing J, Wurst P, Yu L, Yue A, Zhang Q, Zhao Y, Ziegler S, Zimmermann J
European journal of immunology 2017 Oct;47(10):1584-1797
European journal of immunology 2017 Oct;47(10):1584-1797
A Safety Checkpoint to Eliminate Cancer Risk of the Immune Evasive Cells Derived from Human Embryonic Stem Cells.
He J, Rong Z, Fu X, Xu Y
Stem cells (Dayton, Ohio) 2017 May;35(5):1154-1161
Stem cells (Dayton, Ohio) 2017 May;35(5):1154-1161
Blocking the recruitment of naive CD4(+) T cells reverses immunosuppression in breast cancer.
Su S, Liao J, Liu J, Huang D, He C, Chen F, Yang L, Wu W, Chen J, Lin L, Zeng Y, Ouyang N, Cui X, Yao H, Su F, Huang JD, Lieberman J, Liu Q, Song E
Cell research 2017 Apr;27(4):461-482
Cell research 2017 Apr;27(4):461-482
MAIT cells are activated during human viral infections.
van Wilgenburg B, Scherwitzl I, Hutchinson EC, Leng T, Kurioka A, Kulicke C, de Lara C, Cole S, Vasanawathana S, Limpitikul W, Malasit P, Young D, Denney L, STOP-HCV consortium, Moore MD, Fabris P, Giordani MT, Oo YH, Laidlaw SM, Dustin LB, Ho LP, Thompson FM, Ramamurthy N, Mongkolsapaya J, Willberg CB, Screaton GR, Klenerman P
Nature communications 2016 Jun 23;7:11653
Nature communications 2016 Jun 23;7:11653
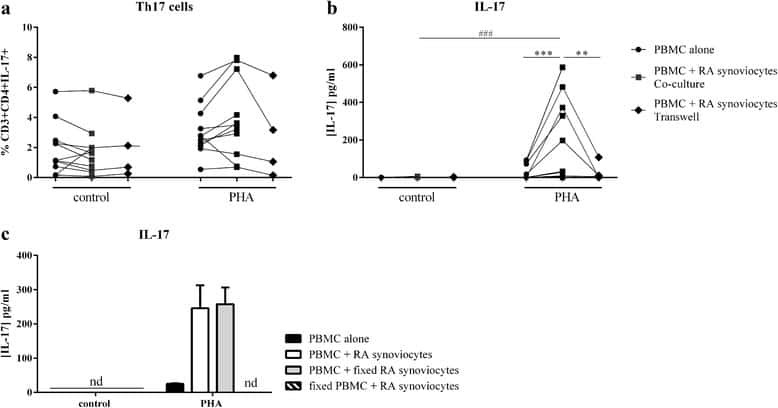
Interaction among activated lymphocytes and mesenchymal cells through podoplanin is critical for a high IL-17 secretion.
Noack M, Ndongo-Thiam N, Miossec P
Arthritis research & therapy 2016 Jun 23;18:148
Arthritis research & therapy 2016 Jun 23;18:148
Antibodies to P-selectin glycoprotein ligand-1 block dendritic cell-mediated enterovirus 71 transmission and prevent virus-induced cells death.
Ren XX, Li C, Xiong SD, Huang Z, Wang JH, Wang HB
Virulence 2015;6(8):802-8
Virulence 2015;6(8):802-8
Regulatory Dendritic Cells Restrain NK Cell IFN-γ Production through Mechanisms Involving NKp46, IL-10, and MHC Class I-Specific Inhibitory Receptors.
Spallanzani RG, Torres NI, Avila DE, Ziblat A, Iraolagoitia XL, Rossi LE, Domaica CI, Fuertes MB, Rabinovich GA, Zwirner NW
Journal of immunology (Baltimore, Md. : 1950) 2015 Sep 1;195(5):2141-8
Journal of immunology (Baltimore, Md. : 1950) 2015 Sep 1;195(5):2141-8
Follicular regulatory T cells impair follicular T helper cells in HIV and SIV infection.
Miles B, Miller SM, Folkvord JM, Kimball A, Chamanian M, Meditz AL, Arends T, McCarter MD, Levy DN, Rakasz EG, Skinner PJ, Connick E
Nature communications 2015 Oct 20;6:8608
Nature communications 2015 Oct 20;6:8608
Oncogenic Transformation Can Orchestrate Immune Evasion and Inflammation in Human Mesenchymal Stem Cells Independently of Extrinsic Immune-Selective Pressure.
Miranda A, Funes JM, Sánchez N, Limia CM, Mesa M, Quezada SA, Pérez R, de León J
Cancer research 2015 Aug 1;75(15):3032-42
Cancer research 2015 Aug 1;75(15):3032-42
Induction of type I and type III interferons by Borrelia burgdorferi correlates with pathogenesis and requires linear plasmid 36.
Krupna-Gaylord MA, Liveris D, Love AC, Wormser GP, Schwartz I, Petzke MM
PloS one 2014;9(6):e100174
PloS one 2014;9(6):e100174
Depressive symptoms post hip fracture in older adults are associated with phenotypic and functional alterations in T cells.
Duggal NA, Upton J, Phillips AC, Hampson P, Lord JM
Immunity & ageing : I & A 2014;11(1):25
Immunity & ageing : I & A 2014;11(1):25
Novel lentiviral vectors with mutated reverse transcriptase for mRNA delivery of TALE nucleases.
Mock U, Riecken K, Berdien B, Qasim W, Chan E, Cathomen T, Fehse B
Scientific reports 2014 Sep 18;4:6409
Scientific reports 2014 Sep 18;4:6409
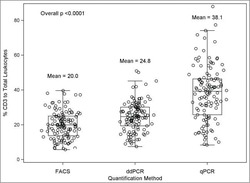
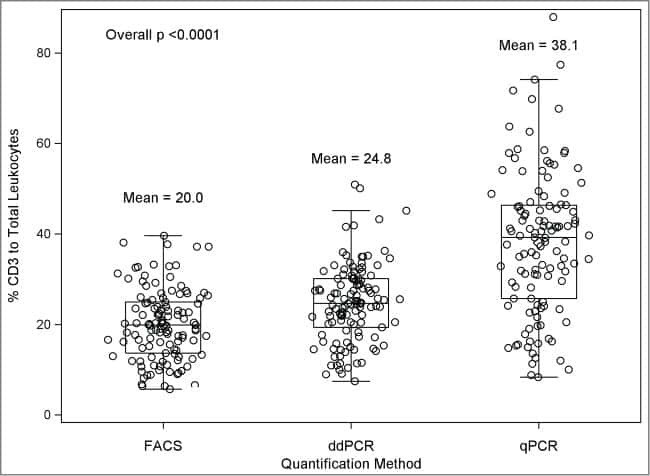
A comparison of DNA methylation specific droplet digital PCR (ddPCR) and real time qPCR with flow cytometry in characterizing human T cells in peripheral blood.
Wiencke JK, Bracci PM, Hsuang G, Zheng S, Hansen H, Wrensch MR, Rice T, Eliot M, Kelsey KT
Epigenetics 2014 Oct;9(10):1360-5
Epigenetics 2014 Oct;9(10):1360-5
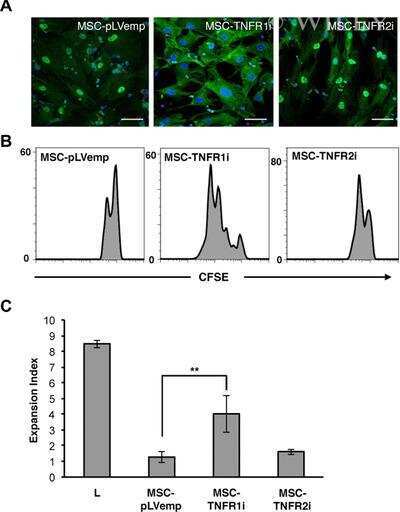
Human mesenchymal stromal cells modulate T-cell responses through TNF-α-mediated activation of NF-κB.
Dorronsoro A, Ferrin I, Salcedo JM, Jakobsson E, Fernández-Rueda J, Lang V, Sepulveda P, Fechter K, Pennington D, Trigueros C
European journal of immunology 2014 Feb;44(2):480-8
European journal of immunology 2014 Feb;44(2):480-8
Trypan blue exclusion assay by flow cytometry.
Avelar-Freitas BA, Almeida VG, Pinto MC, Mourão FA, Massensini AR, Martins-Filho OA, Rocha-Vieira E, Brito-Melo GE
Brazilian journal of medical and biological research = Revista brasileira de pesquisas medicas e biologicas 2014 Apr;47(4):307-15
Brazilian journal of medical and biological research = Revista brasileira de pesquisas medicas e biologicas 2014 Apr;47(4):307-15
MHC multimer-guided and cell culture-independent isolation of functional T cell receptors from single cells facilitates TCR identification for immunotherapy.
Dössinger G, Bunse M, Bet J, Albrecht J, Paszkiewicz PJ, Weißbrich B, Schiedewitz I, Henkel L, Schiemann M, Neuenhahn M, Uckert W, Busch DH
PloS one 2013;8(4):e61384
PloS one 2013;8(4):e61384
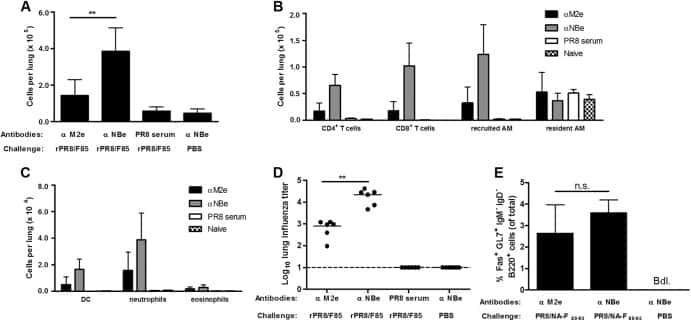
Recombinant influenza virus carrying the respiratory syncytial virus (RSV) F85-93 CTL epitope reduces RSV replication in mice.
De Baets S, Schepens B, Sedeyn K, Schotsaert M, Roose K, Bogaert P, Fiers W, Saelens X
Journal of virology 2013 Mar;87(6):3314-23
Journal of virology 2013 Mar;87(6):3314-23
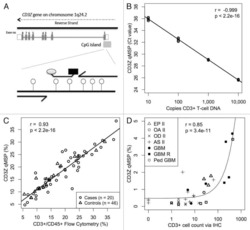
Epigenetic biomarkers of T-cells in human glioma.
Wiencke JK, Accomando WP, Zheng S, Patoka J, Dou X, Phillips JJ, Hsuang G, Christensen BC, Houseman EA, Koestler DC, Bracci P, Wiemels JL, Wrensch M, Nelson HH, Kelsey KT
Epigenetics 2012 Dec 1;7(12):1391-402
Epigenetics 2012 Dec 1;7(12):1391-402
Penicillium marneffei-stimulated dendritic cells enhance HIV-1 trans-infection and promote viral infection by activating primary CD4+ T cells.
Qin Y, Li Y, Liu W, Tian R, Guo Q, Li S, Li H, Zhang D, Zheng Y, Wu L, Lan K, Wang J
PloS one 2011;6(11):e27609
PloS one 2011;6(11):e27609
Replication of Epstein-Barr virus primary infection in human tonsil tissue explants.
Gotoh K, Ito Y, Maruo S, Takada K, Mizuno T, Teranishi M, Nakata S, Nakashima T, Iwata S, Goshima F, Nakamura S, Kimura H
PloS one 2011;6(10):e25490
PloS one 2011;6(10):e25490
The effects of trastuzumab on the CD4+CD25+FoxP3+ and CD4+IL17A+ T-cell axis in patients with breast cancer.
Horlock C, Stott B, Dyson PJ, Morishita M, Coombes RC, Savage P, Stebbing J
British journal of cancer 2009 Apr 7;100(7):1061-7
British journal of cancer 2009 Apr 7;100(7):1061-7
An antibody against the surfactant protein A (SP-A)-binding domain of the SP-A receptor inhibits T cell-mediated immune responses to Mycobacterium tuberculosis.
Samten B, Townsend JC, Sever-Chroneos Z, Pasquinelli V, Barnes PF, Chroneos ZC
Journal of leukocyte biology 2008 Jul;84(1):115-23
Journal of leukocyte biology 2008 Jul;84(1):115-23
No comments: Submit comment
Supportive validation
- Submitted by
- Invitrogen Antibodies (provider)
- Main image
- Experimental details
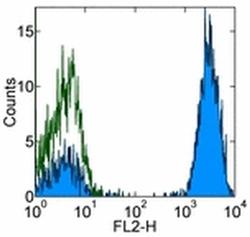
- Staining of normal human peripheral blood cells with Mouse IgG1 kappa Isotype Control PE (Product # 12-4714-81) (open histogram) or Anti-Human CD3 PE (filled histogram). Cells in the lymphocyte gate were used for analysis.
- Conjugate
- Yellow dye

- Submitted by
- Invitrogen Antibodies (provider)
- Main image
- Experimental details
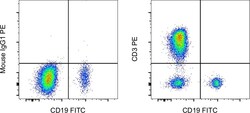
- Normal human peripheral blood cells were stained with CD19 Monoclonal Antibody, FITC (Product # 11-0199-42) and Mouse IgG1 kappa Isotype Control, PE (Product # 12-4714-82) (left) or CD3 Monoclonal Antibody, PE (right). Cells in the lymphocyte gate were used for analysis.
- Conjugate
- Yellow dye

Supportive validation
- Submitted by
- Invitrogen Antibodies (provider)
- Main image
- Experimental details
- NULL
- Conjugate
- Yellow dye

- Submitted by
- Invitrogen Antibodies (provider)
- Main image
- Experimental details
- NULL
- Conjugate
- Yellow dye

- Submitted by
- Invitrogen Antibodies (provider)
- Main image

- Experimental details
- NULL
- Conjugate
- Yellow dye
- Submitted by
- Invitrogen Antibodies (provider)
- Main image
- Experimental details
- NULL
- Conjugate
- Yellow dye
- Submitted by
- Invitrogen Antibodies (provider)
- Main image

- Experimental details
- NULL
- Conjugate
- Yellow dye
- Submitted by
- Invitrogen Antibodies (provider)
- Main image
- Experimental details
- NULL
- Conjugate
- Yellow dye
- Submitted by
- Invitrogen Antibodies (provider)
- Main image
- Experimental details
- NULL
- Conjugate
- Yellow dye
- Submitted by
- Invitrogen Antibodies (provider)
- Main image
- Experimental details
- NULL
- Conjugate
- Yellow dye
- Submitted by
- Invitrogen Antibodies (provider)
- Main image
- Experimental details
- NULL
- Conjugate
- Yellow dye
- Submitted by
- Invitrogen Antibodies (provider)
- Main image
- Experimental details
- NULL
- Conjugate
- Yellow dye
- Submitted by
- Invitrogen Antibodies (provider)
- Main image
- Experimental details
- NULL
- Conjugate
- Yellow dye
- Submitted by
- Invitrogen Antibodies (provider)
- Main image
- Experimental details
- NULL
- Conjugate
- Yellow dye

- Submitted by
- Invitrogen Antibodies (provider)
- Main image
- Experimental details
- NULL
- Conjugate
- Yellow dye
- Submitted by
- Invitrogen Antibodies (provider)
- Main image
- Experimental details
- NULL
- Conjugate
- Yellow dye
- Submitted by
- Invitrogen Antibodies (provider)
- Main image

- Experimental details
- NULL
- Conjugate
- Yellow dye
- Submitted by
- Invitrogen Antibodies (provider)
- Main image

- Experimental details
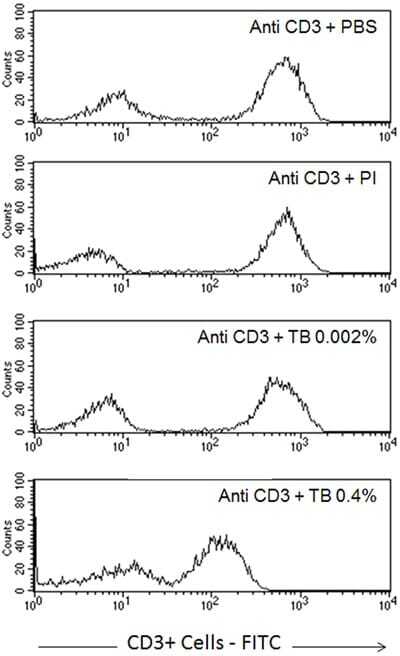
- Figure 6 Profile of T-lymphocytes stained with monoclonal antibody anti-CD3-FITCfollowed by treatment with propidium iodide (PI) and trypan blue (TB) at 0.002and 0.4% (w/v) or PBS (untreated control).
- Conjugate
- Yellow dye
- Submitted by
- Invitrogen Antibodies (provider)
- Main image
- Experimental details
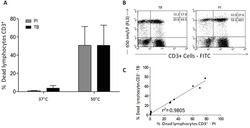
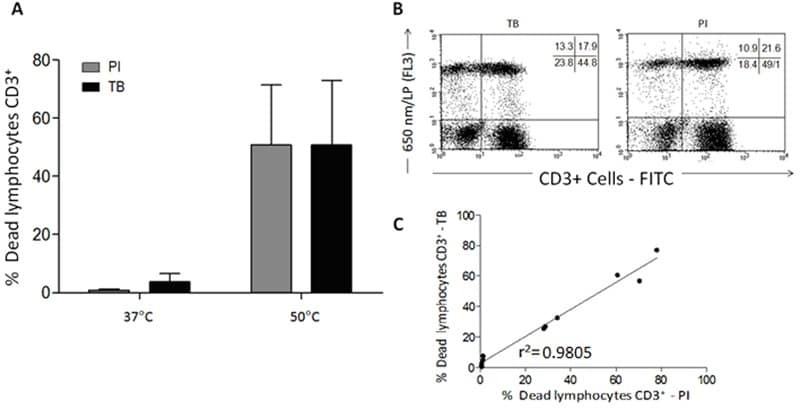
- Figure 7 A , Percentage of dead human T-lymphocytes(CD3-FITC + cells) submitted to cell culture at temperatures (T)of 37degC (physiologic temperature) or 50degC (high-stress temperature) followed bystaining with trypan blue (TB) or propidium iodide (PI). B ,Dot-plot graph profile between human lymphocytes submitted to pretreatment withhigh-stress temperature (50degC) followed by staining with TB and PI andmonoclonal antibody anti-CD3-FITC + . C , Pearson'scorrelation test between dead CD3 + lymphocytes using PI and TB flowcytometry assays.
- Conjugate
- Yellow dye
- Submitted by
- Invitrogen Antibodies (provider)
- Main image

- Experimental details
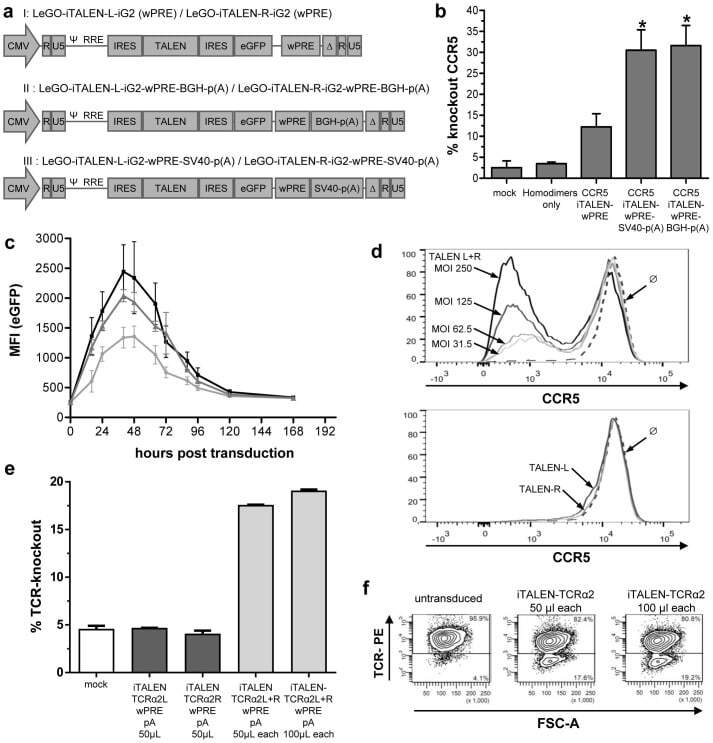
- Figure 3 Functional analysis of NRTLV-delivered TALEN constructs. (a) Schematic vector design of I: LeGO-iTALEN-iG2 (wPRE), II: LeGO-iTALEN-iG2-wPRE-BGH-p(A) and III: LeGO-iTALEN-iG2-wPRE-SV40-p(A) 3 rd generation LVV derived from LeGO-system 11 . CMV = CMV-ie promoter; Delta (DeltaU3), R, U5 = elements of SIN-LTR, self-inactivating long terminal repeat; Psi = Psi , packaging signal; RRE = Rev response element; SFFV = promoter of spleen focus-forming virus; wPRE = Woodchuck hepatitis virus posttranscriptional regulatory element; IRES = internal ribosome entry site; eGFP = enhanced green fluorescent protein; p(A) = polyadenylation signal; BGH = bovine growth hormone; SV40 = simian virus 40. (b) Knockout of CCR5 in reporter cell line CCR5+/293T-cell clones were co-transduced with non-concentrated NRTLVs delivering different iTALEN-constructs with either no internal polyadenylation (p(A)) signal (iTALEN-wPRE), or internal BGH-p(A) (iTALEN-wPRE-BGH-p(A)) or SV40-p(A) (iTALEN-wPRE-SV40-p(A)) signals downstream of the wPRE-element, respectively. Mock-transduction and transduction of left or right TALEN-arms, only, served as negative controls (homodimers only). Measured for 3 independently produced vector preparations, each time in duplicates, *p
- Conjugate
- Yellow dye
- Submitted by
- Invitrogen Antibodies (provider)
- Main image
- Experimental details
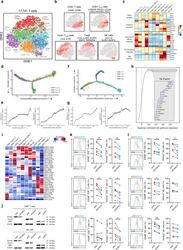
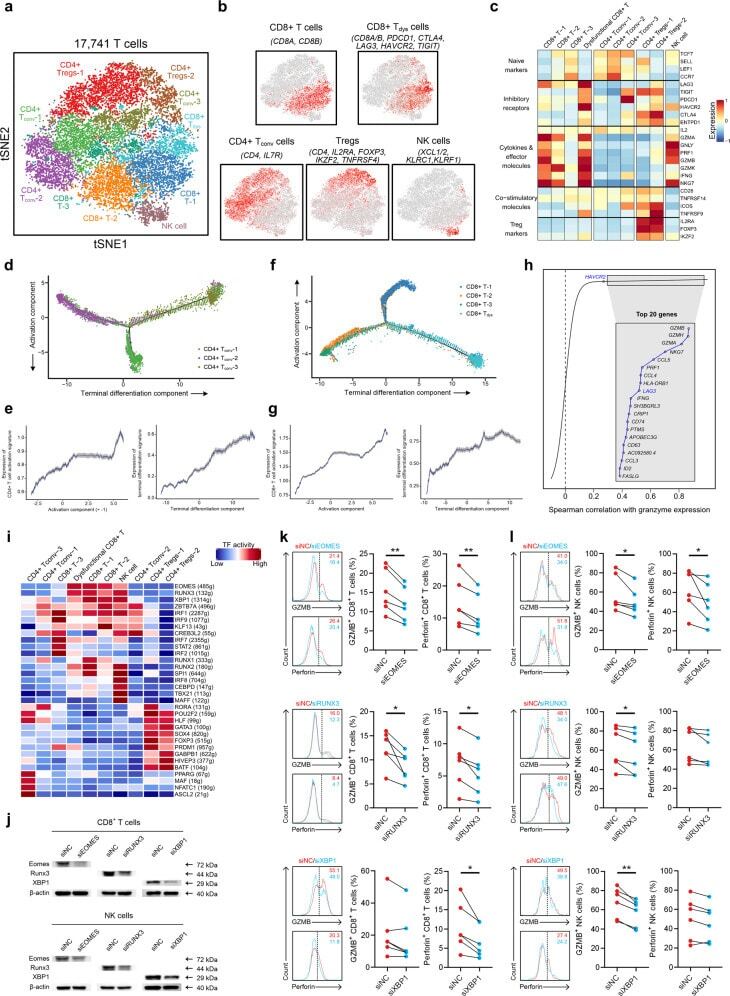
- Fig. 4 T/NK cell clusters in NPC. a t-SNE plot showing 10 clusters of 17,263 T/NK cells (indicated by colors). b t-SNE plot, color coding for the expression of the marker genes (gray to red) for the indicated cell subtypes. c Average expression of selected T cell function-associated genes of naive markers, inhibitory receptors, cytokines and effector molecules, co-stimulatory molecules, and Treg markers in each cell cluster. d Potential developmental trajectory of CD4 + T cells ( n = 5694) inferred by analysis with Monocle 2. Arrows show the increasing directions of certain CD4 + T cell properties annotated with the signatures shown in e . e Traceplots of (left) CD4 + T cell activation signature along activation component and (right) terminal differentiation signature along terminal differentiation component for the CD4 + T cells. Cells are projected along the component, with the blue line indicating the moving average of the expression of signatures (a sliding window of length equal to 5% of the total number of CD4 + T cells was used), and the shaded area displaying SEM. Signatures used are presented in Supplementary information, Table S9 . f Potential developmental trajectory of CD8 + T cells ( n = 6975) inferred by analysis with Monocle 2. Arrows show the increasing directions of certain CD8 + T cell properties annotated with the signatures shown in g . g Traceplots (as in e ) of (left) CD8 + T cell activation signature along activation component and (right) terminal diffe
- Conjugate
- Yellow dye
- Submitted by
- Invitrogen Antibodies (provider)
- Main image
- Experimental details
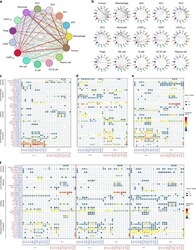
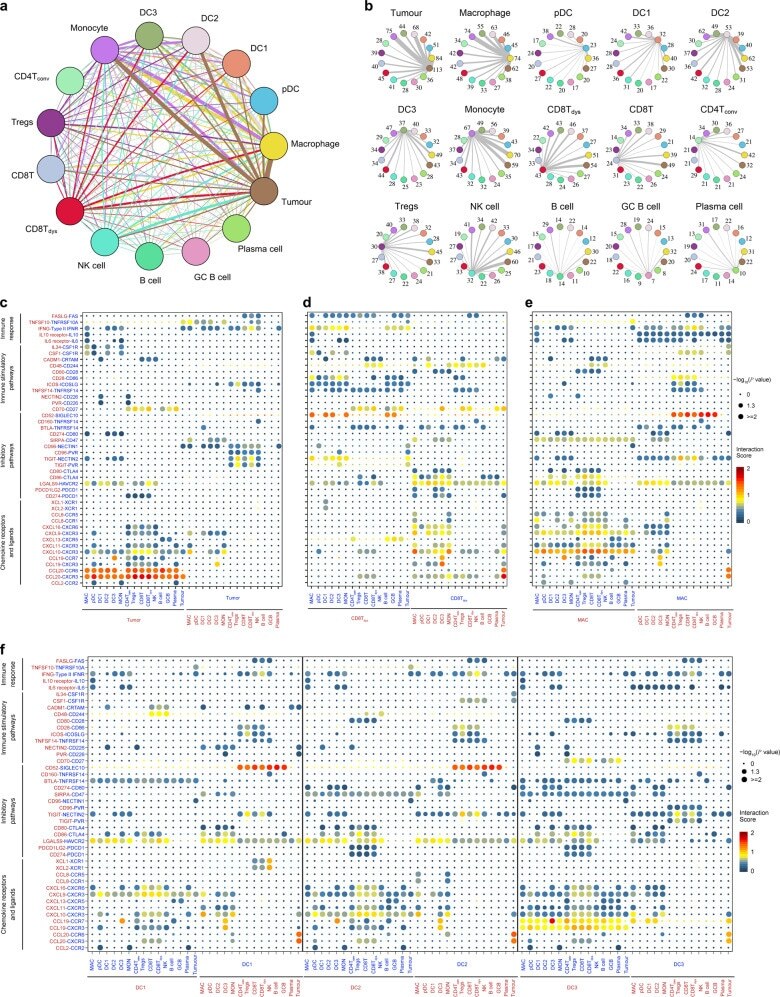
- Fig. 6 The dense network and multiple regulatory immune responses in the TME of NPC. a Capacity for intercellular communication between malignant cells and immune cells. Each line color indicates the ligands expressed by the cell population represented in the same color (labeled). The lines connect to the cell types that express the cognate receptors. The line thickness is proportional to the number of ligands when cognate receptors are present in the recipient cell type. The loops indicate autocrine circuits. The map quantifies potential communication but does not account for the anatomical locations or boundaries of the cell types. b Detailed view of the ligands expressed by each major cell type and the cells expressing the cognate receptors primed to receive the signal. Numbers indicate the quantity of ligand-receptor pairs for each intercellular link. c - f Overview of selected ligand-receptor interactions of tumor cells ( c ), dysfunctional CD8 + T cells ( d ), macrophages ( e ), and the three types of DCs ( f , DC1, DC2, and DC3). P values are indicated by circle size, with the scale to the right (permutation test). The means of the average expression levels of interacting molecule 1 in cluster 1 and interacting molecule 2 in cluster 2 are indicated by color. Assays were carried out at the mRNA level but were used to extrapolate protein interactions. CD4T conv , conventional CD4 + T cell; CD8T, CD8 + T cell; CD8T dys , dysfunctional CD8 + T cell; DC, dendritic cell; GCB
- Conjugate
- Yellow dye
- Submitted by
- Invitrogen Antibodies (provider)
- Main image

- Experimental details
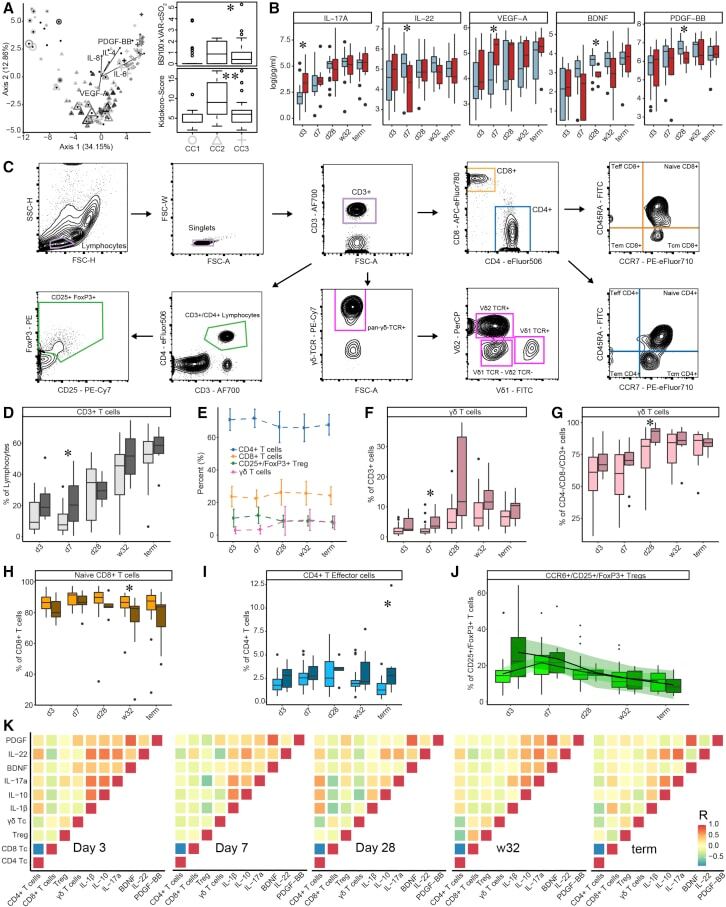
- Figure 2 T cell ontogenesis in extremely premature infants with and without severe brain injury (A) Principal coordinates analysis (PCoA)--biplot of sequestered cytokine and chemokine composition. Silhouette scoring identified 3 main cyto-Clusters (as indicated by different symbols). The shade of the symbols (gray to black) is determined by days post-delivery--the older the infant the darker the symbol. The size of the symbols is determined by the Kidokoro Score as assessed at term-equivalent age via cMRI--the higher the score the larger the symbol. Significantly correlated (p < 0.05) cytokines/chemokines are plotted as arrows. In addition, box plots next to PCoA show the range of combined values for burst suppression and variance of cranial oxygenation (BS/100 x VAR-cSO 2 ), as well as the range of Kidokoro Scores in the respective cyto-clusters (cyto-cluster 1, CC1; cyto-cluster 2, CC2; cyto-cluster 3, CC3). (B) Blood cytokine/chemokine concentrations in infants with (red) and without (blue) severe BI (3 days post-delivery, d3; 7 days post-delivery, d7; 28 days post-delivery, d28; 32 weeks of gestational age, w32; term-equivalent age = term). (C) Representative images illustrating the gating strategy for FACS analysis. Differently colored gates mark gating for respective cell populations. Magenta, untargeted; blue, T helper cells; orange, cytotoxic T cells; green, T regulatory cells; pink, gammadelta T cells. For box plots in (D) and (F-J), darker shade represents data from
- Conjugate
- Yellow dye
- Submitted by
- Invitrogen Antibodies (provider)
- Main image
- Experimental details
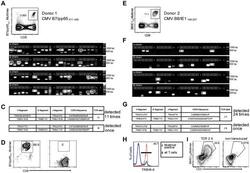
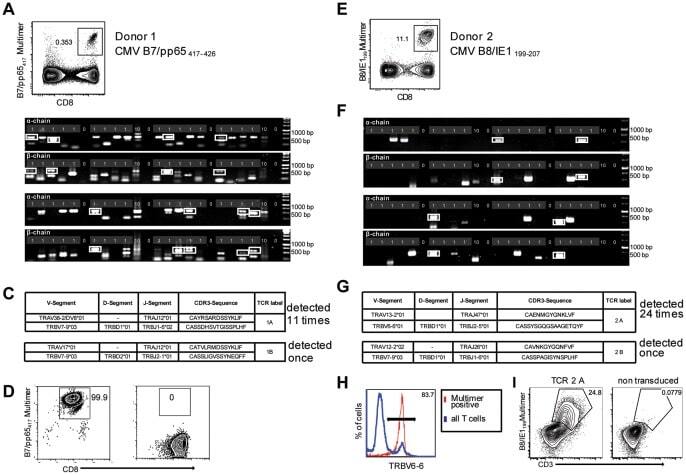
- Figure 2 Single-cell PCR delivers sequences of functional CMV-specific TCRs. (A) PBMCs from Donor 1 were recovered and stained with HLA-B7/pp65 417-426 multimers. Dot plot shows the further analyzed CD8 and MHC multimer double-positive cell population. Cells were pre-gated on live lymphocytes (propidium iodide-negative, and CD3-positive). (B) TCR SCAN as described in Figure 1 and agarose gel electrophoresis of the resulting PCR products was performed. The photography shows the agarose gel. Upper row shows alpha-chain products matched with the respective beta-chains in the lower row. White boxes indicate alpha- and matched beta-chain-products derived from identical single cell samples. (C) The table summarizes the V- D- J- segment type and amino acid sequences of TCRs identified from CMV-multimer positive T cells in Figure 2A . TCR1A was identified 11 times and TCR 1B was detected once. (D) MHC multimer-positive T cells from the same donor were in vitro expanded and six T cell clones were successfully maintained. All clones contained TCR1A as confirmed by PCR and sequencing. The left FACS plot shows HLA-B7/pp65 417-426 staining and the right FACS plot shows staining with an irrelevant MHC multimer. (E) PBMCs from donor 2 were recovered and stained with HLA-B8/IE-1 199-207 multimers. The dot plot shows the further analyzed CD8 and MHC multimer double-positive cell population. Cells were pre-gated on living lymphocytes (propidium iodide negative and CD3 positive). (F) TCR SCAN a
- Conjugate
- Yellow dye
- Submitted by
- Invitrogen Antibodies (provider)
- Main image
- Experimental details
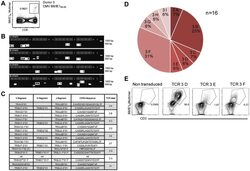
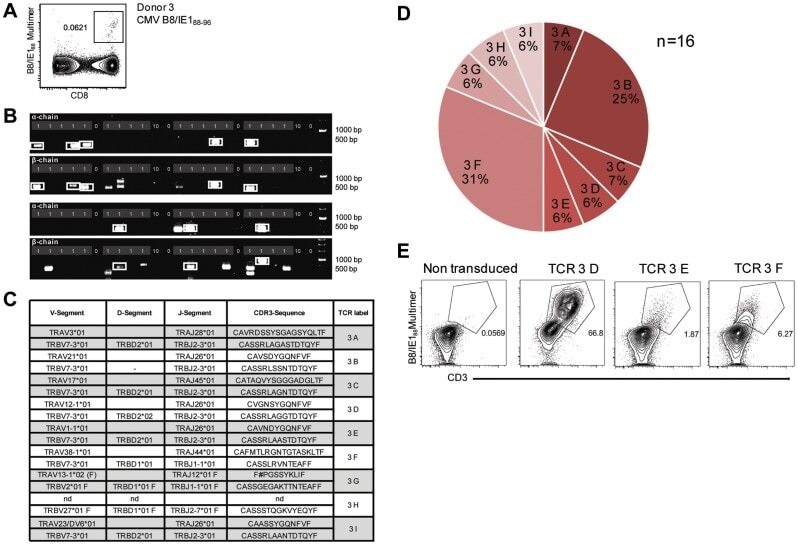
- Figure 3 Characterization of a small diverse T cell repertoire and transgenic expression of detected TCRs. (A) PBMCs from donor 3 were stained with HLA-B8/IE-1 88-96 multimers. Dot plot shows the further analyzed CD8 and MHC multimer double-positive cell population. Cells were pre-gated on living lymphocytes (propidium iodide-negative and CD3-positive). (B) A PCR slide with single antigen-specific T cells from Figure 3A were FACS-isolated. TCR SCAN as described in Figure 1 and agarose gel electrophoresis of the resulting PCR products was performed. Upper row shows alpha-chain products matched with the respective beta-chains in the lower row. White boxes indicate samples alpha- and matched beta-chain-products derived from identical single cell samples. (C) The table summarizes the V- D- J- segment type and amino acid sequences of TCRs identified from CMV-multimer positive T cells in Figure 3A . In three independent experiments we identified nine different TCRs (TCR 3A-I) (D) Pie chart indicates the prevalence of identified TCRs from donor 3. Percentages represent incidence of respective TCR divided by total number of positive samples. (E) Sequences from TCR 3D, 3E and 3G were expressed in Jurkat76 T cells by retroviral gene transfer. Non-transduced (left FACS plot) and transduced Jurkat76 T cells were analyzed for expression of CD3 and MHC multimer binding.
- Conjugate
- Yellow dye
- Submitted by
- Invitrogen Antibodies (provider)
- Main image

- Experimental details
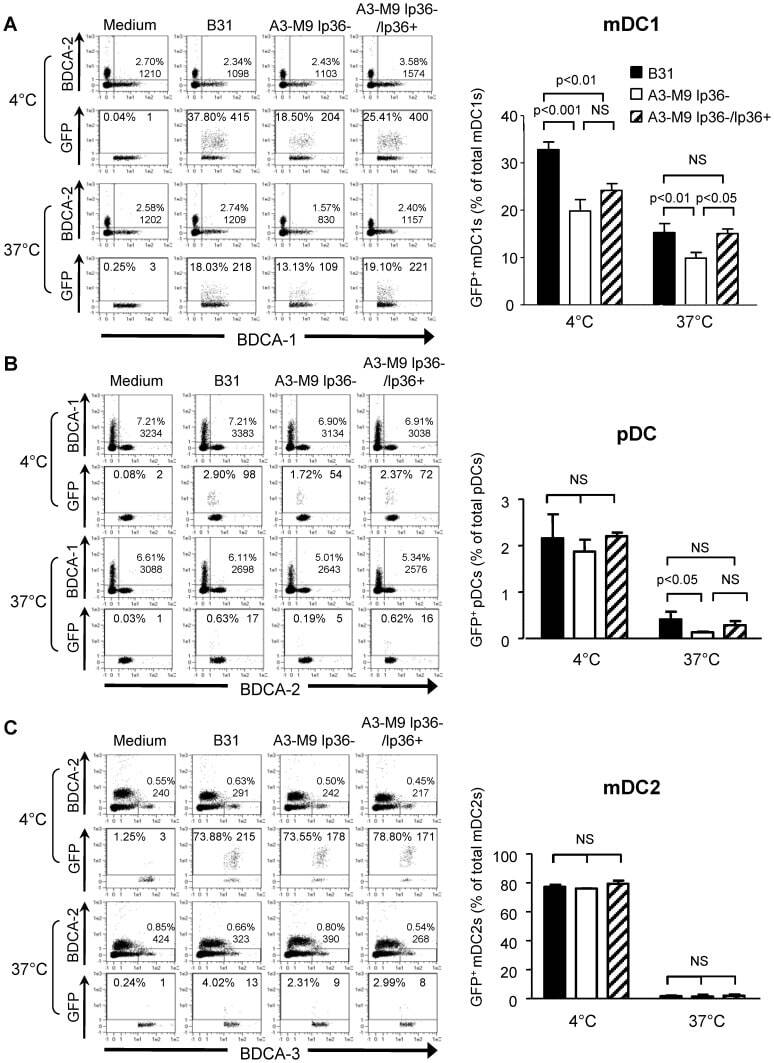
- Figure 5 lp36 contributes to the association of B. burgdorferi with specific populations of dendritic cells. Human PBMCs (4x10 6 ) were co-incubated with 4x10 7 GFP-tagged B31 (black bars), A3-M9 lp36- (white bars) or A3-M9 lp36-/lp36+ (cross-hatched bars) B. burgdorferi for 6 hours at 4degC or 37degC. The percentages of GFP + mDC1s (CD19 - CD3 - BDCA2 - BDCA1 + ) ( A ), pDCs (CD19 - CD3 - BDCA2 + BDCA1 - ) or ( B ) mDC2s (CD19 - CD3 - BDCA3 + BDCA2 - ) ( C ) were determined by multiparameter flow cytometry. Dot plots representing 500,000 collected events are provided to illustrate gating strategies (left). Column graphs represent the mean and standard deviation of three biological replicates (right). Statistical analysis was performed using a one-way ANOVA with a Tukey's post-test for multiple comparisons.
- Conjugate
- Yellow dye
- Submitted by
- Invitrogen Antibodies (provider)
- Main image
- Experimental details
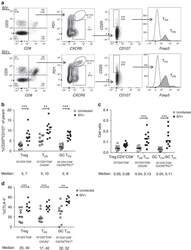
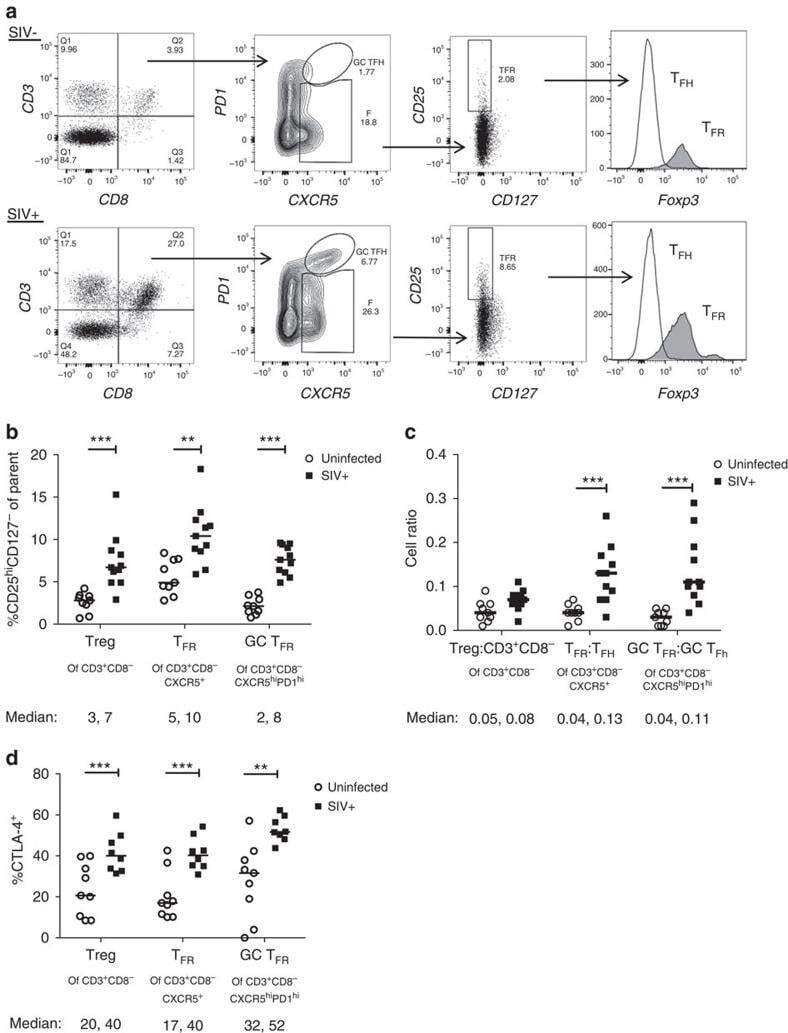
- Figure 2 T FR expansion in lymphoid tissues during chronic SIV infection. ( a ) Disaggregated lymph node and spleen cells from SIV uninfected ( n =9) or chronically SIV-infected rhesus macaques ( n =11) were analysed by flow cytometry. Representative examples of flow cytometry gating are shown. Of viable CD3 + CD8 - cells, follicular subsets were defined as CXCR5 + cells (F) and germinal centre subsets were defined as CXCR5 hi PD-1 hi cells (GC). Of these subsets, regulatory cells were defined as CD25 hi CD127 - . T FR (CXCR5 + CD25 hi CD127 - ) were Foxp3 + , whereas T FH (CXCR5 + CD25 lo/- ) were Foxp3 - . ( b ) The percentages of each rhesus macaque regulatory subset, as analysed in a are shown. ( c ) The ratios of each regulatory cell population to its non-regulatory cell counterpart are shown. ( d ) The percentage of total CTLA-4 expression is shown in SIV-uninfected ( n =9) and chronically SIV-infected ( n =8) rhesus macaques. The horizontal bars of each graph indicate the median value and are listed where appropriate for clarity. Statistical analyses were performed by Mann-Whitney (Wilcoxon) tests to compare unpaired, nonparametric values and significance is denoted by asterisks where * P
- Conjugate
- Yellow dye
- Submitted by
- Invitrogen Antibodies (provider)
- Main image
- Experimental details
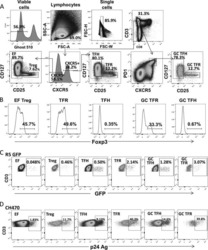
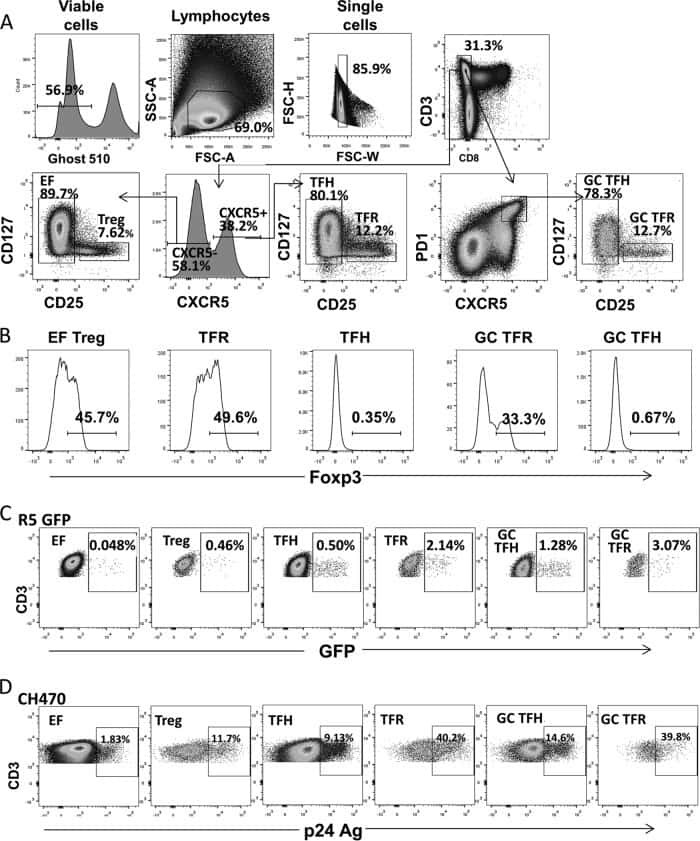
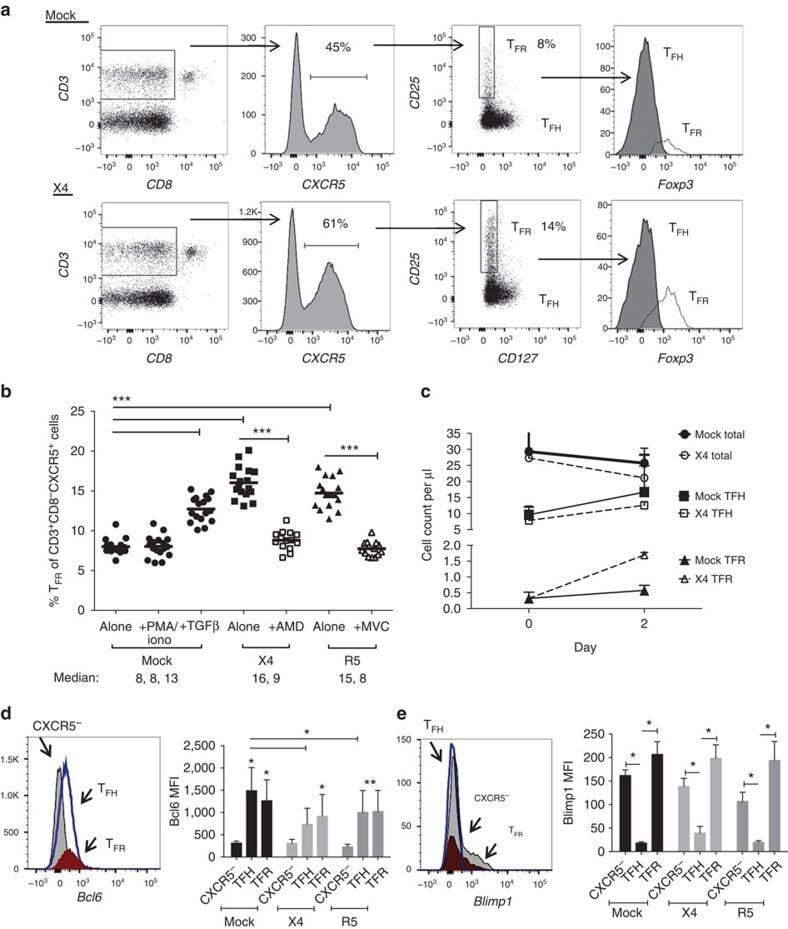
- Figure 3 HIV entry and replication promote T FR expansion. Disaggregated tonsil cells were spinoculated with X4 or R5 HIV and T FR populations were analysed by flow cytometry ( n =15). ( a ) A representative example of tonsil cell flow gating. From viable CD3 + CD8 - cells, T FR are defined as CXCR5 + and CD25 hi CD127 - . T FR cells contain Foxp3 + cells, whereas remaining T FH (CXCR5 + CD25 lo/- ) cells are Foxp3 - . ( b ) Percentages of T FR determined by gating strategies in a are shown. Experimental conditions include mock-spinoculated cells cultured with PMA (50 ng ml -1 ) and ionomycin (1 mug ml -1 ) or exogenous TGF-beta (100 ng ml -1 ) for 24 h and cells pretreated to block CXCR4 (AMD, 200 muM) and CCR5 (MVC, 2 muM). ( c ) Using flow cytometry counting beads, the number of cells per mul were determined for total (CD3 + CD8 - ), T FH (CXCR5 + CD25 lo/- ) and T FR (CXCR5 + CD25 hi CD127 - ) subsets in mock- and X4-spinoculated samples ( n =3). ( d ) Bcl-6 expression is shown in CXCR5- (grey), T FH (blue) and T FR (red) populations after mock-, X4- or R5-spinoculation ( n =5). ( e ) Blimp-1 expression was also determined as in d . The horizontal bars of each graph indicate the median value and are listed where appropriate for clarity. Statistical analyses were performed by Friedman nonparametric tests ( b , d , e ) and significance is denoted by asterisks where * P
- Conjugate
- Yellow dye
- Submitted by
- Invitrogen Antibodies (provider)
- Main image
- Experimental details
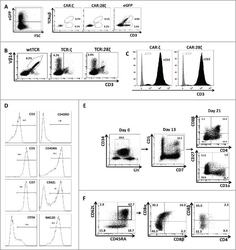
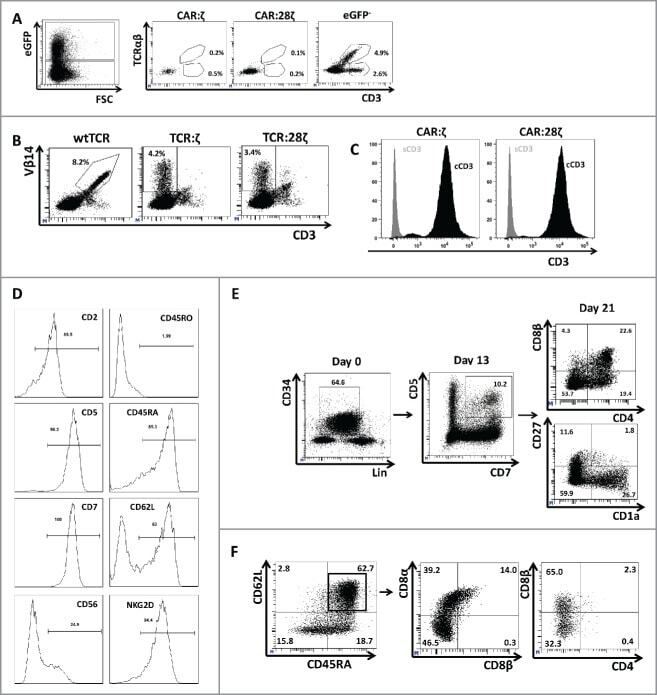
- Figure 3. Phenotype and endogenous TCR expression of CD34 + HPC-derived transgenic AR + T cells. Flow cytometric analysis of the AR-transgenic T cells. (A) CAR-transgenic GFP + cells of cultures transduced to express either the CAR:zeta or the CAR:28zeta were analyzed on day 26 of OP9-DL1 culture for CD3 and TCRalphabeta expression. As a control, GFP - cells are shown from the OP9-DL1 culture transduced to express the CAR:zeta ( N = 5). (B) Dot plots show CD3 expression of cells from the OP9-DL1 cultures transgenic for the wtTCR, TCR:zeta and TCR:28zeta. Vbeta14 staining is used to mark transgene expression, as no GFP is expressed by the transgenic cells ( N = 5). (C) Surface and cytoplasmic staining for CD3 of in vitro generated mature T cells that were expanded for one cycle on feeder cells in the presence of cytokines. (D) Expression of various membrane markers by the CD27 + CD1a - mature T cells at the end of OP9-DL1 culture (46 d) ( N = 2). (E) Day 0: fresh cord blood after MACS CD34 enrichment sorted using the sorting window shown. Day 13: cord blood cells cultured on OP9-DL1 were sorted for CD5 CD7 double positive cells, using the indicated sorting window. The cells were then transduced to express CAR:28zeta and further differentiated on OP9-DL1 feeder layer. Day 21: analysis of the transgenic GFP + cultured cells for DP cells and CD27 + CD1a - mature cells. (F) Flow cytometric analysis of GFP + CAR:28zeta-transgenic cultures, gated on GFP + CD27 + CD1a - mature AR + c
- Conjugate
- Yellow dye
- Submitted by
- Invitrogen Antibodies (provider)
- Main image
- Experimental details
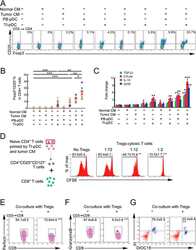
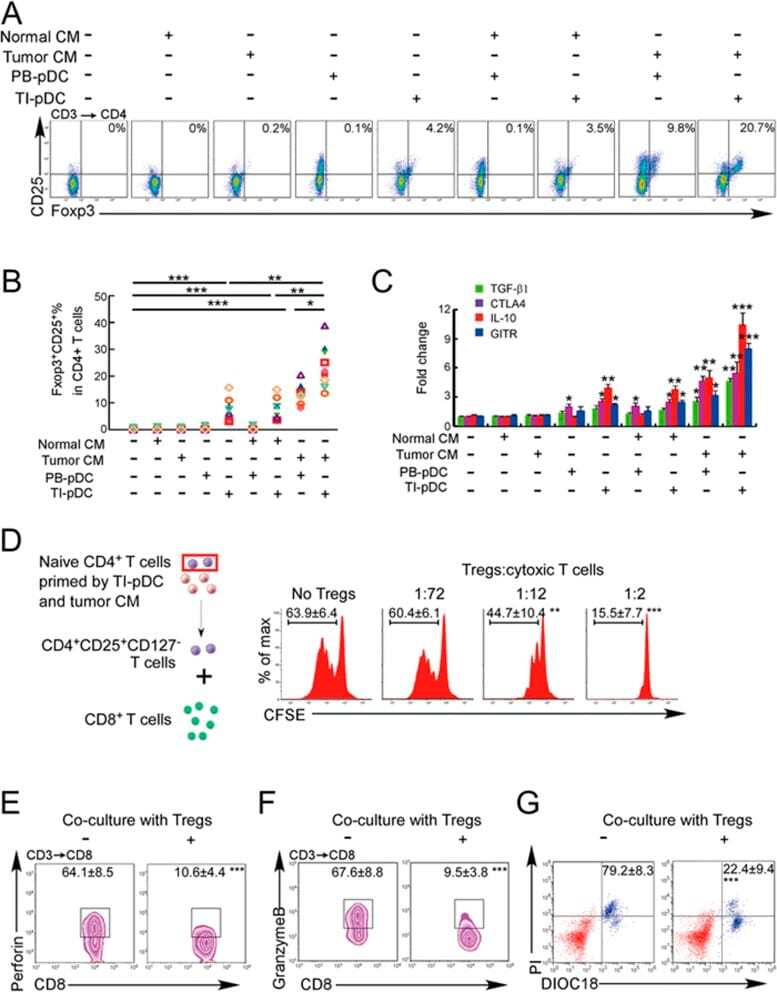
- Figure 3 Naive CD4 + T cells are converted to functional Tregs by tumor-infiltrating DCs and tumor conditioned medium (CM). (A-C) Naive CD4 + T cells from peripheral blood of patients with invasive breast carcinoma were co-cultured with or without autologous pDCs isolated from tumor (TI) or peripheral blood (PB) for 9 days in the presence or absence of 30% CM from autologous tumor slices or adjacent normal tissue slices. (A , B) Non-adherent cells from co-cultures were stained for CD3, CD4, CD25 and intracellular Foxp3, and analyzed by flow cytometry. Representative plots of gated CD3 + CD4 + cells (A) and quantification of percentage of Foxp3 + CD25 + cells among CD3 + CD4 + cells (B) are shown (mean +- SEM, n = 19; * P < 0.05, ** P < 0.01, *** P < 0.001 by Student's t -test). (C) Expression of Treg-associated genes, assessed by qRT-PCR normalized to GAPDH , in sorted CD4 + T cells, relative to expression in cultures without DCs or CM (mean +- SEM, n = 19; * P < 0.05, ** P < 0.01, *** P < 0.001 compared with naive CD4 + T cells cultured alone by Student's t -test). (D-G) Effect of naive CD4 + T cell-derived Tregs, obtained by co-culture with TI pDCs and tumor CM as above, on function of autologous tumor-specific CD8 + T cells. Tumor-specific CD8 + T cells were generated for each subject by stimulating autologous PB CD8 + T cells with autologous tumor lysate-pulsed autologous DCs. Tregs were recovered from co-cultures by magnetic sorting. (D) CFSE-labeled CD8 + T ce
- Conjugate
- Yellow dye
- Submitted by
- Invitrogen Antibodies (provider)
- Main image
- Experimental details
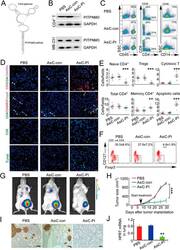
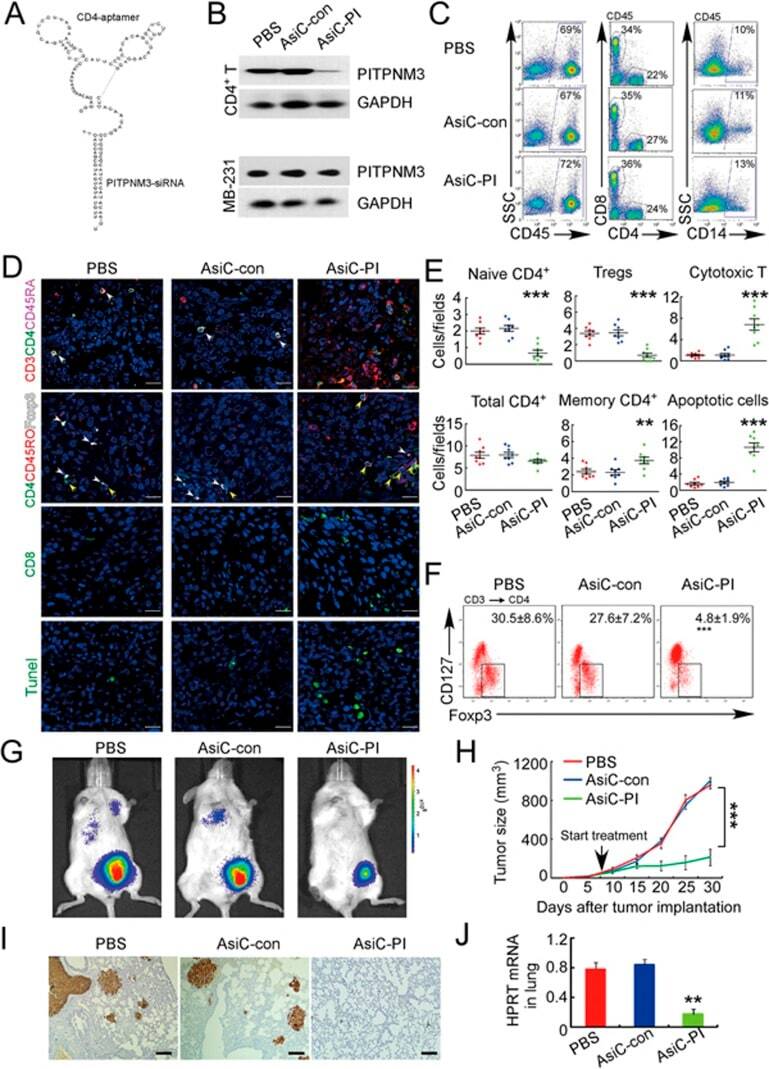
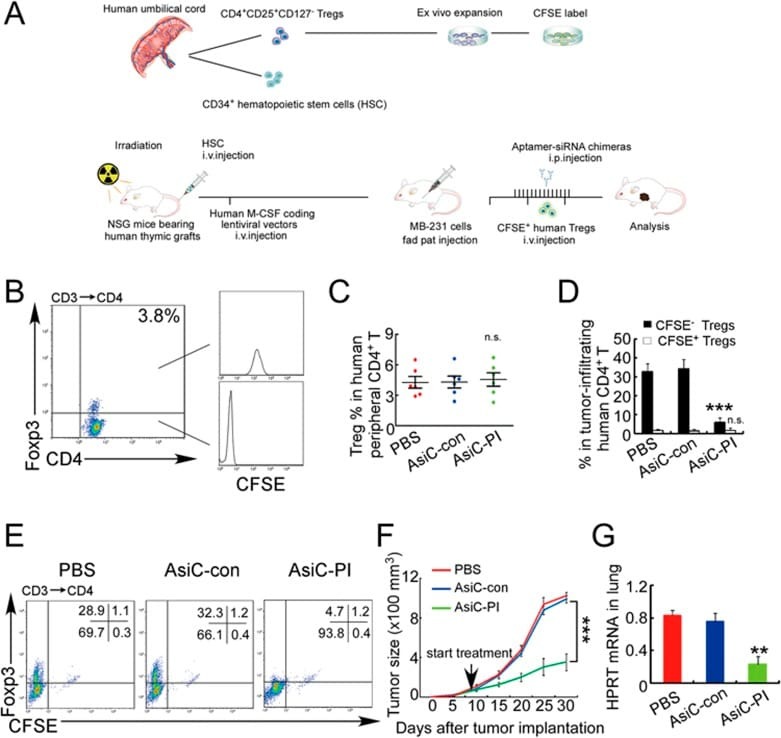
- Figure 6 In vivo knockdown of PITPNM3 in CD4 + T cells reverses immunosuppression and inhibits tumor progression in humanized mice. (A) Humanized mice bearing palpable MDA-MB-231 orthotopic xenografts were intraperitoneally injected daily for 14 days with PBS, 1 nmol CD4-aptamer-control siRNA (AsiC-con) or CD4-aptamer-siRNA targeting PITPNM3 (sequence in A , AsiC-PI) to assess the role of PITPNM3 in TI Tregs, and other T cells and tumor control. Experimental schematic is provided in Supplementary information, Figure S9A . (B) Representative immunoblots showing selective knockdown of PITPNM3 protein in PB CD4 + T cells, but not tumor xenografts ( n = 3). (C) PITPNM3 knockdown did not affect the distribution of human CD45 + hematopoietic cells, CD4 + and CD8 + T cells, and CD14 + monocytes in the peripheral blood of humanized mice. Representative flow plots are shown ( n = 3). (D , E) Effect of PITPNM3 knockdown on TI naive CD4 + , Tregs and CD8 + T cell numbers, and apoptosis by TUNEL assay in xenografts. D shows representative immunofluorescence microscopy images. Top row indicates CD4 + naive T cells by arrows; the second row indicates CD4 + CD45RO + Foxp3 - CD4 + memory T cells (yellow arrows) and Foxp3 + Tregs (white arrows). Scale bar, 50 mum. E shows number of cells of each subtype/high power field in eight mice ( ** P < 0.01, *** P < 0.001 compared to PBS group by Student's t -test). (F) Flow cytometry analysis of gated human CD3 + CD4 + cells isolated from xenogra
- Conjugate
- Yellow dye
- Submitted by
- Invitrogen Antibodies (provider)
- Main image
- Experimental details
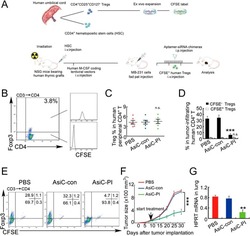
- Figure 7 CD4-aptamer-siRNA targeting PITPNM3 reduces TI Tregs and inhibits tumor progression in humanized mice with circulating human Tregs. Humanized mice, implanted with MDA-MB-231 tumors and concurrently injected intravenously with autologous Tregs, were intraperitoneally injected daily for 14 days after tumors became palpable with PBS, 1 nmol CD4-aptamer-control siRNA (AsiC-con) or CD4-aptamer-siRNA targeting PITPNM3 to assess the role of PITPNM3 in TI Tregs, and other T cells and tumor control. Tregs were administered every 10 days after the initial injection and mice were sacrificed 30 days after tumor cell inoculation. (A) Experimental schematic. (B , C) Peripheral blood cells of humanized mice were stained for human CD3, CD4 and Foxp3, and analyzed by flow cytometry. A representative flow plot (B) and the percentage (mean +- SEM) of PB CD4 + cells that are CFSE + Tregs in six mice per group (C) are shown. (D , E) Isolated cells from xenografts were stained for human CD3, CD4 and Foxp3. The percentage (mean +- SEM) of six mice per group (D) and representative flow plot (E) of FoxP3 + Tregs are shown. Most Tregs were CFSE - (i.e., did not come from infused Tregs) and the number of TI Tregs was reduced by knocking down PITPNM3 in CD4 + T cells ( *** P < 0.001 compared to the PBS group by Student's t -test). (F) Tumor size (mean +- SEM, n = 6 per group; *** P < 0.001 by two-way ANOVA with Bonferroni multiple comparison tests). (G) Lung metastases assessed by qRT-PCR
- Conjugate
- Yellow dye
- Submitted by
- Invitrogen Antibodies (provider)
- Main image

- Experimental details
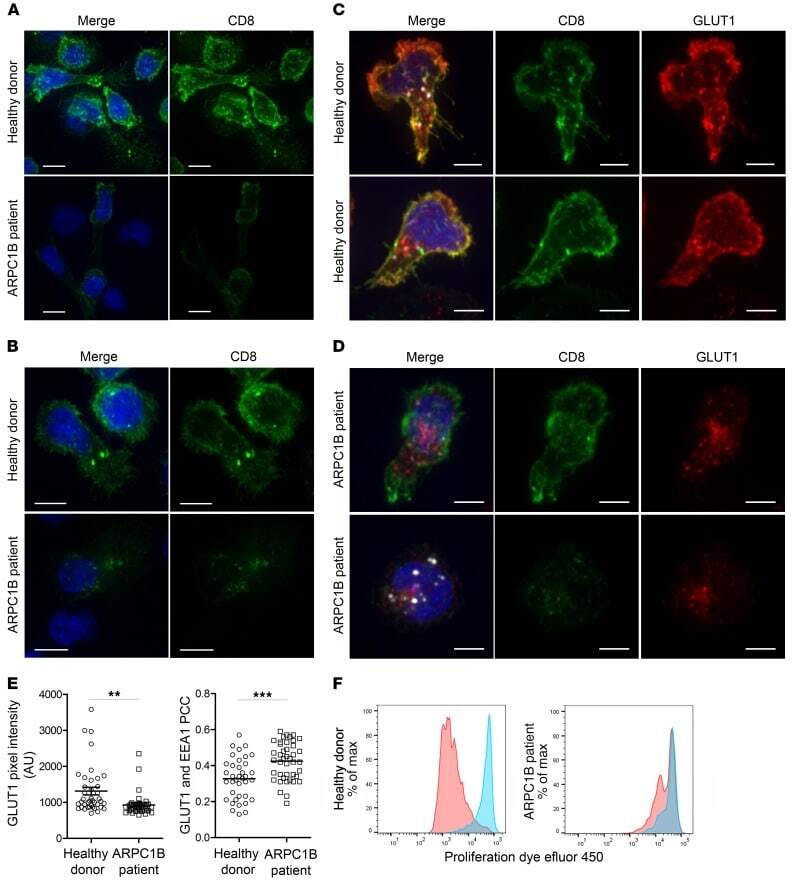
- Figure 7 Absence of ARPC1B alters surface expression of CD8 and GLUT1 in hCTLs. (A-D) HD and ARPC1B-deficient patient hCTLs were fixed in PFA for 20 minutes, permeabilized, and stained with an antibody against CD8 alone (green) ( A and B ) or in combination with anti-GLUT1 (red) and anti-EEA1 (white) antibodies ( C and D ). Images are 3D reconstructions of Z -stack. Scale bars: 4 mum. ( E ) Measurement of the mean intensity of GLUT1 expressed in AU and the degree of colocalization with EEA1 expressed as PCC (see Methods) in HD and ARPC1B-deficient patient hCTLs based on images as sampled in C and D . HD, n = 41 cells; ARPC1B-deficient patient, n = 38 cells. P < 0.005 (unpaired t test). ** P < 0.0013; *** P < 0.0002. ( F ) Flow cytometry analysis of the proliferation capacity of HD and ARPC1B-deficient patient hCTLs (gated on live CD8 + cells) in the absence (blue) or presence (red) of plate-bound anti-CD3 stimulation (1 mug/mL). All data are representative of 3 independent experiments.
- Conjugate
- Yellow dye
- Submitted by
- Invitrogen Antibodies (provider)
- Main image
- Experimental details
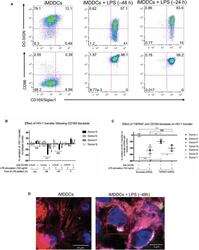
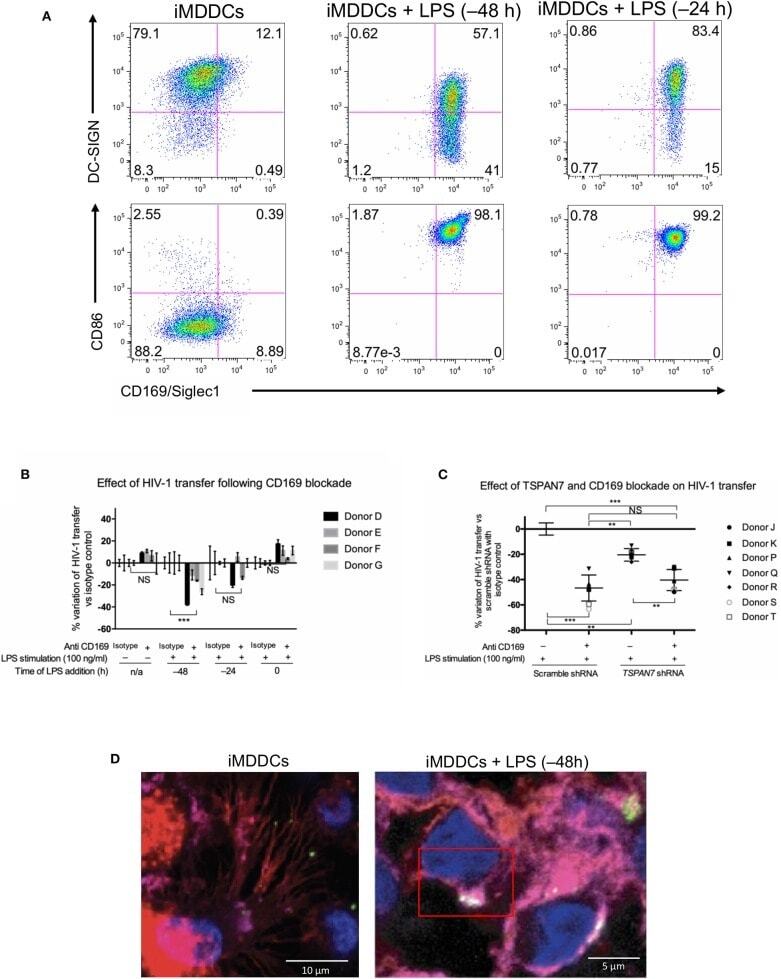
- Figure 5 CD169, as an HIV-1 receptor, mostly impacts transfer from mature MDDCs rather than immature MDDCs. (A) Flow cytometry plots showing CD86, DC-SIGN, and CD169 expression levels on MDDCs (pre-gated on SSC FSC, living cells, CD3 - cells and singlets). Panels show the expression of these proteins in iMDDCs (left panel) and MDDCs with LPS pretreatment at 100 ng/ml for 48 or 24 h before co-culture (middle and right panels, respectively). (B) Percentage of variation of HIV-1 transfer when using iMDDCs or LPS-treated MDDCs (100 ng/ml LPS for different lengths of time) incubated with a blocking antibody against CD169 as compared to an isotype control for each condition. Results are displayed for 4 different blood donors with the mean +- SD of technical triplicates. (C) Percent of variation in HIV-1 transfer to assess the impact of blocking CD169 and TSPAN7 knockdown as compared to scramble shRNA on MDDCs matured with LPS for 48 h treated by an isotype control. Mean +- SD of seven different blood donors in 4 experiments. (B,C) NS, not significant. ** p < 0.01; *** p < 0.001. (D) Confocal microscopy images of iMDDCs (left panel) and mature MDDCs (mMDDCs) right panel, to assess the degree of colocalization between CD169 (magenta) and incoming X4-HIV-1-Gag-iGFP (green). Actin filaments and nuclei were stained with phalloidin (red) and DAPI (blue). Four hundred nanometers of Z-stacks were taken 40 h after the start of the co-culture with CD4 + T cells and X4-HIV-1-Gag-iGFP. The pic
- Conjugate
- Yellow dye
- Submitted by
- Invitrogen Antibodies (provider)
- Main image
- Experimental details
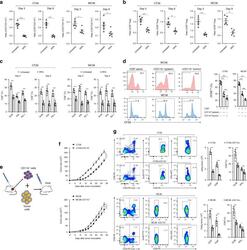
- Fig. 5 Infiltrating myeloid cells inhibit T cell functionality in residual tumors. a Flow cytometric analysis of CD11b + , CD3 + and the ratio of CD3 + /CD11b + in the untreated and iRFA-treated CT26 and MC38 tumors on day 3 and day 9 ( n = 5). b Flow cytometric analysis of CD8 + and CD4 + FoxP3 + cells and the ratio of CD8 + /CD4 + FoxP3 + in the untreated and iRFA-treated CT26 and MC38 tumors on day 3 and day 9 ( n = 5). c Flow cytometric analysis and quantification of granzyme B, IFN-gammaand PD-1 expression in CD8 + cells in the untreated and iRFA-treated CT26 and MC38 tumors on day 3 and day 9 ( n = 5). d In vitro suppressive activity of tumor-infiltrating CD11b + cells purified from spleen or CT26 residual tumors on day 3 after iRFA. Representative histograms of CD8 + T cell proliferation at a ratio of 1:1 CD8 + to CD11b + T cells and percent CD8 + T cell proliferation ( n = 5). e - g CD11b + cells isolated from the residual tumor were mixed with CT26 or MC38 tumor cells and transferred into recipient mice. e Adoptive transfer method. f Growth curve of tumor (one-sided ANOVA test, *** P < 0.001, n = 5). g Flow cytometric analysis and quantification of CD3 + CD8 + cells (gate on single live cells) and Granzyme B expression and IFN-gamma on CD8 + cells ( n = 5). Data represent cumulative results from 1/2 independent experiments with 5 mice/group. The data are represented as mean +- SEM. Statistical differences between pairs of groups
- Conjugate
- Yellow dye

- Submitted by
- Invitrogen Antibodies (provider)
- Main image
- Experimental details
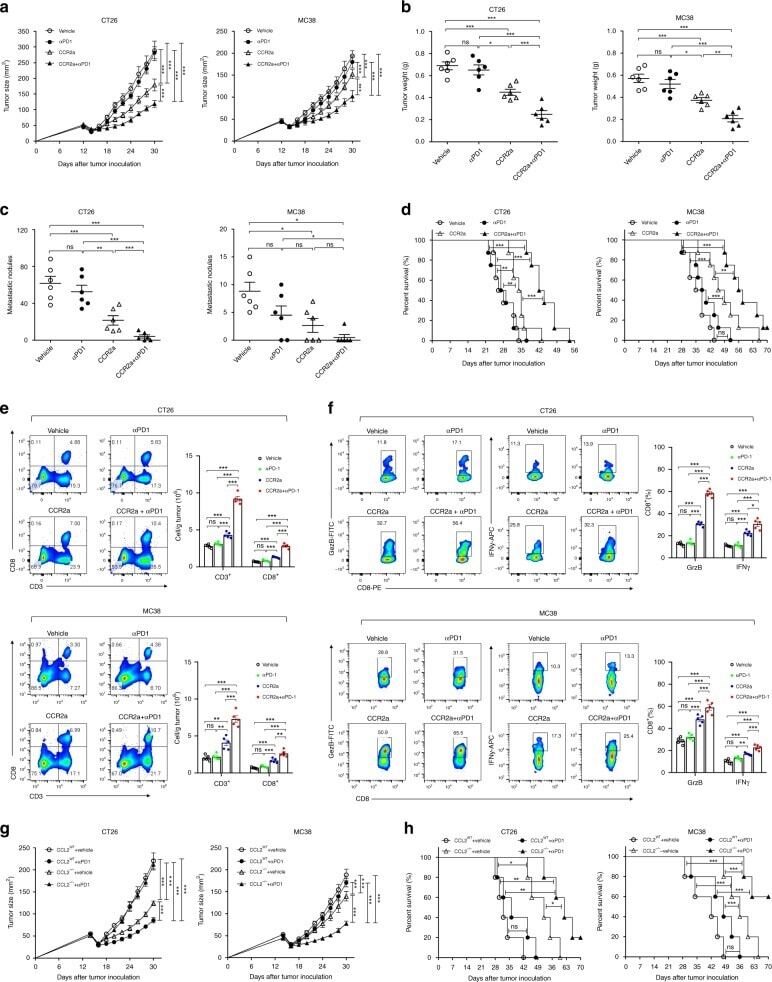
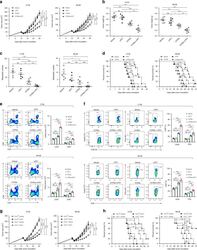
- Fig. 8 CCL2/CCR2 blockade inhibits tumor progression and overcomes resistance to anti-PD-1 therapy. a - f iRFA treatment was performed in CT26 and MC38 colon cancer models as shown in Fig. 2a . Anti-PD-1 mAb (200 mug, clone: J43) was administered through intraperitoneal injection to mice every 3 days for a total of four times. The CCR2 antagonist (CCR2a) (RS504393, Tocris) was given subcutaneously at a dose of 5 mg/kg twice per day for 9 days. a Growth curve of the CT26 and MC38 residual tumor (one-sided ANOVA test, n = 8). b The weight of the residual CT26 and MC38 tumor examined on day 14 after iRFA by dissection of the mice ( n = 6). c The number of metastases examined on day 14 after iRFA by dissection the mice ( n = 6). d Kaplan-Meier survival curves are shown, and the log-rank test was performed ( n = 8). e Flow cytometric analysis and quantification of CD3 + and CD8 + infiltration (gate on single live cells) in residual CT26 tumors. f Granzyme B and IFNgamma expression on CD8 + cells in residual CT26 tumors. (gate on CD8 + cells) ( n = 5). g , h iRFA treatment was performed in mice bearing wild type and CCL2 -/- CT26 or MC38 tumor. g Growth curve of the CT26 and MC38 residual tumor (one-sided ANOVA test, n = 5). h Kaplan-Meier survival curves are shown, and the log-rank test was performed ( n = 8). Data represent results from 1/2 independent experiments. The data are represented as mean +- SEM. Statistical differences between pairs o
- Conjugate
- Yellow dye