Explore
 Validate
 Learn
Learn Flow cytometry
Antibody data
- Antibody Data
- Antigen structure
- References [29]
- Comments [0]
- Validations
- Flow cytometry [1]
- Other assay [14]
Submit
Validation data
Reference
Comment
Report error
- Product number
- 48-0038-82 - Provider product page

- Provider
- Invitrogen Antibodies
- Product name
- CD3 Monoclonal Antibody (UCHT1), eFluor™ 450, eBioscience™
- Antibody type
- Monoclonal
- Antigen
- Other
- Description
- Description: The UCHT1 monoclonal antibody reacts with human CD3e, a 20 kDa subunit of the TCR complex. Along with the other CD3 subunits gamma and delta, the epsilon chain is required for proper assembly, trafficking and surface expression of the TCR complex. CD3 is expressed by thymocytes in a developmentally regulated manner and by all mature T cells. Crosslinking of TCR via immobilized UCHT1 initiates an intracellular biochemical pathway resulting in cellular activation and proliferation.
- Antibody clone number
- UCHT1
- Concentration
- 0.2 mg/mL
Submitted references Aberrant gut-microbiota-immune-brain axis development in premature neonates with brain damage.
Dendritic Cell Maturation Regulates TSPAN7 Function in HIV-1 Transfer to CD4(+) T Lymphocytes.
Single-cell transcriptomics reveals regulators underlying immune cell diversity and immune subtypes associated with prognosis in nasopharyngeal carcinoma.
Skewed T cell responses to Epstein-Barr virus in long-term asymptomatic kidney transplant recipients.
Inflammation induced by incomplete radiofrequency ablation accelerates tumor progression and hinders PD-1 immunotherapy.
Loss of ARPC1B impairs cytotoxic T lymphocyte maintenance and cytolytic activity.
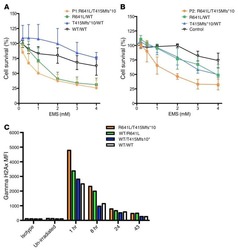
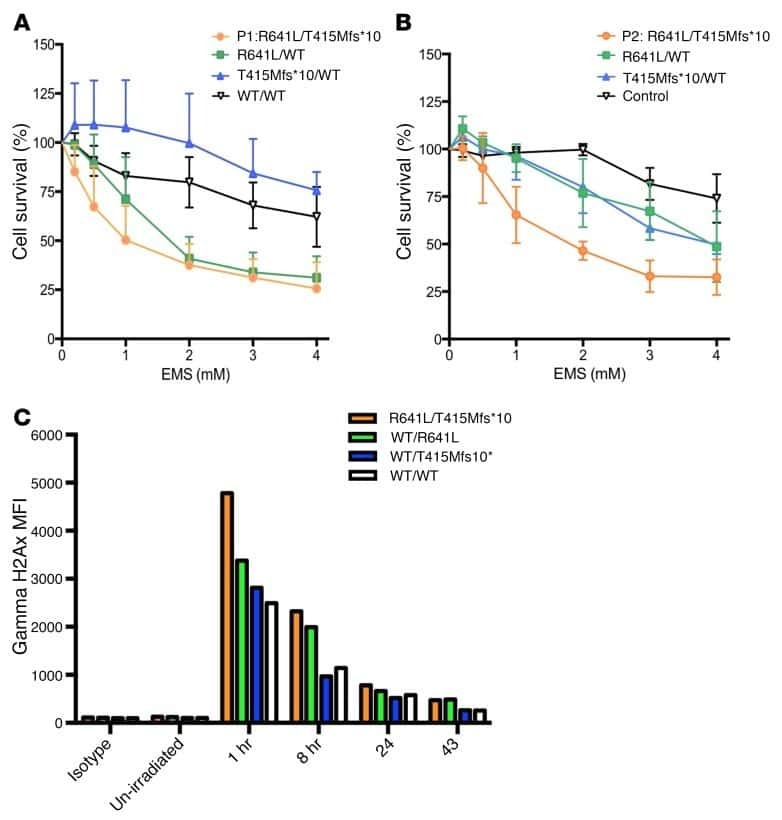
Biallelic mutations in DNA ligase 1 underlie a spectrum of immune deficiencies.
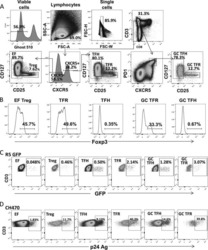
Follicular Regulatory T Cells Are Highly Permissive to R5-Tropic HIV-1.
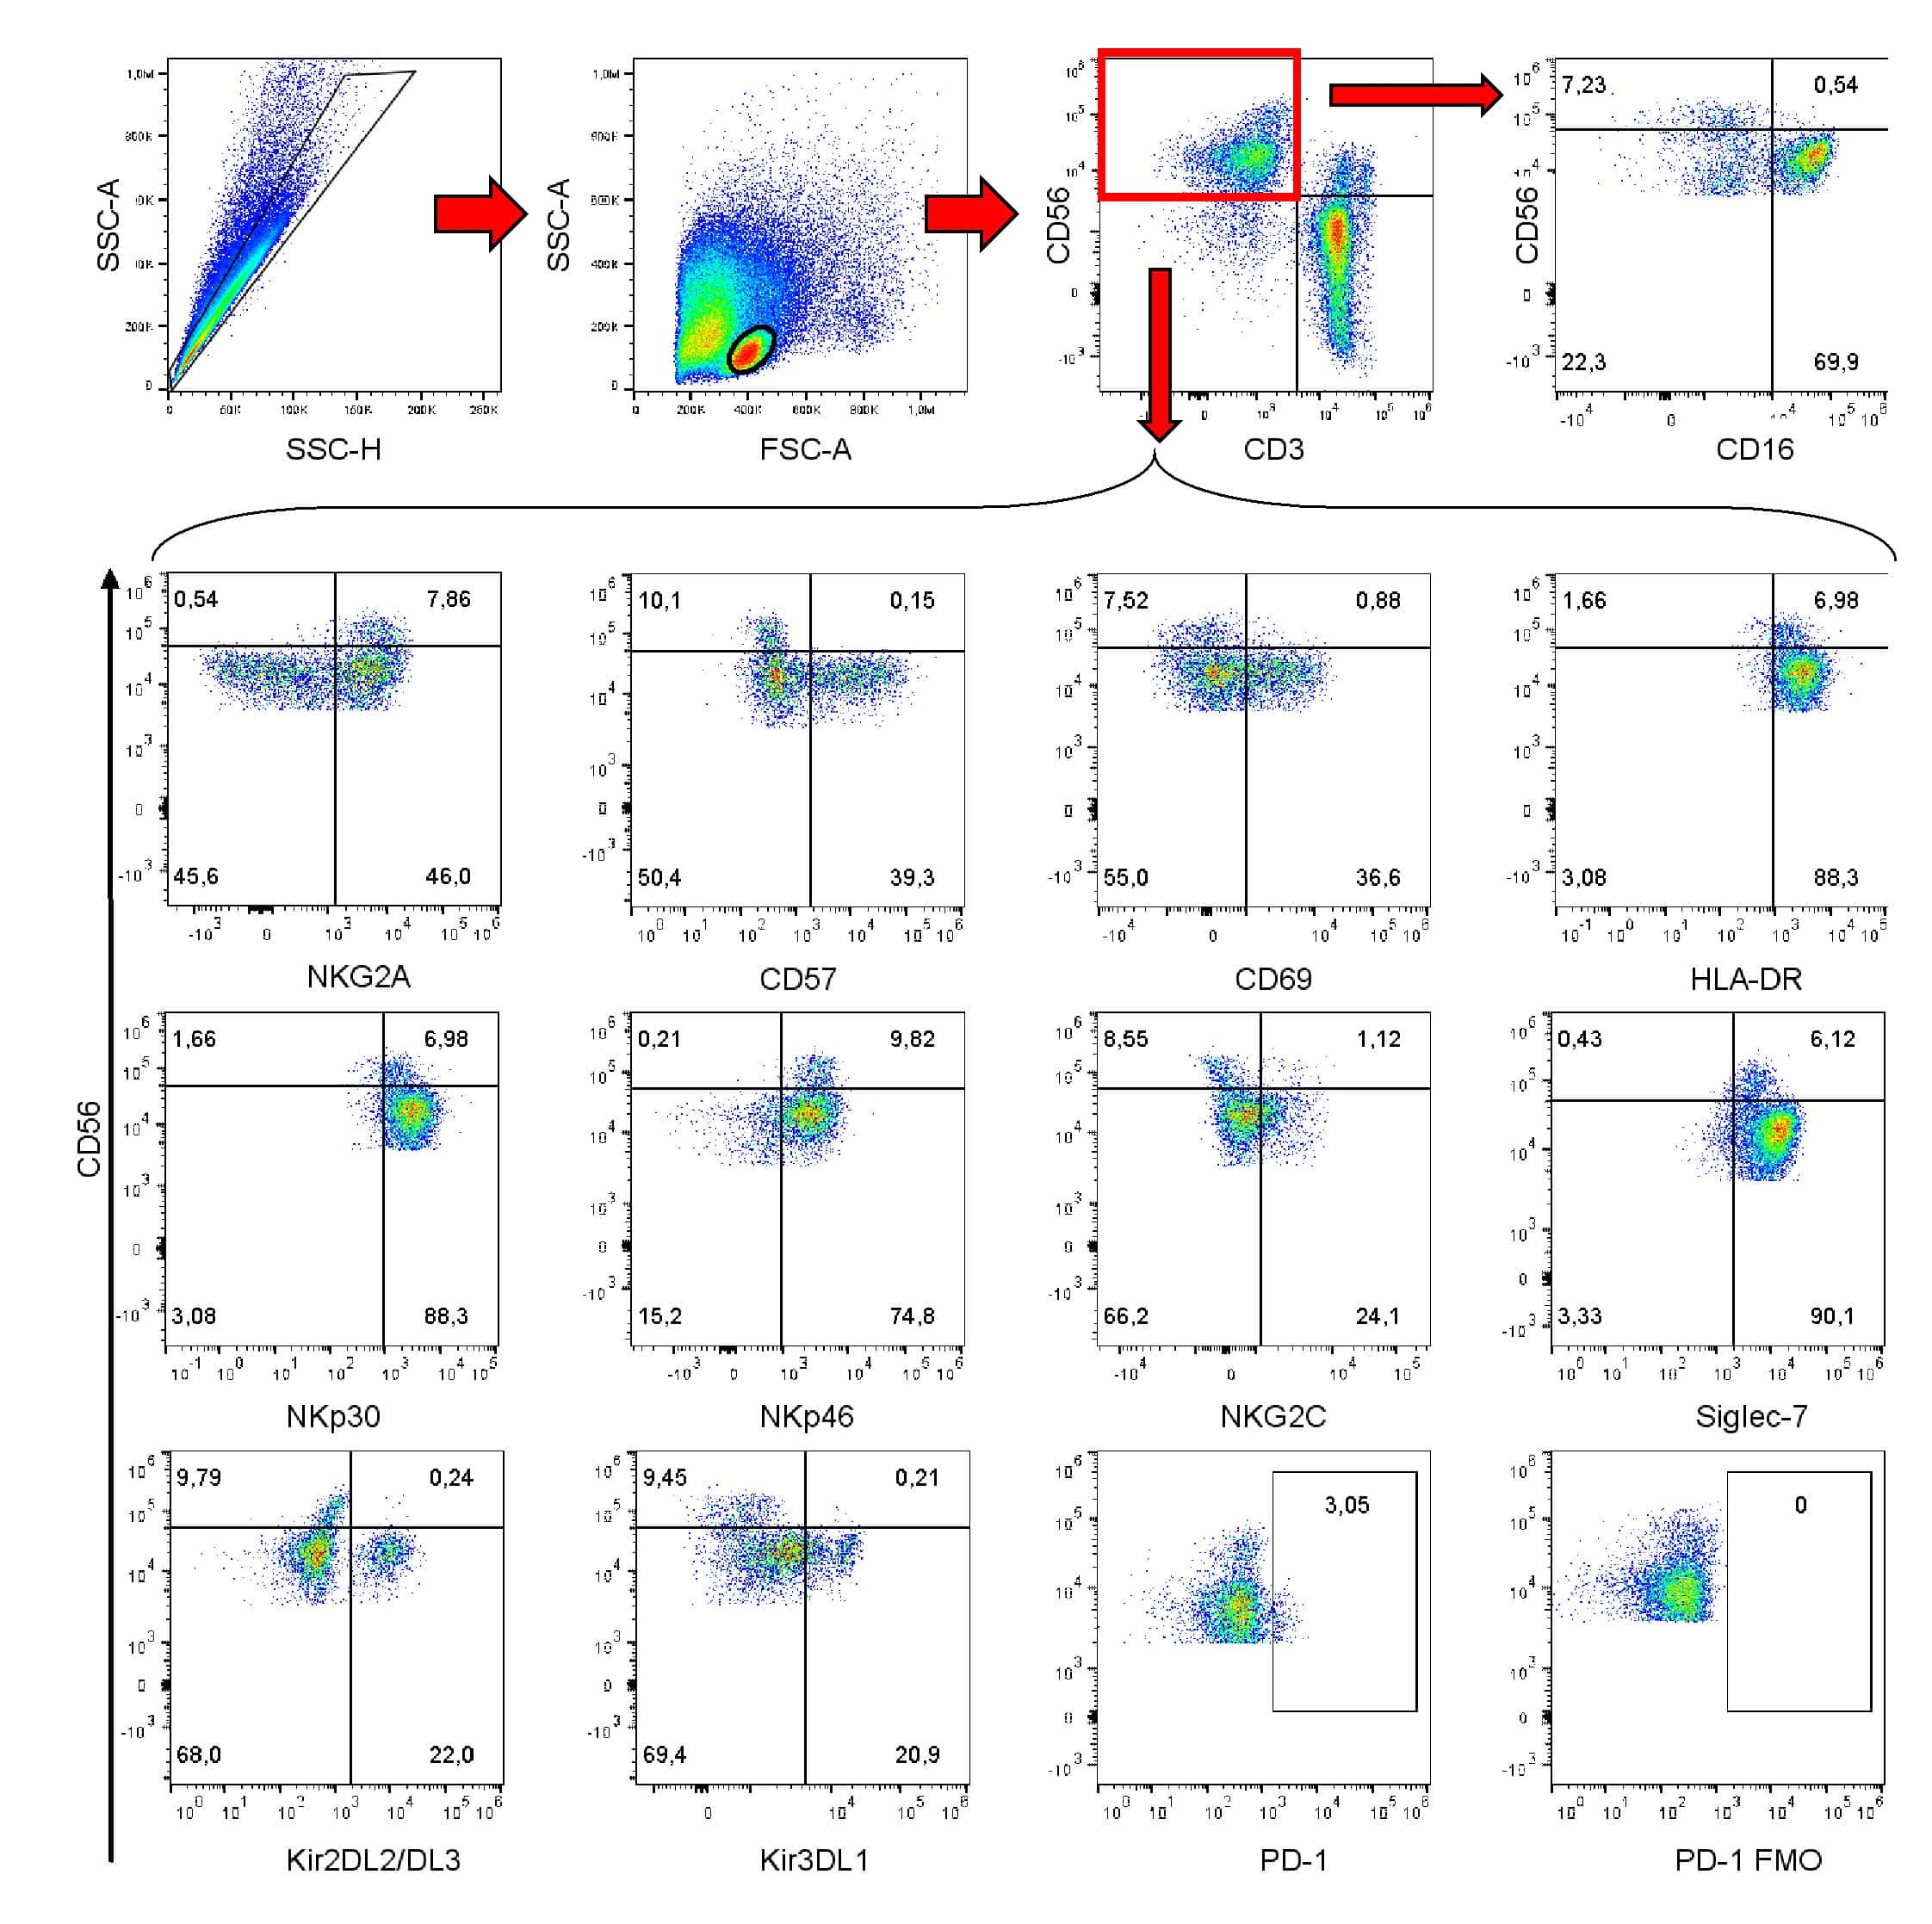
Eomesodermin and T-bet mark developmentally distinct human natural killer cells.
Blocking the recruitment of naive CD4(+) T cells reverses immunosuppression in breast cancer.
Failure recovery of circulating NKG2D(+)CD56(dim)NK cells in HBV-associated hepatocellular carcinoma after hepatectomy predicts early recurrence.
MAIT cells are activated during human viral infections.
Interaction among activated lymphocytes and mesenchymal cells through podoplanin is critical for a high IL-17 secretion.
Vitamin D deficiency contributes to the reduction and impaired function of naïve CD45RA⁺ regulatory T cell in chronic heart failure.
Follicular regulatory T cells impair follicular T helper cells in HIV and SIV infection.
CD8+ T Cells Can Mediate Short-Term Protection against Heterotypic Dengue Virus Reinfection in Mice.
Antitumor immunity triggered by melphalan is potentiated by melanoma cell surface-associated calreticulin.
A truncation variant of the cation channel P2RX5 is upregulated during T cell activation.
Monocyte-activation phenotypes are associated with biomarkers of inflammation and coagulation in chronic HIV infection.
Evidence for innate immune system activation in HIV type 1-infected elite controllers.
Decreases in colonic and systemic inflammation in chronic HIV infection after IL-7 administration.
Human mesenchymal stromal cells modulate T-cell responses through TNF-α-mediated activation of NF-κB.
Children with asthma by school age display aberrant immune responses to pathogenic airway bacteria as infants.
ROS-induced autophagy in cancer cells assists in evasion from determinants of immunogenic cell death.
Comprehensive analysis of dengue virus-specific responses supports an HLA-linked protective role for CD8+ T cells.
Memory T cells in latent Mycobacterium tuberculosis infection are directed against three antigenic islands and largely contained in a CXCR3+CCR6+ Th1 subset.
Ribavirin Does Not Impair the Suppressive Activity of Foxp3(+)CD4(+)CD25(+) Regulatory T Cells.
Characterization of Th17 responses to Streptococcus pneumoniae in humans: comparisons between adults and children in a developed and a developing country.
Expansion of regulatory T cells in patients with Langerhans cell histiocytosis.
Seki D, Mayer M, Hausmann B, Pjevac P, Giordano V, Goeral K, Unterasinger L, Klebermaß-Schrehof K, De Paepe K, Van de Wiele T, Spittler A, Kasprian G, Warth B, Berger A, Berry D, Wisgrill L
Cell host & microbe 2021 Oct 13;29(10):1558-1572.e6
Cell host & microbe 2021 Oct 13;29(10):1558-1572.e6
Dendritic Cell Maturation Regulates TSPAN7 Function in HIV-1 Transfer to CD4(+) T Lymphocytes.
Perot BP, García-Paredes V, Luka M, Ménager MM
Frontiers in cellular and infection microbiology 2020;10:70
Frontiers in cellular and infection microbiology 2020;10:70
Single-cell transcriptomics reveals regulators underlying immune cell diversity and immune subtypes associated with prognosis in nasopharyngeal carcinoma.
Chen YP, Yin JH, Li WF, Li HJ, Chen DP, Zhang CJ, Lv JW, Wang YQ, Li XM, Li JY, Zhang PP, Li YQ, He QM, Yang XJ, Lei Y, Tang LL, Zhou GQ, Mao YP, Wei C, Xiong KX, Zhang HB, Zhu SD, Hou Y, Sun Y, Dean M, Amit I, Wu K, Kuang DM, Li GB, Liu N, Ma J
Cell research 2020 Nov;30(11):1024-1042
Cell research 2020 Nov;30(11):1024-1042
Skewed T cell responses to Epstein-Barr virus in long-term asymptomatic kidney transplant recipients.
Nakid-Cordero C, Arzouk N, Gauthier N, Tarantino N, Larsen M, Choquet S, Burrel S, Autran B, Vieillard V, Guihot A
PloS one 2019;14(10):e0224211
PloS one 2019;14(10):e0224211
Inflammation induced by incomplete radiofrequency ablation accelerates tumor progression and hinders PD-1 immunotherapy.
Shi L, Wang J, Ding N, Zhang Y, Zhu Y, Dong S, Wang X, Peng C, Zhou C, Zhou L, Li X, Shi H, Wu W, Long X, Wu C, Liao W
Nature communications 2019 Nov 28;10(1):5421
Nature communications 2019 Nov 28;10(1):5421
Loss of ARPC1B impairs cytotoxic T lymphocyte maintenance and cytolytic activity.
Randzavola LO, Strege K, Juzans M, Asano Y, Stinchcombe JC, Gawden-Bone CM, Seaman MN, Kuijpers TW, Griffiths GM
The Journal of clinical investigation 2019 Dec 2;129(12):5600-5614
The Journal of clinical investigation 2019 Dec 2;129(12):5600-5614
Biallelic mutations in DNA ligase 1 underlie a spectrum of immune deficiencies.
Maffucci P, Chavez J, Jurkiw TJ, O'Brien PJ, Abbott JK, Reynolds PR, Worth A, Notarangelo LD, Felgentreff K, Cortes P, Boisson B, Radigan L, Cobat A, Dinakar C, Ehlayel M, Ben-Omran T, Gelfand EW, Casanova JL, Cunningham-Rundles C
The Journal of clinical investigation 2018 Dec 3;128(12):5489-5504
The Journal of clinical investigation 2018 Dec 3;128(12):5489-5504
Follicular Regulatory T Cells Are Highly Permissive to R5-Tropic HIV-1.
Miller SM, Miles B, Guo K, Folkvord J, Meditz AL, McCarter MD, Levy DN, MaWhinney S, Santiago ML, Connick E
Journal of virology 2017 Sep 1;91(17)
Journal of virology 2017 Sep 1;91(17)
Eomesodermin and T-bet mark developmentally distinct human natural killer cells.
Collins A, Rothman N, Liu K, Reiner SL
JCI insight 2017 Mar 9;2(5):e90063
JCI insight 2017 Mar 9;2(5):e90063
Blocking the recruitment of naive CD4(+) T cells reverses immunosuppression in breast cancer.
Su S, Liao J, Liu J, Huang D, He C, Chen F, Yang L, Wu W, Chen J, Lin L, Zeng Y, Ouyang N, Cui X, Yao H, Su F, Huang JD, Lieberman J, Liu Q, Song E
Cell research 2017 Apr;27(4):461-482
Cell research 2017 Apr;27(4):461-482
Failure recovery of circulating NKG2D(+)CD56(dim)NK cells in HBV-associated hepatocellular carcinoma after hepatectomy predicts early recurrence.
Gao J, Duan Z, Zhang L, Huang X, Long L, Tu J, Liang H, Zhang Y, Shen T, Lu F
Oncoimmunology 2016;5(1):e1048061
Oncoimmunology 2016;5(1):e1048061
MAIT cells are activated during human viral infections.
van Wilgenburg B, Scherwitzl I, Hutchinson EC, Leng T, Kurioka A, Kulicke C, de Lara C, Cole S, Vasanawathana S, Limpitikul W, Malasit P, Young D, Denney L, STOP-HCV consortium, Moore MD, Fabris P, Giordani MT, Oo YH, Laidlaw SM, Dustin LB, Ho LP, Thompson FM, Ramamurthy N, Mongkolsapaya J, Willberg CB, Screaton GR, Klenerman P
Nature communications 2016 Jun 23;7:11653
Nature communications 2016 Jun 23;7:11653
Interaction among activated lymphocytes and mesenchymal cells through podoplanin is critical for a high IL-17 secretion.
Noack M, Ndongo-Thiam N, Miossec P
Arthritis research & therapy 2016 Jun 23;18:148
Arthritis research & therapy 2016 Jun 23;18:148
Vitamin D deficiency contributes to the reduction and impaired function of naïve CD45RA⁺ regulatory T cell in chronic heart failure.
Ma YH, Zhou YL, Yue CY, Zhang GH, Deng L, Xie GH, Xu WP, Shen LS
Journal of immunology research 2015;2015:547697
Journal of immunology research 2015;2015:547697
Follicular regulatory T cells impair follicular T helper cells in HIV and SIV infection.
Miles B, Miller SM, Folkvord JM, Kimball A, Chamanian M, Meditz AL, Arends T, McCarter MD, Levy DN, Rakasz EG, Skinner PJ, Connick E
Nature communications 2015 Oct 20;6:8608
Nature communications 2015 Oct 20;6:8608
CD8+ T Cells Can Mediate Short-Term Protection against Heterotypic Dengue Virus Reinfection in Mice.
Zellweger RM, Tang WW, Eddy WE, King K, Sanchez MC, Shresta S
Journal of virology 2015 Jun;89(12):6494-505
Journal of virology 2015 Jun;89(12):6494-505
Antitumor immunity triggered by melphalan is potentiated by melanoma cell surface-associated calreticulin.
Dudek-Perić AM, Ferreira GB, Muchowicz A, Wouters J, Prada N, Martin S, Kiviluoto S, Winiarska M, Boon L, Mathieu C, van den Oord J, Stas M, Gougeon ML, Golab J, Garg AD, Agostinis P
Cancer research 2015 Apr 15;75(8):1603-14
Cancer research 2015 Apr 15;75(8):1603-14
A truncation variant of the cation channel P2RX5 is upregulated during T cell activation.
Abramowski P, Ogrodowczyk C, Martin R, Pongs O
PloS one 2014;9(9):e104692
PloS one 2014;9(9):e104692
Monocyte-activation phenotypes are associated with biomarkers of inflammation and coagulation in chronic HIV infection.
Wilson EM, Singh A, Hullsiek KH, Gibson D, Henry WK, Lichtenstein K, Önen NF, Kojic E, Patel P, Brooks JT, Sereti I, Baker JV, Study to Understand the Natural History of HIV/AIDS in the Era of Effective Therapy (SUN Study) Investigators
The Journal of infectious diseases 2014 Nov 1;210(9):1396-406
The Journal of infectious diseases 2014 Nov 1;210(9):1396-406
Evidence for innate immune system activation in HIV type 1-infected elite controllers.
Krishnan S, Wilson EM, Sheikh V, Rupert A, Mendoza D, Yang J, Lempicki R, Migueles SA, Sereti I
The Journal of infectious diseases 2014 Mar;209(6):931-9
The Journal of infectious diseases 2014 Mar;209(6):931-9
Decreases in colonic and systemic inflammation in chronic HIV infection after IL-7 administration.
Sereti I, Estes JD, Thompson WL, Morcock DR, Fischl MA, Croughs T, Beq S, Lafaye de Micheaux S, Yao MD, Ober A, Wilson EM, Natarajan V, Imamichi H, Boulassel MR, Lederman MM, Routy JP
PLoS pathogens 2014 Jan;10(1):e1003890
PLoS pathogens 2014 Jan;10(1):e1003890
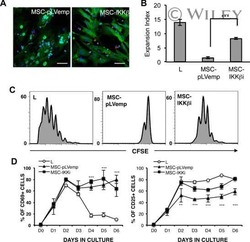
Human mesenchymal stromal cells modulate T-cell responses through TNF-α-mediated activation of NF-κB.
Dorronsoro A, Ferrin I, Salcedo JM, Jakobsson E, Fernández-Rueda J, Lang V, Sepulveda P, Fechter K, Pennington D, Trigueros C
European journal of immunology 2014 Feb;44(2):480-8
European journal of immunology 2014 Feb;44(2):480-8
Children with asthma by school age display aberrant immune responses to pathogenic airway bacteria as infants.
Larsen JM, Brix S, Thysen AH, Birch S, Rasmussen MA, Bisgaard H
The Journal of allergy and clinical immunology 2014 Apr;133(4):1008-13
The Journal of allergy and clinical immunology 2014 Apr;133(4):1008-13
ROS-induced autophagy in cancer cells assists in evasion from determinants of immunogenic cell death.
Garg AD, Dudek AM, Ferreira GB, Verfaillie T, Vandenabeele P, Krysko DV, Mathieu C, Agostinis P
Autophagy 2013 Sep;9(9):1292-307
Autophagy 2013 Sep;9(9):1292-307
Comprehensive analysis of dengue virus-specific responses supports an HLA-linked protective role for CD8+ T cells.
Weiskopf D, Angelo MA, de Azeredo EL, Sidney J, Greenbaum JA, Fernando AN, Broadwater A, Kolla RV, De Silva AD, de Silva AM, Mattia KA, Doranz BJ, Grey HM, Shresta S, Peters B, Sette A
Proceedings of the National Academy of Sciences of the United States of America 2013 May 28;110(22):E2046-53
Proceedings of the National Academy of Sciences of the United States of America 2013 May 28;110(22):E2046-53
Memory T cells in latent Mycobacterium tuberculosis infection are directed against three antigenic islands and largely contained in a CXCR3+CCR6+ Th1 subset.
Lindestam Arlehamn CS, Gerasimova A, Mele F, Henderson R, Swann J, Greenbaum JA, Kim Y, Sidney J, James EA, Taplitz R, McKinney DM, Kwok WW, Grey H, Sallusto F, Peters B, Sette A
PLoS pathogens 2013 Jan;9(1):e1003130
PLoS pathogens 2013 Jan;9(1):e1003130
Ribavirin Does Not Impair the Suppressive Activity of Foxp3(+)CD4(+)CD25(+) Regulatory T Cells.
Lee J, Choi YS, Shin EC
Immune network 2013 Feb;13(1):25-9
Immune network 2013 Feb;13(1):25-9
Characterization of Th17 responses to Streptococcus pneumoniae in humans: comparisons between adults and children in a developed and a developing country.
Lundgren A, Bhuiyan TR, Novak D, Kaim J, Reske A, Lu YJ, Qadri F, Malley R
Vaccine 2012 Jun 6;30(26):3897-907
Vaccine 2012 Jun 6;30(26):3897-907
Expansion of regulatory T cells in patients with Langerhans cell histiocytosis.
Senechal B, Elain G, Jeziorski E, Grondin V, Patey-Mariaud de Serre N, Jaubert F, Beldjord K, Lellouch A, Glorion C, Zerah M, Mary P, Barkaoui M, Emile JF, Boccon-Gibod L, Josset P, Debré M, Fischer A, Donadieu J, Geissmann F
PLoS medicine 2007 Aug;4(8):e253
PLoS medicine 2007 Aug;4(8):e253
No comments: Submit comment
Supportive validation
- Submitted by
- Invitrogen Antibodies (provider)
- Main image

- Experimental details
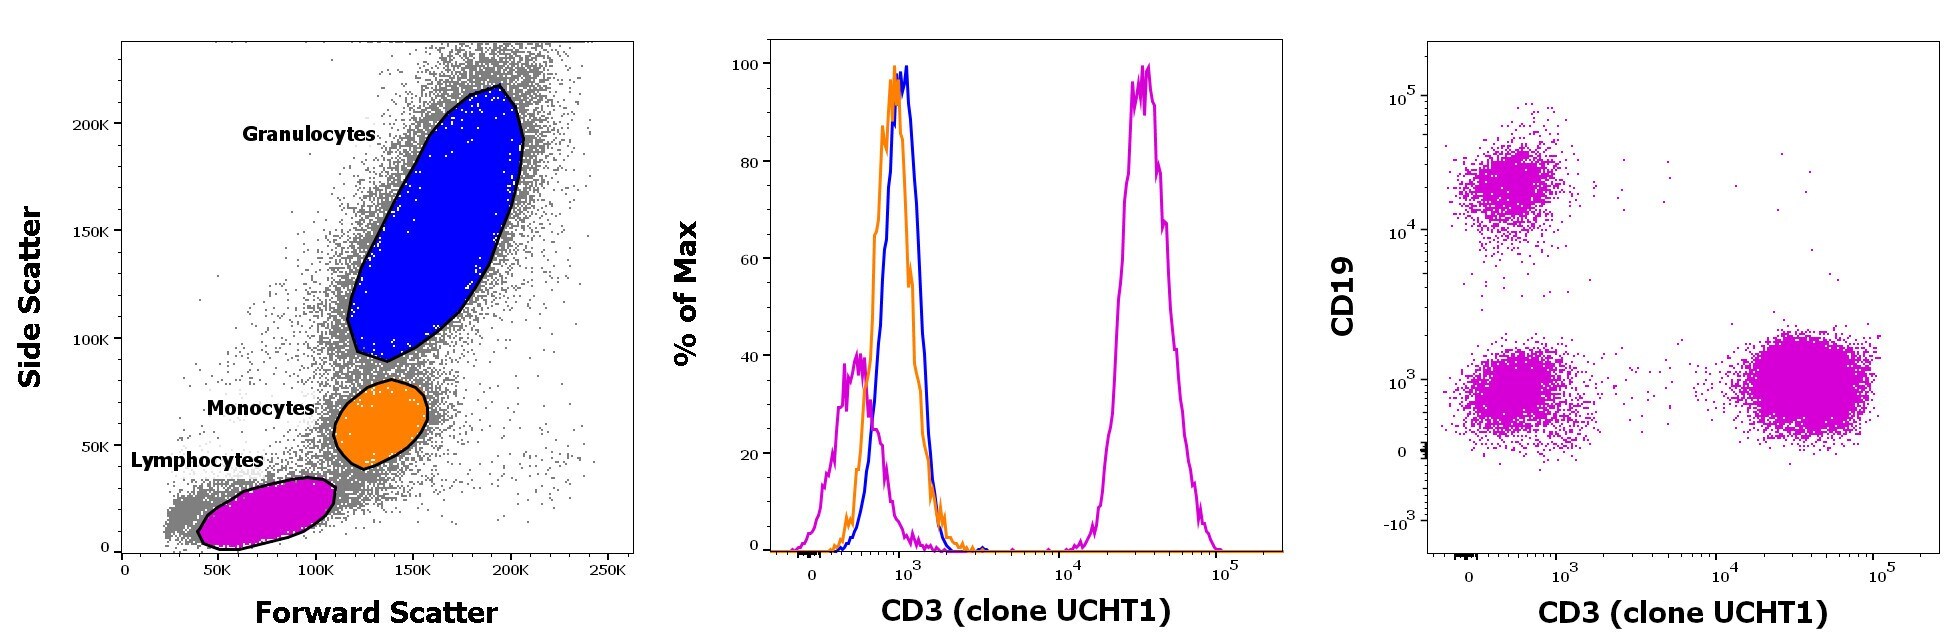
- Staining of human peripheral blood mononuclear cells with CD45 PE, CD19 APC and CD3 eFluor 450. As expected based on known relative expression patterns, CD3 clone UCHT1 stains a subset of lymphocytes (pink), but not monocytes (orange) and granulocytes (blue).
Supportive validation
- Submitted by
- Invitrogen Antibodies (provider)
- Main image
- Experimental details
- NULL

- Submitted by
- Invitrogen Antibodies (provider)
- Main image
- Experimental details
- NULL
- Submitted by
- Invitrogen Antibodies (provider)
- Main image
- Experimental details
- NULL
- Submitted by
- Invitrogen Antibodies (provider)
- Main image
- Experimental details
- NULL
- Submitted by
- Invitrogen Antibodies (provider)
- Main image

- Experimental details
- NULL
- Submitted by
- Invitrogen Antibodies (provider)
- Main image
- Experimental details
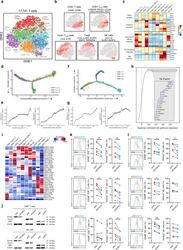
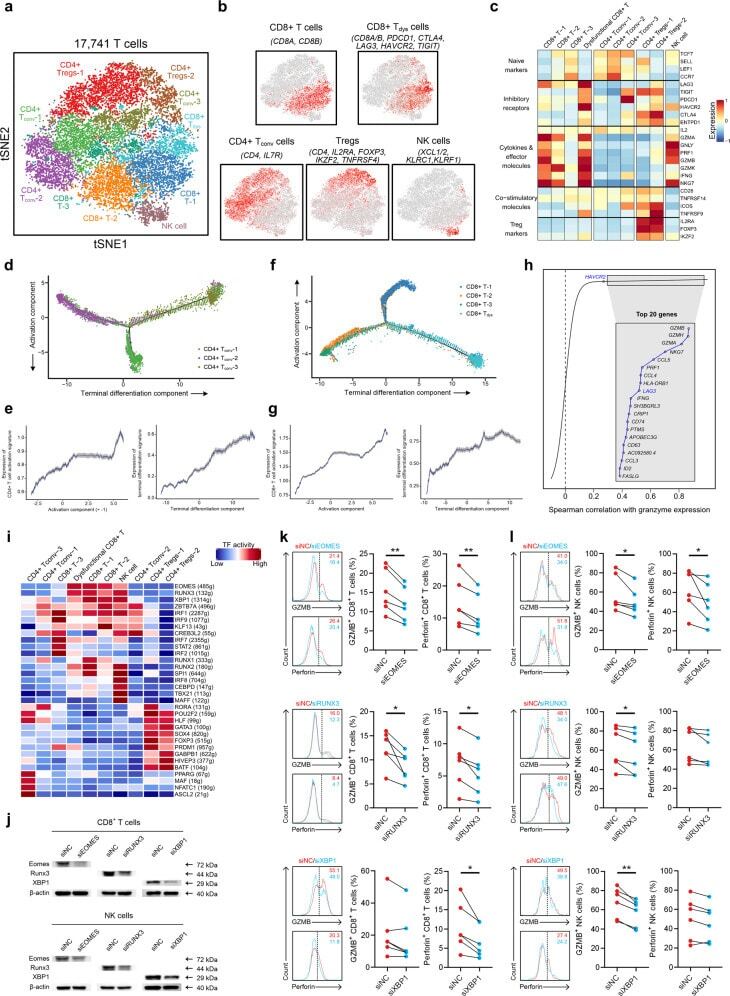
- Fig. 4 T/NK cell clusters in NPC. a t-SNE plot showing 10 clusters of 17,263 T/NK cells (indicated by colors). b t-SNE plot, color coding for the expression of the marker genes (gray to red) for the indicated cell subtypes. c Average expression of selected T cell function-associated genes of naive markers, inhibitory receptors, cytokines and effector molecules, co-stimulatory molecules, and Treg markers in each cell cluster. d Potential developmental trajectory of CD4 + T cells ( n = 5694) inferred by analysis with Monocle 2. Arrows show the increasing directions of certain CD4 + T cell properties annotated with the signatures shown in e . e Traceplots of (left) CD4 + T cell activation signature along activation component and (right) terminal differentiation signature along terminal differentiation component for the CD4 + T cells. Cells are projected along the component, with the blue line indicating the moving average of the expression of signatures (a sliding window of length equal to 5% of the total number of CD4 + T cells was used), and the shaded area displaying SEM. Signatures used are presented in Supplementary information, Table S9 . f Potential developmental trajectory of CD8 + T cells ( n = 6975) inferred by analysis with Monocle 2. Arrows show the increasing directions of certain CD8 + T cell properties annotated with the signatures shown in g . g Traceplots (as in e ) of (left) CD8 + T cell activation signature along activation component and (right) terminal diffe
- Submitted by
- Invitrogen Antibodies (provider)
- Main image
- Experimental details
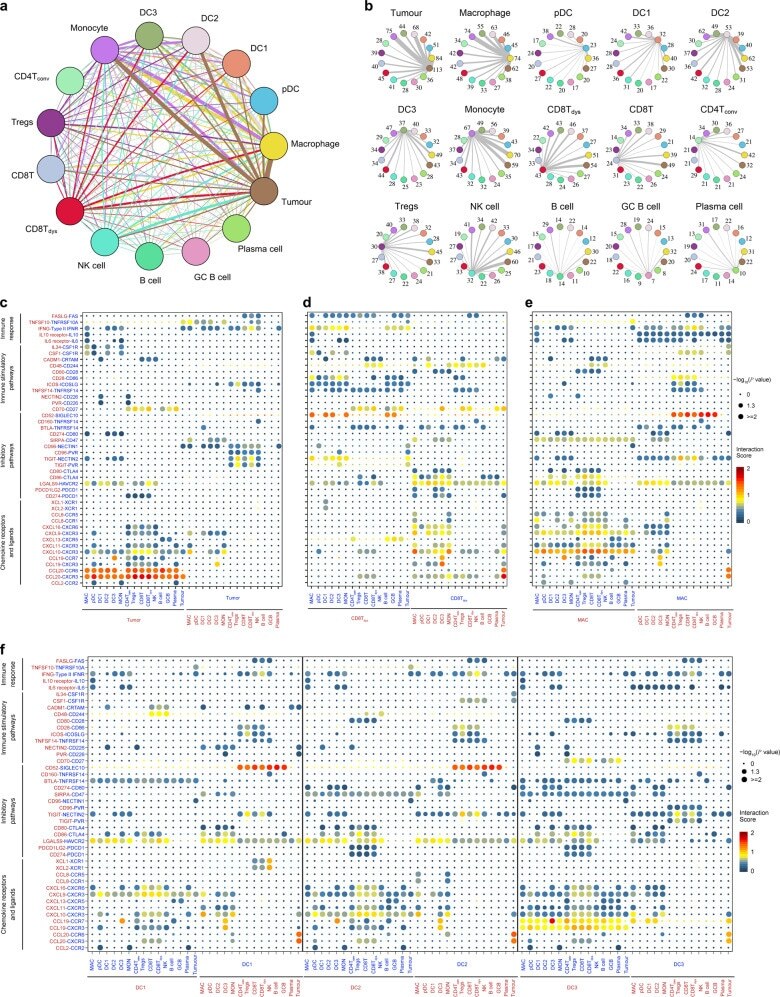
- Fig. 6 The dense network and multiple regulatory immune responses in the TME of NPC. a Capacity for intercellular communication between malignant cells and immune cells. Each line color indicates the ligands expressed by the cell population represented in the same color (labeled). The lines connect to the cell types that express the cognate receptors. The line thickness is proportional to the number of ligands when cognate receptors are present in the recipient cell type. The loops indicate autocrine circuits. The map quantifies potential communication but does not account for the anatomical locations or boundaries of the cell types. b Detailed view of the ligands expressed by each major cell type and the cells expressing the cognate receptors primed to receive the signal. Numbers indicate the quantity of ligand-receptor pairs for each intercellular link. c - f Overview of selected ligand-receptor interactions of tumor cells ( c ), dysfunctional CD8 + T cells ( d ), macrophages ( e ), and the three types of DCs ( f , DC1, DC2, and DC3). P values are indicated by circle size, with the scale to the right (permutation test). The means of the average expression levels of interacting molecule 1 in cluster 1 and interacting molecule 2 in cluster 2 are indicated by color. Assays were carried out at the mRNA level but were used to extrapolate protein interactions. CD4T conv , conventional CD4 + T cell; CD8T, CD8 + T cell; CD8T dys , dysfunctional CD8 + T cell; DC, dendritic cell; GCB
- Submitted by
- Invitrogen Antibodies (provider)
- Main image

- Experimental details
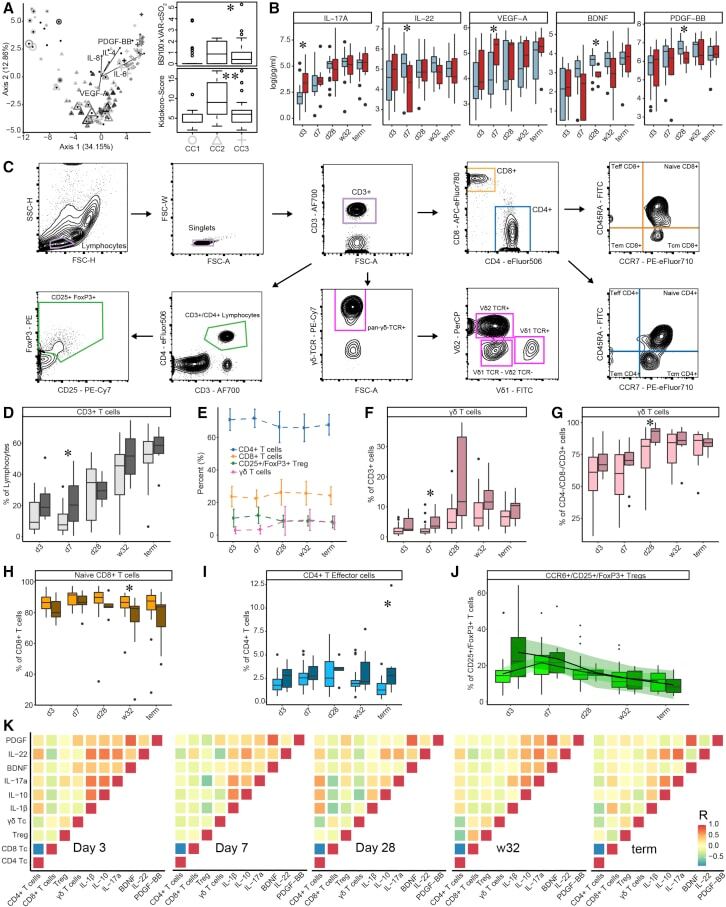
- Figure 2 T cell ontogenesis in extremely premature infants with and without severe brain injury (A) Principal coordinates analysis (PCoA)--biplot of sequestered cytokine and chemokine composition. Silhouette scoring identified 3 main cyto-Clusters (as indicated by different symbols). The shade of the symbols (gray to black) is determined by days post-delivery--the older the infant the darker the symbol. The size of the symbols is determined by the Kidokoro Score as assessed at term-equivalent age via cMRI--the higher the score the larger the symbol. Significantly correlated (p < 0.05) cytokines/chemokines are plotted as arrows. In addition, box plots next to PCoA show the range of combined values for burst suppression and variance of cranial oxygenation (BS/100 x VAR-cSO 2 ), as well as the range of Kidokoro Scores in the respective cyto-clusters (cyto-cluster 1, CC1; cyto-cluster 2, CC2; cyto-cluster 3, CC3). (B) Blood cytokine/chemokine concentrations in infants with (red) and without (blue) severe BI (3 days post-delivery, d3; 7 days post-delivery, d7; 28 days post-delivery, d28; 32 weeks of gestational age, w32; term-equivalent age = term). (C) Representative images illustrating the gating strategy for FACS analysis. Differently colored gates mark gating for respective cell populations. Magenta, untargeted; blue, T helper cells; orange, cytotoxic T cells; green, T regulatory cells; pink, gammadelta T cells. For box plots in (D) and (F-J), darker shade represents data from
- Submitted by
- Invitrogen Antibodies (provider)
- Main image
- Experimental details
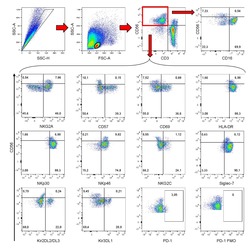
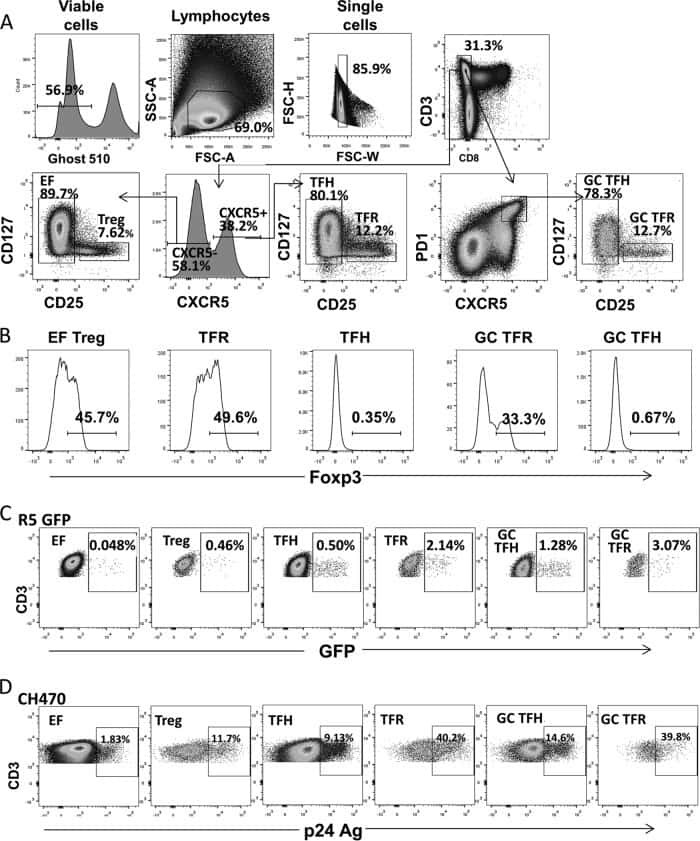
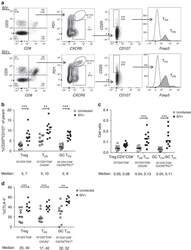
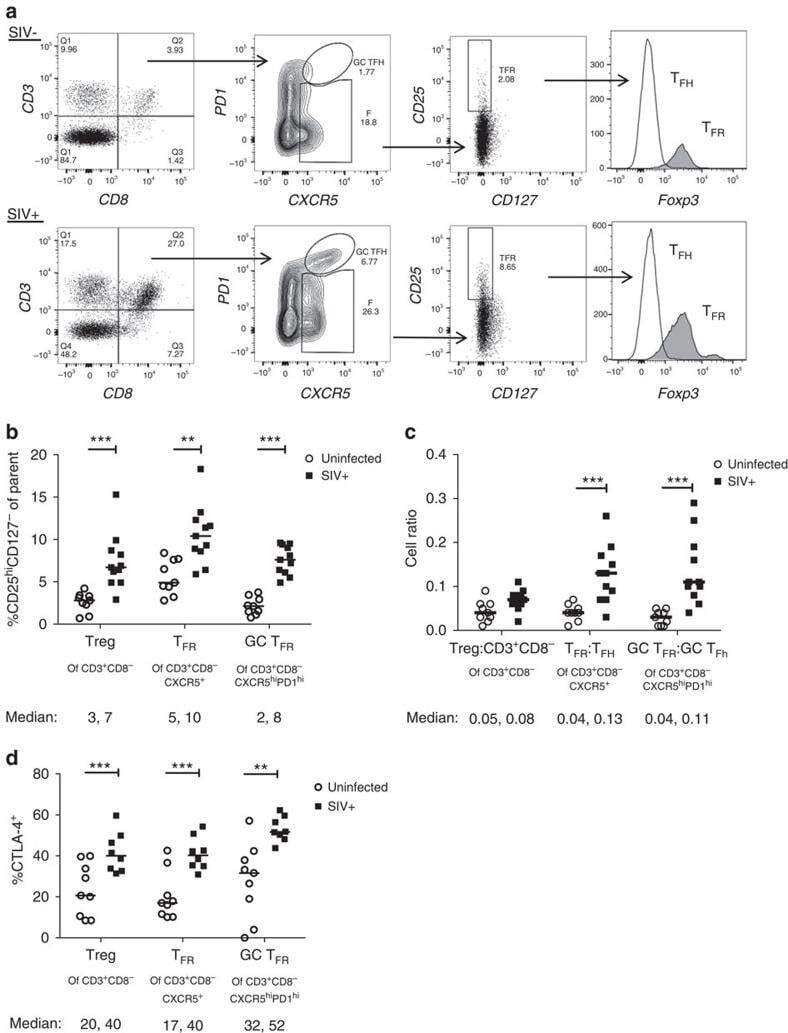
- Figure 2 T FR expansion in lymphoid tissues during chronic SIV infection. ( a ) Disaggregated lymph node and spleen cells from SIV uninfected ( n =9) or chronically SIV-infected rhesus macaques ( n =11) were analysed by flow cytometry. Representative examples of flow cytometry gating are shown. Of viable CD3 + CD8 - cells, follicular subsets were defined as CXCR5 + cells (F) and germinal centre subsets were defined as CXCR5 hi PD-1 hi cells (GC). Of these subsets, regulatory cells were defined as CD25 hi CD127 - . T FR (CXCR5 + CD25 hi CD127 - ) were Foxp3 + , whereas T FH (CXCR5 + CD25 lo/- ) were Foxp3 - . ( b ) The percentages of each rhesus macaque regulatory subset, as analysed in a are shown. ( c ) The ratios of each regulatory cell population to its non-regulatory cell counterpart are shown. ( d ) The percentage of total CTLA-4 expression is shown in SIV-uninfected ( n =9) and chronically SIV-infected ( n =8) rhesus macaques. The horizontal bars of each graph indicate the median value and are listed where appropriate for clarity. Statistical analyses were performed by Mann-Whitney (Wilcoxon) tests to compare unpaired, nonparametric values and significance is denoted by asterisks where * P
- Submitted by
- Invitrogen Antibodies (provider)
- Main image

- Experimental details
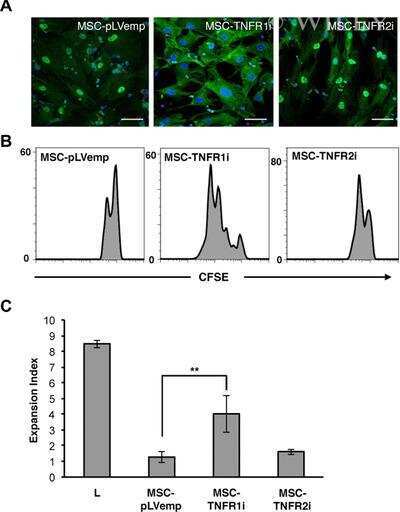
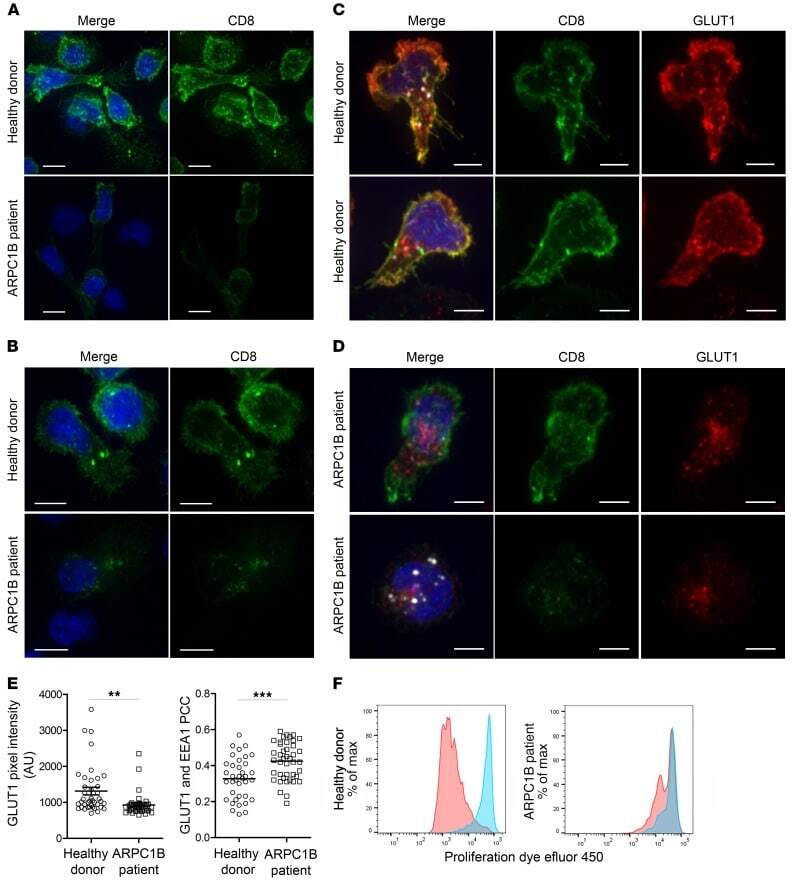
- Figure 7 Absence of ARPC1B alters surface expression of CD8 and GLUT1 in hCTLs. (A-D) HD and ARPC1B-deficient patient hCTLs were fixed in PFA for 20 minutes, permeabilized, and stained with an antibody against CD8 alone (green) ( A and B ) or in combination with anti-GLUT1 (red) and anti-EEA1 (white) antibodies ( C and D ). Images are 3D reconstructions of Z -stack. Scale bars: 4 mum. ( E ) Measurement of the mean intensity of GLUT1 expressed in AU and the degree of colocalization with EEA1 expressed as PCC (see Methods) in HD and ARPC1B-deficient patient hCTLs based on images as sampled in C and D . HD, n = 41 cells; ARPC1B-deficient patient, n = 38 cells. P < 0.005 (unpaired t test). ** P < 0.0013; *** P < 0.0002. ( F ) Flow cytometry analysis of the proliferation capacity of HD and ARPC1B-deficient patient hCTLs (gated on live CD8 + cells) in the absence (blue) or presence (red) of plate-bound anti-CD3 stimulation (1 mug/mL). All data are representative of 3 independent experiments.
- Submitted by
- Invitrogen Antibodies (provider)
- Main image
- Experimental details
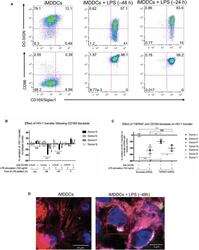
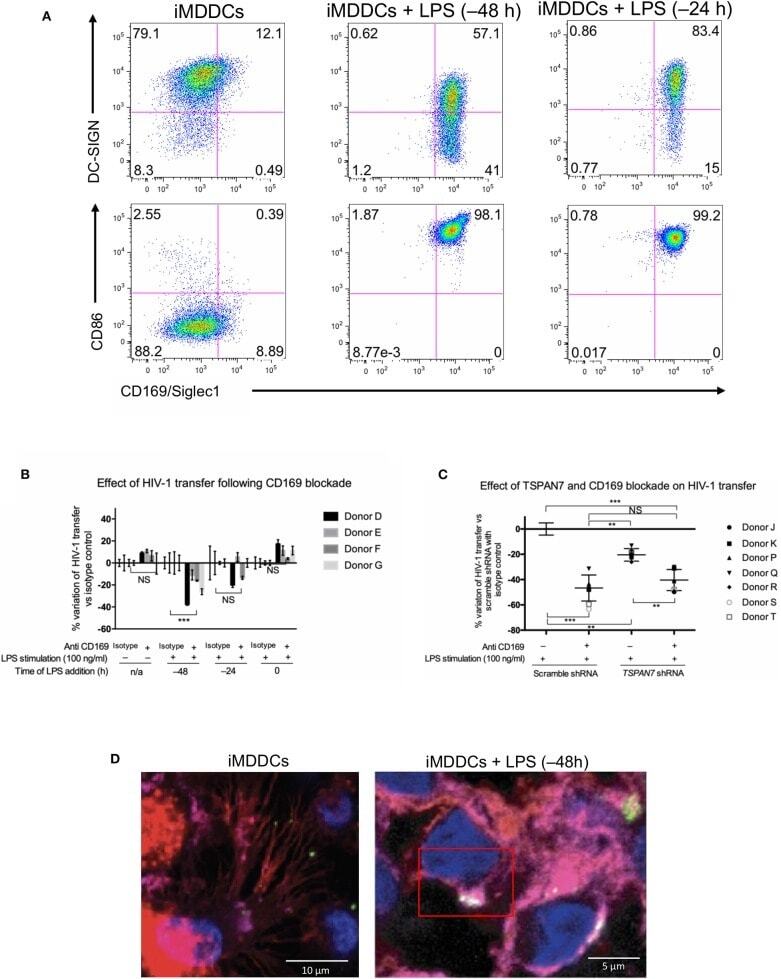
- Figure 5 CD169, as an HIV-1 receptor, mostly impacts transfer from mature MDDCs rather than immature MDDCs. (A) Flow cytometry plots showing CD86, DC-SIGN, and CD169 expression levels on MDDCs (pre-gated on SSC FSC, living cells, CD3 - cells and singlets). Panels show the expression of these proteins in iMDDCs (left panel) and MDDCs with LPS pretreatment at 100 ng/ml for 48 or 24 h before co-culture (middle and right panels, respectively). (B) Percentage of variation of HIV-1 transfer when using iMDDCs or LPS-treated MDDCs (100 ng/ml LPS for different lengths of time) incubated with a blocking antibody against CD169 as compared to an isotype control for each condition. Results are displayed for 4 different blood donors with the mean +- SD of technical triplicates. (C) Percent of variation in HIV-1 transfer to assess the impact of blocking CD169 and TSPAN7 knockdown as compared to scramble shRNA on MDDCs matured with LPS for 48 h treated by an isotype control. Mean +- SD of seven different blood donors in 4 experiments. (B,C) NS, not significant. ** p < 0.01; *** p < 0.001. (D) Confocal microscopy images of iMDDCs (left panel) and mature MDDCs (mMDDCs) right panel, to assess the degree of colocalization between CD169 (magenta) and incoming X4-HIV-1-Gag-iGFP (green). Actin filaments and nuclei were stained with phalloidin (red) and DAPI (blue). Four hundred nanometers of Z-stacks were taken 40 h after the start of the co-culture with CD4 + T cells and X4-HIV-1-Gag-iGFP. The pic
- Submitted by
- Invitrogen Antibodies (provider)
- Main image
- Experimental details
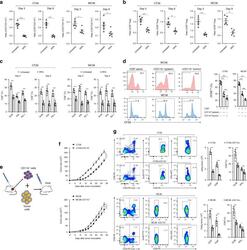
- Fig. 5 Infiltrating myeloid cells inhibit T cell functionality in residual tumors. a Flow cytometric analysis of CD11b + , CD3 + and the ratio of CD3 + /CD11b + in the untreated and iRFA-treated CT26 and MC38 tumors on day 3 and day 9 ( n = 5). b Flow cytometric analysis of CD8 + and CD4 + FoxP3 + cells and the ratio of CD8 + /CD4 + FoxP3 + in the untreated and iRFA-treated CT26 and MC38 tumors on day 3 and day 9 ( n = 5). c Flow cytometric analysis and quantification of granzyme B, IFN-gammaand PD-1 expression in CD8 + cells in the untreated and iRFA-treated CT26 and MC38 tumors on day 3 and day 9 ( n = 5). d In vitro suppressive activity of tumor-infiltrating CD11b + cells purified from spleen or CT26 residual tumors on day 3 after iRFA. Representative histograms of CD8 + T cell proliferation at a ratio of 1:1 CD8 + to CD11b + T cells and percent CD8 + T cell proliferation ( n = 5). e - g CD11b + cells isolated from the residual tumor were mixed with CT26 or MC38 tumor cells and transferred into recipient mice. e Adoptive transfer method. f Growth curve of tumor (one-sided ANOVA test, *** P < 0.001, n = 5). g Flow cytometric analysis and quantification of CD3 + CD8 + cells (gate on single live cells) and Granzyme B expression and IFN-gamma on CD8 + cells ( n = 5). Data represent cumulative results from 1/2 independent experiments with 5 mice/group. The data are represented as mean +- SEM. Statistical differences between pairs of groups

- Submitted by
- Invitrogen Antibodies (provider)
- Main image
- Experimental details
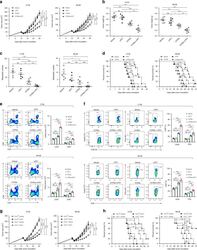
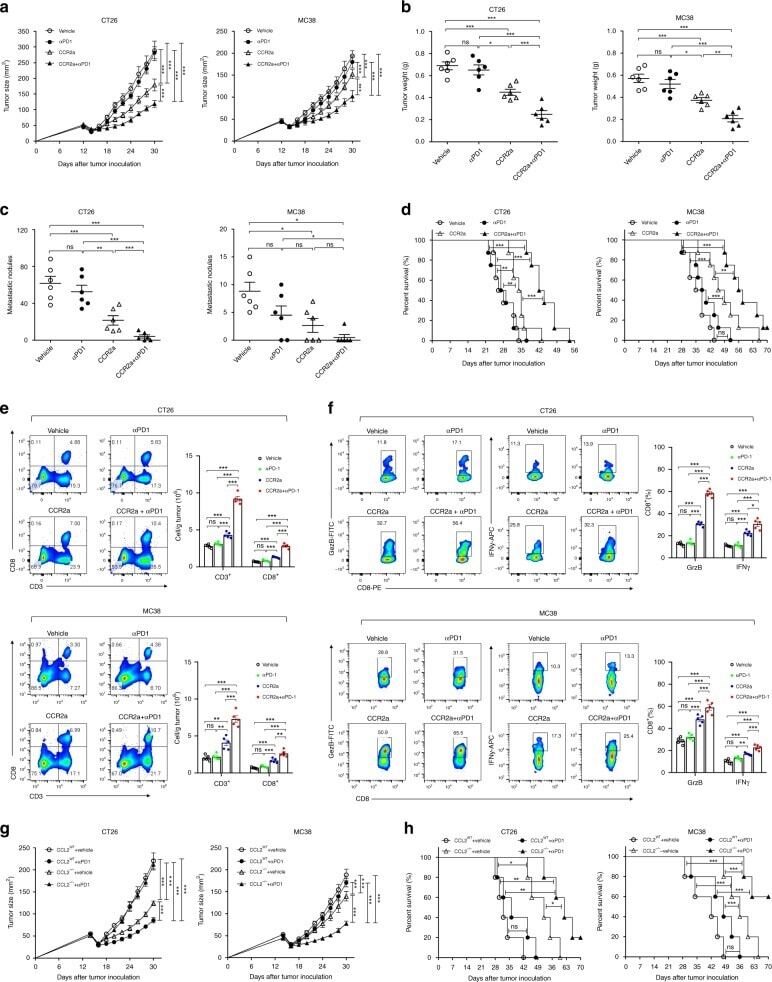
- Fig. 8 CCL2/CCR2 blockade inhibits tumor progression and overcomes resistance to anti-PD-1 therapy. a - f iRFA treatment was performed in CT26 and MC38 colon cancer models as shown in Fig. 2a . Anti-PD-1 mAb (200 mug, clone: J43) was administered through intraperitoneal injection to mice every 3 days for a total of four times. The CCR2 antagonist (CCR2a) (RS504393, Tocris) was given subcutaneously at a dose of 5 mg/kg twice per day for 9 days. a Growth curve of the CT26 and MC38 residual tumor (one-sided ANOVA test, n = 8). b The weight of the residual CT26 and MC38 tumor examined on day 14 after iRFA by dissection of the mice ( n = 6). c The number of metastases examined on day 14 after iRFA by dissection the mice ( n = 6). d Kaplan-Meier survival curves are shown, and the log-rank test was performed ( n = 8). e Flow cytometric analysis and quantification of CD3 + and CD8 + infiltration (gate on single live cells) in residual CT26 tumors. f Granzyme B and IFNgamma expression on CD8 + cells in residual CT26 tumors. (gate on CD8 + cells) ( n = 5). g , h iRFA treatment was performed in mice bearing wild type and CCL2 -/- CT26 or MC38 tumor. g Growth curve of the CT26 and MC38 residual tumor (one-sided ANOVA test, n = 5). h Kaplan-Meier survival curves are shown, and the log-rank test was performed ( n = 8). Data represent results from 1/2 independent experiments. The data are represented as mean +- SEM. Statistical differences between pairs o
- Submitted by
- Invitrogen Antibodies (provider)
- Main image
- Experimental details
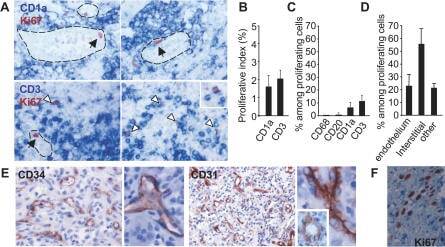
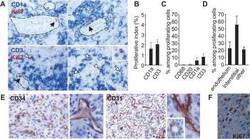
- Figure 1 Proliferating Cells in LCH Granuloma are Mostly Endothelial Cells, Fibroblasts, and T Cells Paraffin-embedded and frozen sections were stained with antibodies against Ki-67 (which label proliferating cells), CD1a (LCs), CD3 (T cells), CD20 (B cells), CD68, CD31, and CD34 (endothelial cells). (A) Double immunostaining of paraffin-embedded section from LCH eosinophilic granulomas with anti-Ki-67 Ab, (brown nuclear staining) and with anti-CD1a Ab (upper images, blue staining) or anti-CD3 Ab (lower images, blue staining). Open arrowheads indicate double-stained cells, black arrowheads indicate Ki-67 + cells with an endothelial morphology. (B) Histogram represents percentage of CD1a + cells and of CD3 + cells labeled with Ki-67 ( n = 15). (C) Histogram represents percentage of proliferating cells (Ki-67 + ) that express CD1a, CD3, CD20, or CD68 ( n = 15). (D) Histogram represents percentage of proliferating cells (Ki-67 + ) that are endothelial cells, interstitial cells (fibroblasts), and other types based on morphological examination. (E) Immunolabeling of blood vessels on paraffin-embedded section from LCH eosinophilic granulomas with CD34 (left) and CD31 (right) antibodies. (F) Proliferating Ki-67 + cells (brown nuclear staining) with a fibroblast-cell morphology in an eosinophilic granuloma.