Explore
 Validate
 Learn
Learn Flow cytometry
Antibody data
- Antibody Data
- Antigen structure
- References [0]
- Comments [0]
- Validations
- Flow cytometry [1]
- Other assay [48]
Submit
Validation data
Reference
Comment
Report error
- Product number
- 56-0037-42 - Provider product page

- Provider
- Invitrogen Antibodies
- Product name
- CD3 Monoclonal Antibody (OKT3), Alexa Fluor™ 700, eBioscience™
- Antibody type
- Monoclonal
- Antigen
- Other
- Description
- Description: The OKT3 monoclonal antibody reacts with an epitope on the epsilon-subunit within the human CD3 complex. The OKT3 antibody has been reported to have potent immunosuppressive properties in vivo and has been proven effective in the treatment of renal, heart and liver allograft rejection. The CD3 subunits, gamma, delta, and epsilon chains, are required for proper assembly, trafficking and surface expression of the TCR complex. CD3 is expressed by thymocytes in a developmentally regulated manner and by all mature T cells. Crosslinking of TCR initiates an intracellular biochemical pathway resulting in cellular activation and proliferation. Applications Reported: This OKT3 antibody has been reported for use in flow cytometric analysis. Applications Tested: This OKT3 antibody has been pre-titrated and tested by flow cytometric analysis of normal human peripheral blood cells. This can be used at 5 µL (0.5 µg) per test. A test is defined as the amount (µg) of antibody that will stain a cell sample in a final volume of 100 µL. Cell number should be determined empirically but can range from 10^5 to 10^8 cells/test. Alexa Fluor® 700 emits at 723 nm and can be excited with the red laser (633 nm). Most instruments will require a 685 LP mirror and 710/20 filter. Please make sure that your instrument is capable of detecting this fluorochrome. Excitation: 633-647 nm; Emission: 723 nm; Laser: Red Laser. Filtration: 0.2 µm post-manufacturing filtered.
- Reactivity
- Human
- Host
- Mouse
- Conjugate
- Near infrared dye
- Isotype
- IgG
- Antibody clone number
- OKT3
- Vial size
- 100 Tests
- Concentration
- 5 µL/Test
- Storage
- 4° C, store in dark, DO NOT FREEZE!
No comments: Submit comment
Supportive validation
- Submitted by
- Invitrogen Antibodies (provider)
- Main image

- Experimental details
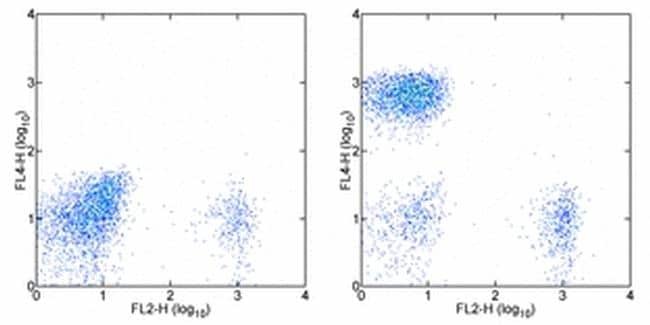
- Staining of normal human peripheral blood cells with Anti-Human CD19 PE (Product # 12-0199-80) and Mouse IgG2a K Isotype Control Alexa Fluor® 700 (Product # 56-4724-80) (left) or Anti-Human CD3 Alexa Fluor® 700 (right). Cells in the lymphocyte gate were used for analysis.
- Conjugate
- Near infrared dye
Supportive validation
- Submitted by
- Invitrogen Antibodies (provider)
- Main image
- Experimental details
- NULL
- Conjugate
- Near infrared dye
- Submitted by
- Invitrogen Antibodies (provider)
- Main image
- Experimental details
- NULL
- Conjugate
- Near infrared dye
- Submitted by
- Invitrogen Antibodies (provider)
- Main image
- Experimental details
- NULL
- Conjugate
- Near infrared dye
- Submitted by
- Invitrogen Antibodies (provider)
- Main image
- Experimental details
- NULL
- Conjugate
- Near infrared dye
- Submitted by
- Invitrogen Antibodies (provider)
- Main image
- Experimental details
- NULL
- Conjugate
- Near infrared dye
- Submitted by
- Invitrogen Antibodies (provider)
- Main image

- Experimental details
- NULL
- Conjugate
- Near infrared dye
- Submitted by
- Invitrogen Antibodies (provider)
- Main image
- Experimental details
- NULL
- Conjugate
- Near infrared dye
- Submitted by
- Invitrogen Antibodies (provider)
- Main image
- Experimental details
- NULL
- Conjugate
- Near infrared dye

- Submitted by
- Invitrogen Antibodies (provider)
- Main image
- Experimental details
- NULL
- Conjugate
- Near infrared dye

- Submitted by
- Invitrogen Antibodies (provider)
- Main image
- Experimental details
- NULL
- Conjugate
- Near infrared dye
- Submitted by
- Invitrogen Antibodies (provider)
- Main image
- Experimental details
- NULL
- Conjugate
- Near infrared dye

- Submitted by
- Invitrogen Antibodies (provider)
- Main image
- Experimental details
- NULL
- Conjugate
- Near infrared dye
- Submitted by
- Invitrogen Antibodies (provider)
- Main image
- Experimental details
- NULL
- Conjugate
- Near infrared dye

- Submitted by
- Invitrogen Antibodies (provider)
- Main image
- Experimental details
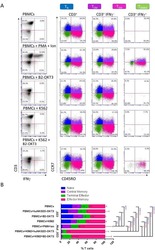
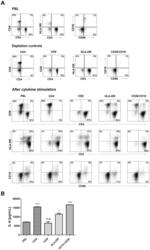
- Figure 9 IL-6 produced by PBLs depleted for CD4 + , CD8 + , HLA-DR + or CD56 + /CD16 + cells. (A) Freshly purified PBLs stained for CD4, CD8, CD3, HLA-DR, CD16, CD56. Depletion controls for PBLs depleted for CD4 + , CD8 + , HLA-DR + or CD16 + /CD56 + cells. PBLs and depletions were stimulated for 7 days with combinations of IL-12 (4 ng/mL), IL-15 (10 ng/mL), IL-18 (40 ng/mL) and TL1A (100 ng/mL) and stained for CD4, CD8, CD3, HLA-DR, CD16 and CD56 expression. (B) IL-6 production after 7 days by PBLs and depletions stimulated with IL-12, IL-15, IL-18 and TL1A as described above. Error bars represent the SEM of two measurements. Statistically significant differences by t-test: *** = p
- Conjugate
- Near infrared dye

- Submitted by
- Invitrogen Antibodies (provider)
- Main image
- Experimental details
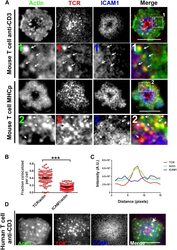
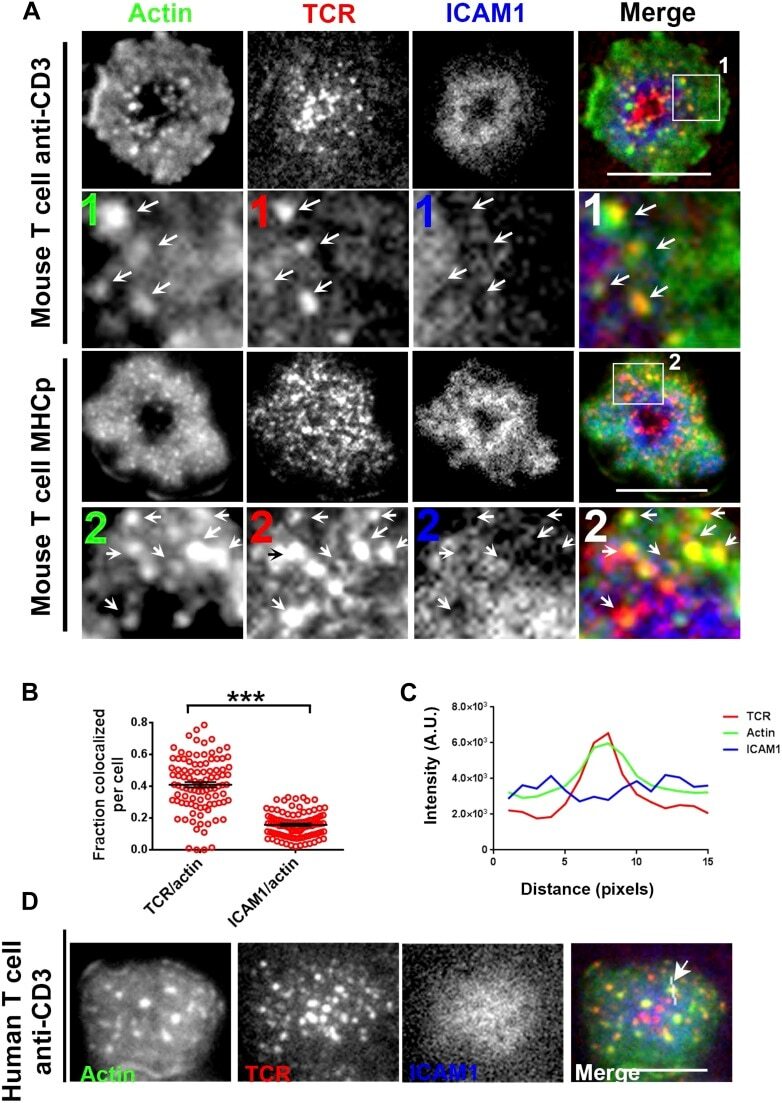
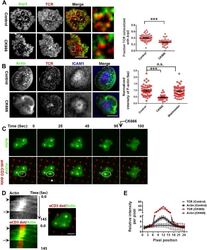
- Figure 2. F-actin foci co-localize with TCR MC and not ICAM1. ( A ) Freshly isolated mouse AND CD4 T cells were incubated with lipid bilayer reconstituted with Alexa568 tagged anti-CD3 (TCR, red) and Alexa647-ICAM1 (blue), for 2 min at 37degC. Post incubation, cells were fixed and stained for F-actin using Alexa488-phalloidin (green), and imaged using TIRF microscopy. The region marked 1 in the 'merge' panel is magnified to clearly show the co-localization of actin foci with TCR-containing MCs. Lower panels: AND mouse CD4 T cell blasts exhibit F-actin enrichment at TCR MCs sites. AND mouse CD4 T cell blasts were labeled with Alexa568-H57 Fab (TCR), and incubated with bilayer reconstituted with MHCp and Alexa405-ICAM1 for 2 min at 37degC, fixed and stained for F-actin. Region marked 2 in the 'merge' image is further magnified to show the overlap between TCR and F-actin (arrows). The insets 1 and 2 in both MHC-activated and anti-CD3-activated mouse T cells are contrasted differently from the original 'merge' image to highlight the TCR and actin distribution. ( B ) Quantitation of the fraction of TCR or ICAM1 localized with F-actin foci. AND CD4 T blasts were incubated with antigen containing bilayer for 2 min, as described above and the images acquired were processed for colocalization assessment as described in 'Materials and methods' section. Each point represents fraction of total synaptic TCR or ICAM1 associated with F-actin foci in a
- Conjugate
- Near infrared dye
- Submitted by
- Invitrogen Antibodies (provider)
- Main image
- Experimental details
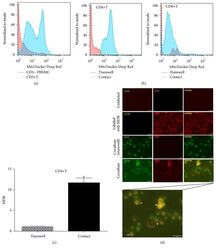
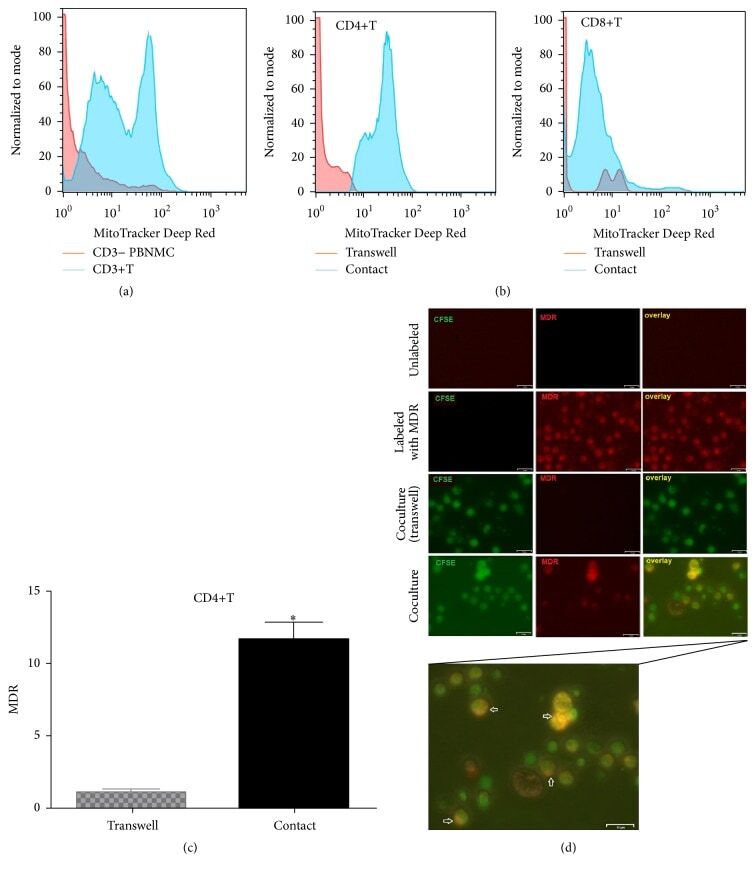
- Figure 7 UC-MSCs transferred mitochondria to activate T cells. PBMCs from SLE patients were labeled with carboxyfluorescein succinimidyl amino ester (CFSE) and treated with anti-CD3/CD28 antibodies for two days. Then they were cocultured with UC-MSCs for 12 h, which had been prelabeled with respiratory mitochondrion specific probe Mitotracker Deep Red (MDR). PBMCs were cultured with UC-MSCs through transwell as control. Then PBMCs were stained with anti-CD3, anti-CD4, or anti-CD8 dye and detected for MDR fluorescence with flow cytometry. Fluorescence microscopy was carried out similarly with anti-CD3/28 stimulation for 12 h and then cocultured for 6 h. All experiments were performed in triplicate. (a) T cells (CD3 positive) rather than non-T cells (CD3 negative) got MDR staining. (b-d) T cells cultured with UC-MSCs directly rather than through transwell got transferred mitochondria ( n = 3). Arrows indicated transferred mitochondria within lymphocytes. * p < 0.05.
- Conjugate
- Near infrared dye
- Submitted by
- Invitrogen Antibodies (provider)
- Main image
- Experimental details
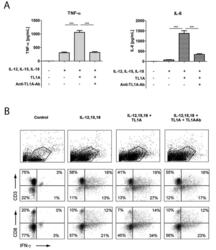
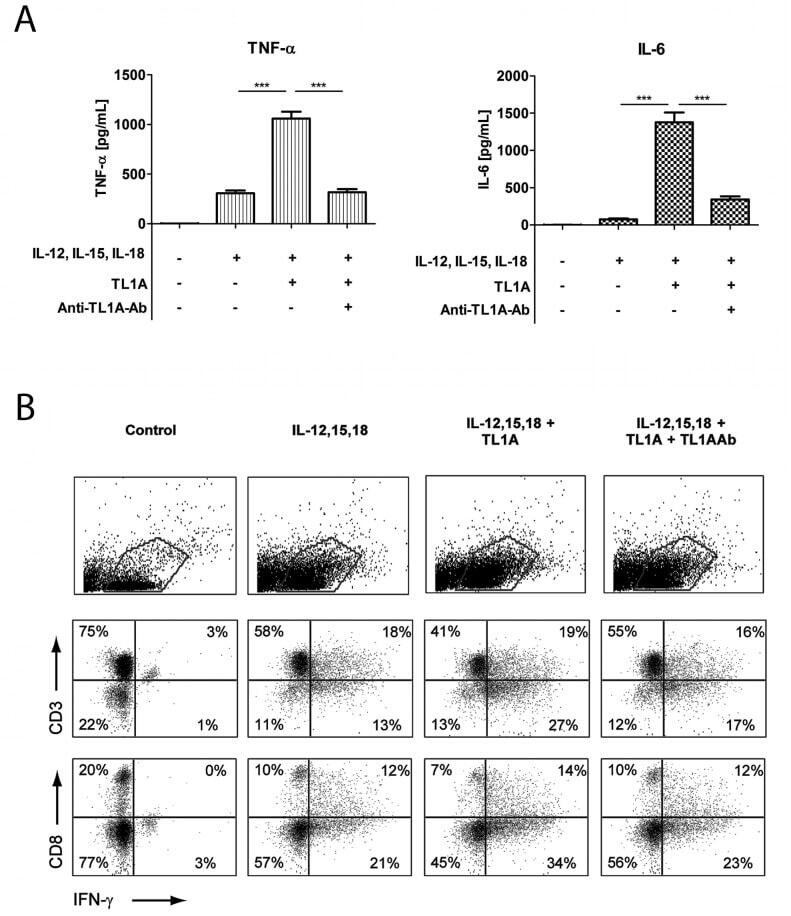
- Figure 2 TL1A induces IL-6 and TNF-alpha. Freshly purified PBMCs were incubated with IL-12 (2 ng/mL), IL-15 (10 ng/mL), IL-18 (10 ng/mL), TL1A (100 ng/mL) and TL1AAb (1 ug/mL, blocking antibody). Extra IL-15 (2 ng/mL) was added on day 3. ( A ) After 6 days, supernatants were collected and different cytokines were measured by bead-based ELISA. Error bars represent the SEM of eight measurements. Statistically significant differences are indicated by ***(t-test, P
- Conjugate
- Near infrared dye
- Submitted by
- Invitrogen Antibodies (provider)
- Main image
- Experimental details
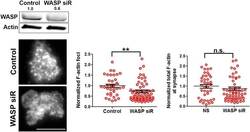
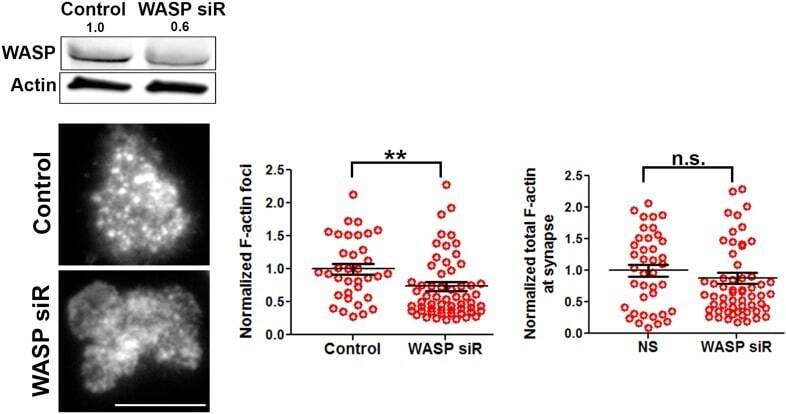
- Figure 1--figure supplement 3. WASP silencing causes a reduction in F-actin foci. Mouse CD4 T cell blasts were electroporated with WASP siRNAs, or with non-targeting sequences (control). The extent of depletion of protein levels was estimated using western blots. ~40% of protein depletion was achieved using WASP siRNAs (relative densitometry value mentioned on top of gel lanes). Cells electroporated with WASP siRNA exhibited significantly fewer F-actin foci. AND T cell blasts electroporated with siRNA sequences, as described above, were incubated with bilayer containing anti-CD3 and ICAM1 for 2 min, followed with fixation and staining with Alexa488-phalloidin (left panels), and imaged using TIRF microscopy. The graphs show quantitation of total F-actin (right graph) or F-actin foci (left graph) per cell, in control or WASP siRNA-treated cells. n1 = 35, n2 = 60, p = 0.238 (right) , p = 0.0025 (left graph). DOI: http://dx.doi.org/
- Conjugate
- Near infrared dye
- Submitted by
- Invitrogen Antibodies (provider)
- Main image
- Experimental details
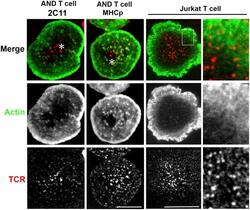
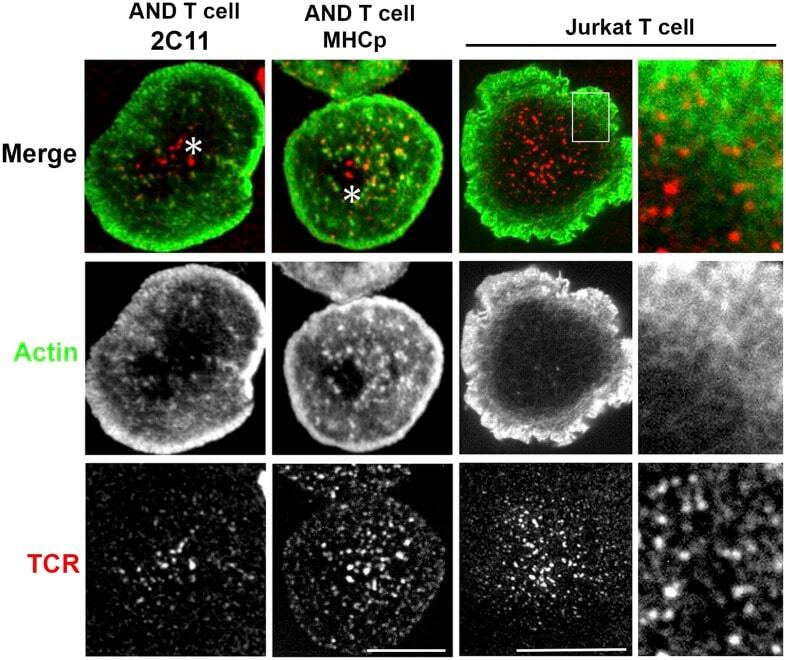
- Figure 2--figure supplement 4. Lack of F-actin foci in the cSMAC of primary T cells and the Jurkat T cell line. AND CD4 T cell blasts were either incubated with bilayers containing Alexa568 tagged anti-CD3 and ICAM1 (far left panels) or were labeled with Alexa568-H57 Fab and incubated with MHCp/ICAM1 bilayers (center left panels), for 2 min. Cells were fixed and stained for F-actin using Alexa488-phalloidin (middle row, green) and visualized using spinning disc confocal microscopy. Each image is a maximum intensity projection of the bottom three planes that show high intensity signals from the bilayer. Note that TCR MCs (bottom row, red) in the F-actin depleted central zone of the cell (asterisk) exhibit no significant co-localization with actin foci. This phenomenon where central microclusters lack F-actin foci was observed in >90% cells exhibiting well-defined cSMAC (number of experiments >3). F-actin foci were not detected in Jurkat T cells (center right panel, and far right insets). Jurkat T cells were activated on bilayer containing Aexa568 tagged anti-CD3 (TCR, red, bottom row) and ICAM1 for 2 min and were fixed and stained with Alexa488-phalloidin (Actin, green, middle row). As highlighted in insets, visible F-actin enrichment is missing from the TCR MCs in these cells. Scale bars, 5 um (AND T cell) and 10 um (Jurkat T cell). DOI: http://dx.doi.org/
- Conjugate
- Near infrared dye
- Submitted by
- Invitrogen Antibodies (provider)
- Main image
- Experimental details
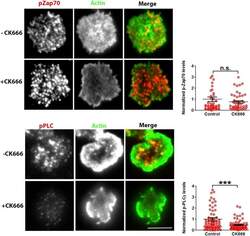
- Figure 6--figure supplement 2. Effect of CK666 on TCR-induced Zap70 and PLCgamma phosphorylation in human T cells. Freshly purified human CD4 T cells were treated with DMSO (control) or CK666, and incubated with bilayer reconstituted with anti-CD3 and ICAM1 for 2 min, in presence of the inhibitor. Cells were then fixed and stained with Alexa488 phalloidin (Actin, green) and either of anti-phospho Zap70 (upper panels) or anti-phospho-PLCgamma1 (Lower panels) antibodies, and subsequently imaged using TIRFM. The graph represents phospho-Zap70 (upper graph) or phospho-PLCgamma1 levels at synapse, normalized to the mean value in control cells. For upper graph, n1 = 49 n2 = 47, p = 0.976; for the lower graph, n1 = 78, n2 = 67, p = 0.004. DOI: http://dx.doi.org/
- Conjugate
- Near infrared dye

- Submitted by
- Invitrogen Antibodies (provider)
- Main image
- Experimental details
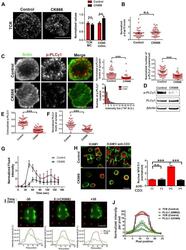
- Figure 6. Arp2/3 inhibition leads to defective TCR-distal signaling. ( A ) Formation of TCR MCs or CD45 exclusion does not require F-actin foci. AND CD4 T cell blasts labeled with Alexa568-H57 Fab (to assess TCR clustering), or Alexa488-CD45 Fab (for CD45 exclusion) at 40C, were then incubated with bilayers containing ICAM1 and MHCp for 2 min, fixed (to assess TCR clustering) or visualized live (for CD45 exclusion) using TIRF microscopy. The images were processed to assess TCR clustering, or CD45 and TCR colocalization using rank filter based filtering, as described in 'Materials and methods' section. For the bars showing TCR cluster intensities per cell, n1 = 45, n2 = 28, p = 0.6; for CD45 co-localization, n1 = 26, n2 = 13, p = 0.09 . ( B ) Phosphorylation of TCR-proximal molecule Zap70 is not reduced in the cells treated with CK666. T cells were treated with DMSO or CK666 for 10 min, then incubated with surface containing ICAM1/anti-CD3 for 3 min, and processed for Y319-phospho-Zap70 and imaged using TIRF. The images were quantified to obtain the synaptic levels phospho-Zap70, and plotted as normalized to mean value of the 'control' cells. In the graph shown here, n1 = 34, n2 = 38, p = 0.16 . ( C ) Synaptic phospho-PLCgamma1 levels are reduced in cells lacking F-actin foci. DMSO (control, top panel) or CK666 (bottom panel) treated AND CD4 T cell blasts were incubated with bilayer containing anti-CD3 and ICAM1 for 2 min, fixed and stained with Alexa488-ph
- Conjugate
- Near infrared dye

- Submitted by
- Invitrogen Antibodies (provider)
- Main image
- Experimental details
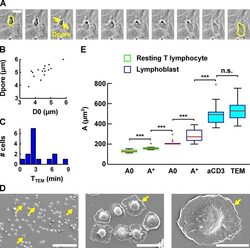
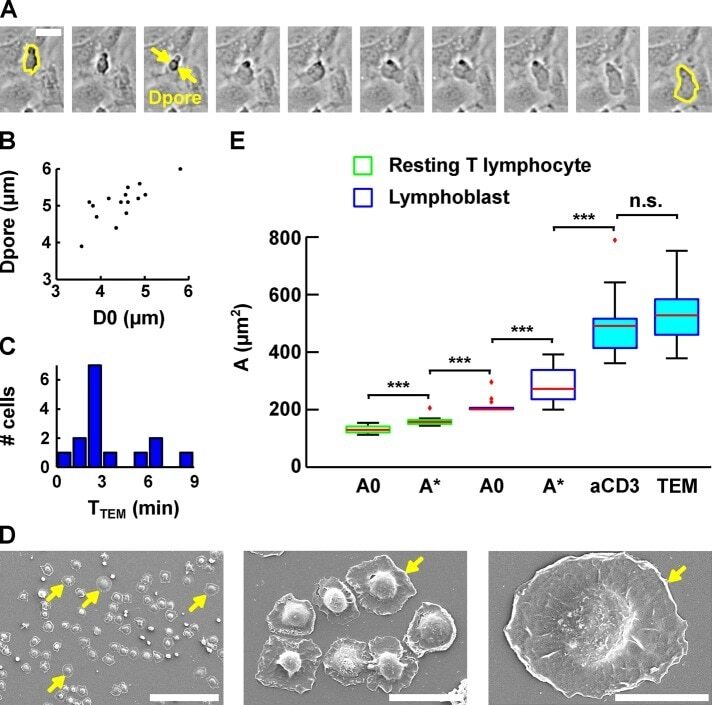
- FIGURE 7: Evolution of lymphoblast membrane surface area during transendothelial migration and cell spreading. (A) Time lapse of a lymphoblast transmigrating between human aortic endothelial cells. Scale bar, 20 mum. Images were taken every 15 s. The projected surface area S proj is represented in yellow before (leftmost image) and after (rightmost image) transendothelial migration. The pore diameter, D pore , is estimated by taking the image in which the lymphoblast width is identical above and below the pore (yellow arrows). (B) D pore during transendothelial migration as a function of the lymphoblast's projected diameter before transendothelial migration (computed using D 0 = S proj /2pi, and D 0 is an equivalent diameter for a sphere whose projected area is S proj ). (C) Histogram of the duration of transmigration. The mean duration is 3 +- 2 min (mean +- SD). (D) Scanning electron microscopy images of lymphoblasts spreading on a substrate coated with anti-CD3 plus anti-CD28 activating antibodies. Scale bars, 100 mum, 20 mum, 10 mum (left to right). Yellow arrows indicate spread cells. (E) Boxplots of the apparent membrane surface area of T-lymphocytes under both passive (white-filled box) and active (blue-filled box) deformations. The bottom and top of the box indicate the 25th and 75th percentiles, respectively. Red plus signs indicate outliers. From left to right, resting T-lymphocytes initially (column 1, A 0 , n = 14) and at rupture (column 2, A *, n = 14) aspir
- Conjugate
- Near infrared dye
- Submitted by
- Invitrogen Antibodies (provider)
- Main image
- Experimental details
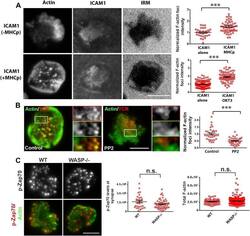
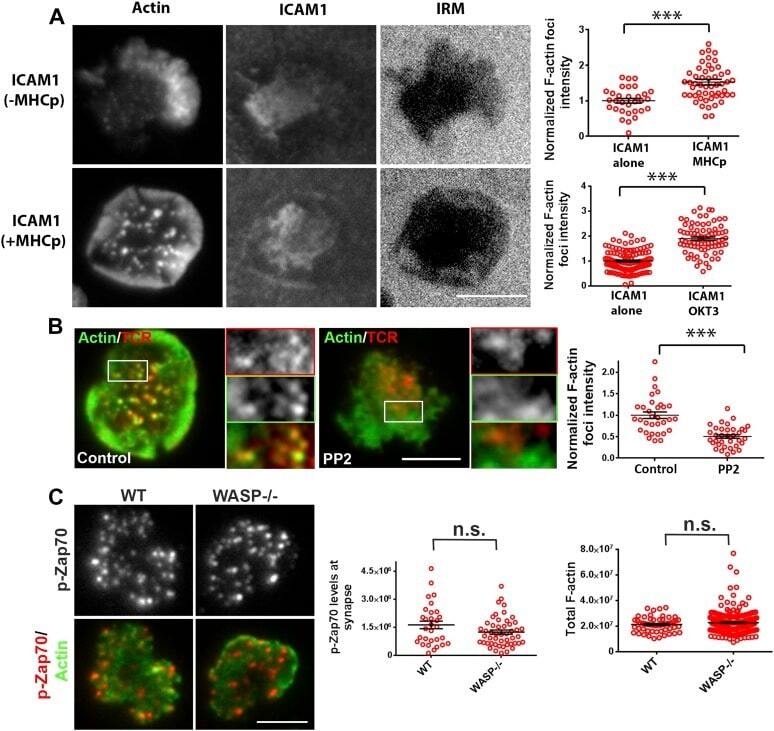
- Figure 3. Relationship of F-actin foci to TCR engagement and TCR proximal signaling. ( A ) AND mouse CD4 T cell blasts were incubated with lipid bilayer containing Alexa405-ICAM1 and MHCp, or bilayer containing Alexa405-ICAM1 alone (ICAM1) at 37degC for 2 min. The cells were fixed and stained with Alexa488-phalloidin (Actin) and imaged using TIRF microscopy. The images in the right panel are reflection (interference reflection microscopy - IRM) images in the two conditions, showing cell-bilayer contact area. Actin images were further high-pass filtered using a rank-filter based subtraction method (see 'Materials and methods') to reveal spatially localized actin features within each cell, under both incubation conditions. The graph (top right) shows average intensity of actin features (F-actin foci) per cell. n1 = 31, n2 = 53, p < 0.0001 . The bottom graph shows foci induction in human CD4 T cells. Primary human CD4 T cells were incubated with bilayer containing Alexa405-ICAM1 alone, or both Alexa405-ICAM1 and Alexa568 tagged anti-CD3 at 37degC for 2 min, and were then fixed and stained for F-actin using Alexa488-phalloidin, for imaging using TIRF microscopy. The graph shows integrated intensity of actin spots per cell, each point on the graph represents a single cell. n1 = 117, n = 79, p < 0.0001 ( B ) Formation of TCR MC associated F-actin foci requires SFK signaling. AND T cell blasts were treated with PP2 for 10 min at 37degC and were labeled with Alexa568-H57 Fab. This
- Conjugate
- Near infrared dye
- Submitted by
- Invitrogen Antibodies (provider)
- Main image
- Experimental details
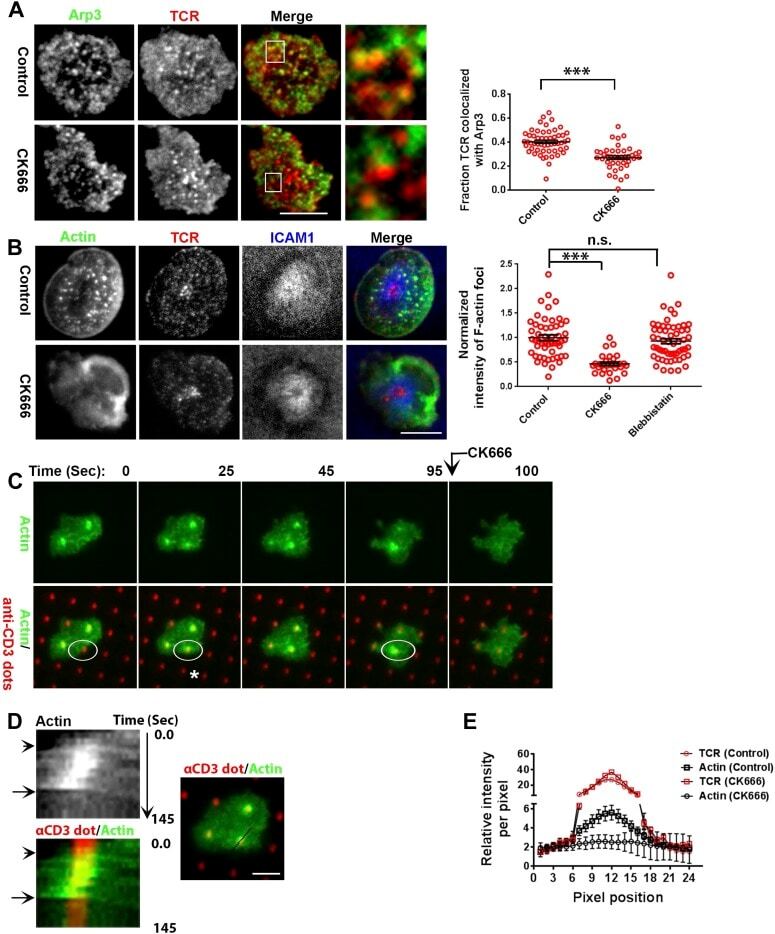
- Figure 5. F-actin foci require activity of the Arp2/3 complex. ( A ) Arp2/3 complex is localized at TCR MCs. DMSO (Control, top) or CK666 treated-(bottom) AND mouse T cell blasts were labeled with Alexa568-H57 Fab and were incubated with bilayer containing ICAM1 and MHCp for 2 min at 37degC, and then fixed and immunostained with anti-Arp3 antibody. The TIRF images show relative distribution of Arp3 (left, green) and TCR (middle, red) in the TIRF plane. Note that while Arp3 distribution overlaps with MCs in control cells, MCs are significantly devoid of Arp3 in CK666-treated cells (areas from 'merge' panels further magnified in insets). The graph (far right) shows the fraction co-localization of total synaptic TCR with Arp3. n1 = 54, n2 = 41, p < 0.0001 . In this experiment, the mean intensity of Arp3 in synapse was 3.46 (+-0.022) x 10 6 for control cells, and 2.38 (+-0.015) x 10 6 for CK666 treated cells (data not shown), and it was repeated twice with similar results. ( B ) TCR MCs associated F-actin enrichment is generated by Arp2/3 complex activation. AND T cell blasts were treated with DMSO alone (control), or 100 muM CK666, or 100 muM blebbistatin for 10 min at 37degC, were labeled with Alexa568-H57 Fab (TCR, red), and incubated with Alexa405-ICAM1 (ICAM1, blue) and MHCp-containing bilayer in the presence of the specific inhibitors at 37degC for 2 min. Cells were subsequently fixed, stained with Alexa488-phalloidin and imaged using TIRF microscopy. Note that
- Conjugate
- Near infrared dye
- Submitted by
- Invitrogen Antibodies (provider)
- Main image
- Experimental details
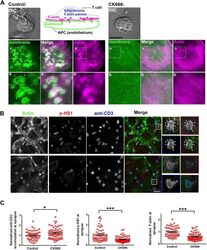
- Figure 7--figure supplement 1. ILP F-actin and signaling in T-EC immunological synapse is dependent on Arp2/3 activity. ( A ) Visualization of loss of F-actin in ILPs following CK666 treatment. T cells were incubated with membrane-YFP (green) expressing endothelial cells in the presence of DMSO (control, left) or CK666 (right) for 5 min, then fixed, permeabilized and stained with Alexa594-phalloidin ('Actin', pink). Note that F-actin rich protrusions are missing at the CK666-treated T cell interface. Scale bar, 5 um. ( B ) Loss of ILPs correlated with reduced phospho-HS1 at the T cell-endothelial cell synaptic interface. T cells were incubated with endothelial cell layer, as described in 'Materials and methods' for 5 min and were then fixed and stained with Alexa594-phalloidin ('Actin', green), phospho-HS1 (red) and anti-CD3 (blue). Cells were then imaged using confocal microscopy. The insets show single T cells marked in the 'Merge' image. Scale bar, 10 um. ( C ) The intensity of the indicated proteins was then analyzed in the synaptic plane without and with CK666 treatment. n1 = 58, n2 = 71, p1 = 0.031, p2, p3 < 0.0001 . DOI: http://dx.doi.org/
- Conjugate
- Near infrared dye

- Submitted by
- Invitrogen Antibodies (provider)
- Main image
- Experimental details
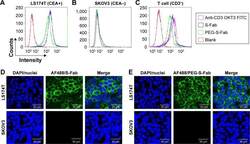
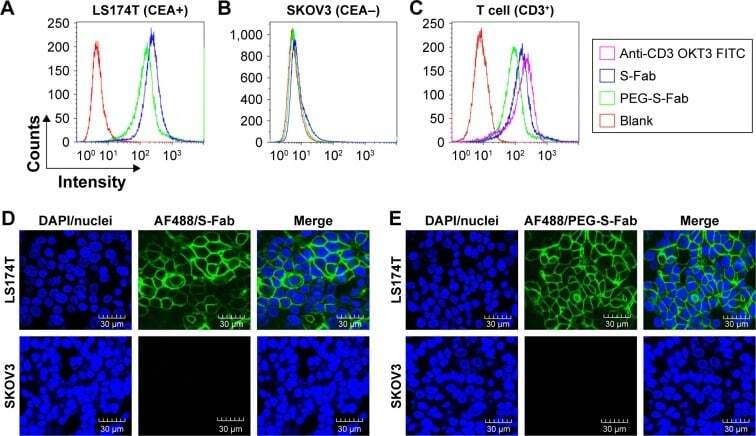
- Figure 4 PEG-S-Fab can bind CEA on tumor cells and CD3 + on T cells. Notes: Flow cytometry analysis of PEG-S-Fab and S-Fab on CEA-positive LS174T cells ( A ), CEA-negative SKOV3 cells ( B ), and CD3 + T cells ( C ). The positive control anti-CD3 antibody OKT3 was used for T-cell flow cytometry. Confocal microscopy of immunofluorescence staining as described in the ""Materials and methods"" section. S-Fab ( D ) and PEG-S-Fab ( E ) on LS174T cells (upper panel) and SKOV3 cells (lower panel), respectively. The scale bar represents 30 mum. AF488, stained by the goat antihuman IgG (H + L)-AlexaFluor 488 antibody; LS174T, human colorectal cell line LS174T; SKOV3, human ovarian cancer cell line SKOV3. Abbreviations: CEA, carcinoembryonic antigen; DAPI, 4',6-diamidino-2-phenylindole; IgG, immunoglobulin G; PEG, polyethylene glycol; PEG-S-Fab, PEGylated S-Fab; S-Fab, single-domain antibody-linked Fab; FITC, fluoresceine isothiocyanate.
- Conjugate
- Near infrared dye
- Submitted by
- Invitrogen Antibodies (provider)
- Main image
- Experimental details
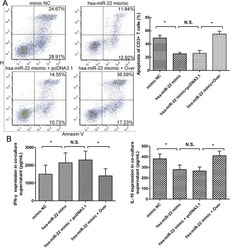
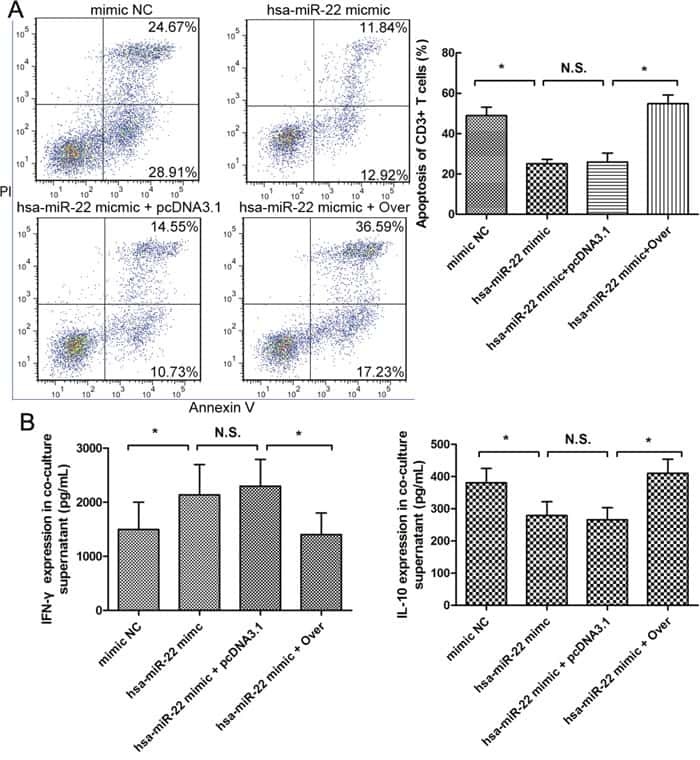
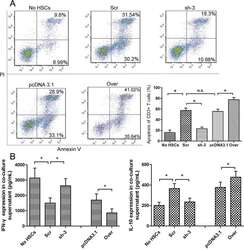
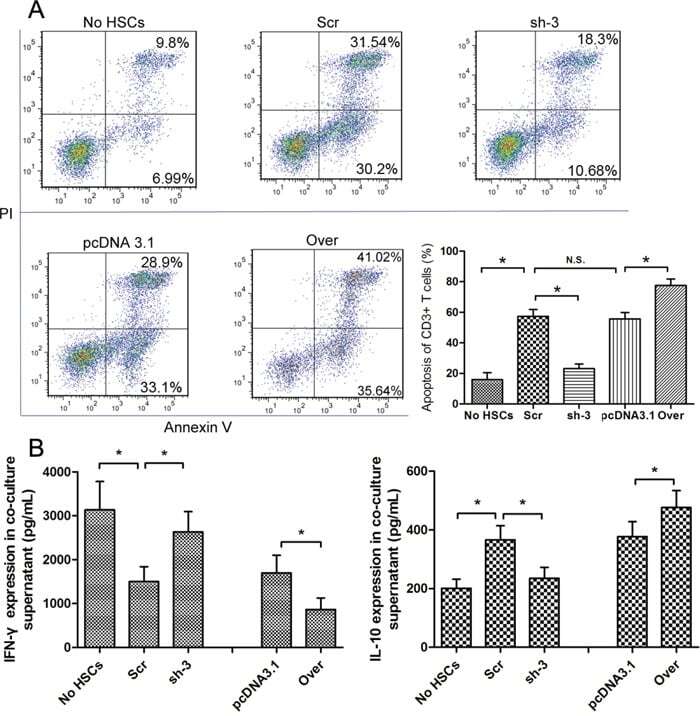
- Figure 4 The expression of galectin-1 in HSCs promotes HSC-induced T cell apoptosis and Th1/Th2 cytokine balance skewing A. Flow cytometry (annexin V-FITC apoptosis detection) analyses to detect T cell apoptosis in CD3+ T cells, cultured alone or co-cultured with HSCs subjected to different pre-treatments (cell transfection for galectin-1 knockdown and overexpression: sh-3 group versus Scr group; Over group versus pcDNA3.1 group) for 48 hours at a ratio of 10:1 (T:HSC), B. ELISA showing the levels of cytokines (IFN-gamma and IL-10) in the supernatant. Data are shown as the means (+- SD) of triplicates (n = 7). *P < 0.05. NC, negative control group; Scr, non-targeting scrambled sequence group; sh, small hairpin RNA sequence transfection group; pcDNA3.1, negative control group; Over, galectin-1 overexpression group; No HSCs, T cells cultured alone.
- Conjugate
- Near infrared dye
- Submitted by
- Invitrogen Antibodies (provider)
- Main image

- Experimental details
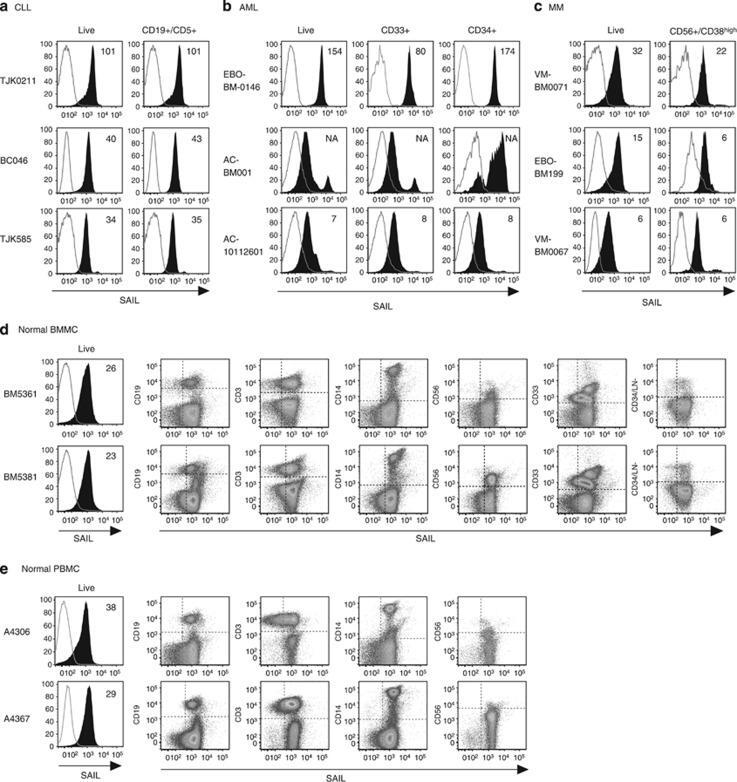
- Figure 2 Cell surface expression of SAIL in CLL, AML and MM patient samples and normal BMMC and PBMC controls. ( a ) Three CLL specimens analyzed by flow cytometry. CLL cells were identified as CD19/CD5 double-positive cells. The histograms present SAIL (filled) and isotype control (open) staining in the live-cell and the CLL population. ( b ) Flow cytometry analysis of three AML specimens. SAIL expression is assessed in live-cells, CD33-positive and CD34-positive cells. ( c ) Flow cytometry analysis of three MM specimens. CD38 high cells with CD56 expression were gated for MM cells. SAIL expression is assessed in the live-cell and the MM population. ( d and e ) Flow cytometry analysis of SAIL expression in BMMC ( d ) and PBMC ( e ) via co-staining with CD19, CD3, CD14, CD56, CD33, CD34 and a cocktail of lineage (LN) markers. Numbers in histograms are median-fluorescence-intensity fold-change values relative to the isotype control. Three and two representative examples are shown for the tumor and normal samples, respectively.
- Conjugate
- Near infrared dye
- Submitted by
- Invitrogen Antibodies (provider)
- Main image
- Experimental details
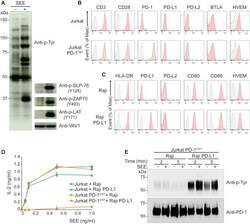
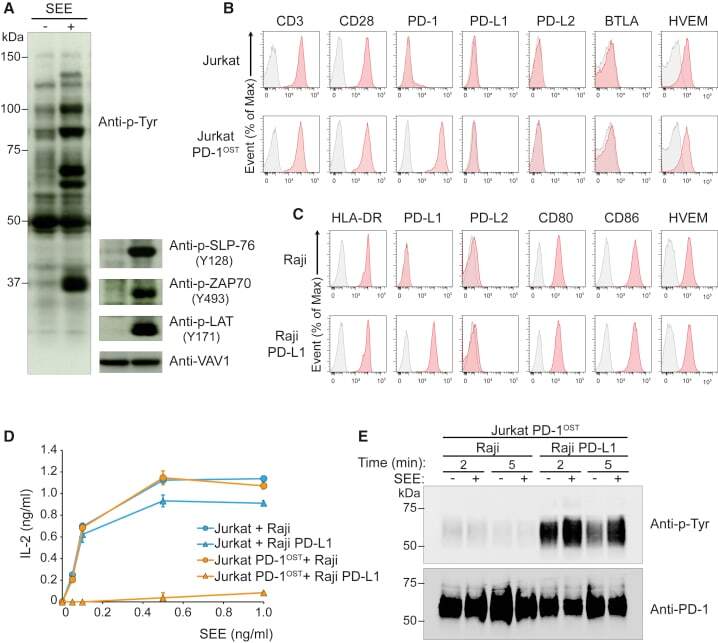
- Figure 3 Outcome of PD-1-PD-L1 Engagement at T Cell-APC Interface (A) Jurkat-PD-1 OST cells were stimulated with Raji cells that have been preincubated in the absence (-) or presence (+) of 200 ng/mL SEE and lysed 2 min after the initiation of cell-cell contact. Immunoblot analysis of equal amounts of lysates from the specified conditions probed with antibody to phosphorylated proteins (Anti-p-Tyr) or with phospho-tyrosine-specific antibodies directed against SLP76 pY128, ZAP70 pY493, LAT pY171 or VAV1 (loading control). Left margin, molecular size in kilodaltons (kDa). Data are representative of three independent experiments. (B) Expression of CD3, CD28, PD-1, PD-L1, PD-L2, BTLA, and HVEM at the surface of Jurkat cells and Jurkat-PD-1 OST cells, analyzed using flow cytometry. (C) Expression of HLA-DR, PD-L1, PD-L2, CD80, CD86, and HVEM at the surface of Raji cells and Raji-PD-L1 cells, analyzed using flow cytometry. In (B) and (C), gray shaded curves correspond to isotype-matched control antibody (negative control), and data are representative of two independent experiments. (D) IL-2 production by Jurkat and Jurkat-PD-1 OST cells stimulated for 24 h with either Raji or Raji-PD-L1 cells in the absence (0) or presence of the specified amounts of SEE. Data are representative of three independent experiments, and mean and SEM are shown. (E) Jurkat-PD-1 OST cells stimulated at 37degC with Raji or Raji-PD-L1 cells preincubated in the absence (-) or presence (+) of 200 ng/mL SEE an
- Conjugate
- Near infrared dye
- Submitted by
- Invitrogen Antibodies (provider)
- Main image
- Experimental details
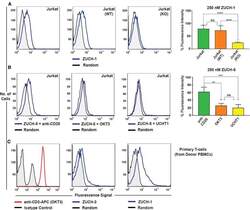
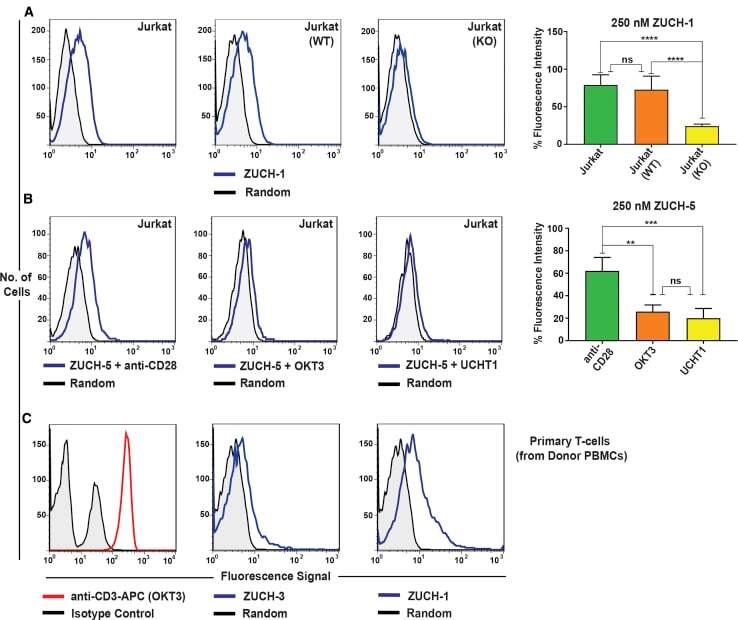
- Figure 6 Characterization of Aptamer Specificity against TCR-CD3epsilon (A) Flow-cytometric analyses of binding of the highest affinity aptamer, ZUCH-1, against Jurkat.E6 cells used in SELEX (left), against wild-type Jurkat cells used for generating CRISPR knockout cell lines (middle), against CRISPR double-knockout Jurkat cells (right), and the overall conclusion from six independent specificity analyses (far right). Aptamer ZUCH-1 does not bind to knockout cells, thereby demonstrating epitope specificity (ordinary one-way ANOVA, using Tukey''s multiple comparisons test performed on GraphPad Prism to obtain statistical significance: ****p
- Conjugate
- Near infrared dye
- Submitted by
- Invitrogen Antibodies (provider)
- Main image
- Experimental details
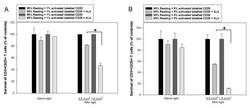
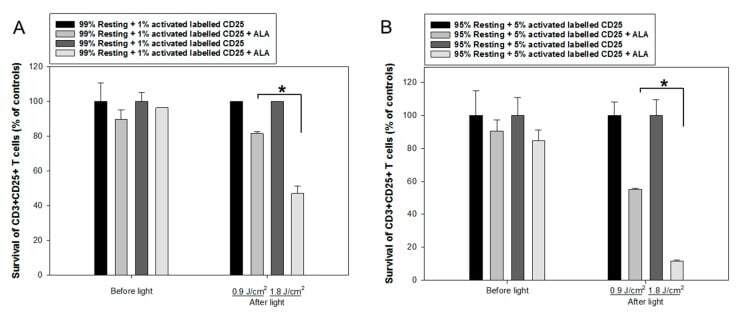
- Figure 7 ALA-PDT of mixed populations of resting and activated cells. Healthy donor PBMCs were activated in vitro with anti-CD3/CD28 antibodies for three days. The activated T cells were then labeled with anti-human CD25-FITC antibody. The resting and CD25-FITC labeled activated T cells were mixed in certain ratios as indicated. The mixed cells were incubated with 3 mM ALA for 1 h at 37 degC and then irradiated with the LED blue light at 0.9 J/cm 2 or 1.8 J/cm 2 . The cell survivals were measured 2 h after light irradiation with flow cytometry as described in Figure 3 . The control samples without light are also included. ( A ) Mixture of 1% CD25-FITC labelled activated T cells with 99% resting PBMCs. ( B ) Mixture of 5% CD25-FITC labelled activated T cells with 95% resting PBMCs. * p < 0.05.
- Conjugate
- Near infrared dye
- Submitted by
- Invitrogen Antibodies (provider)
- Main image
- Experimental details
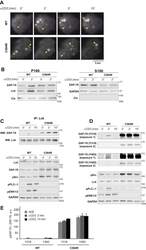
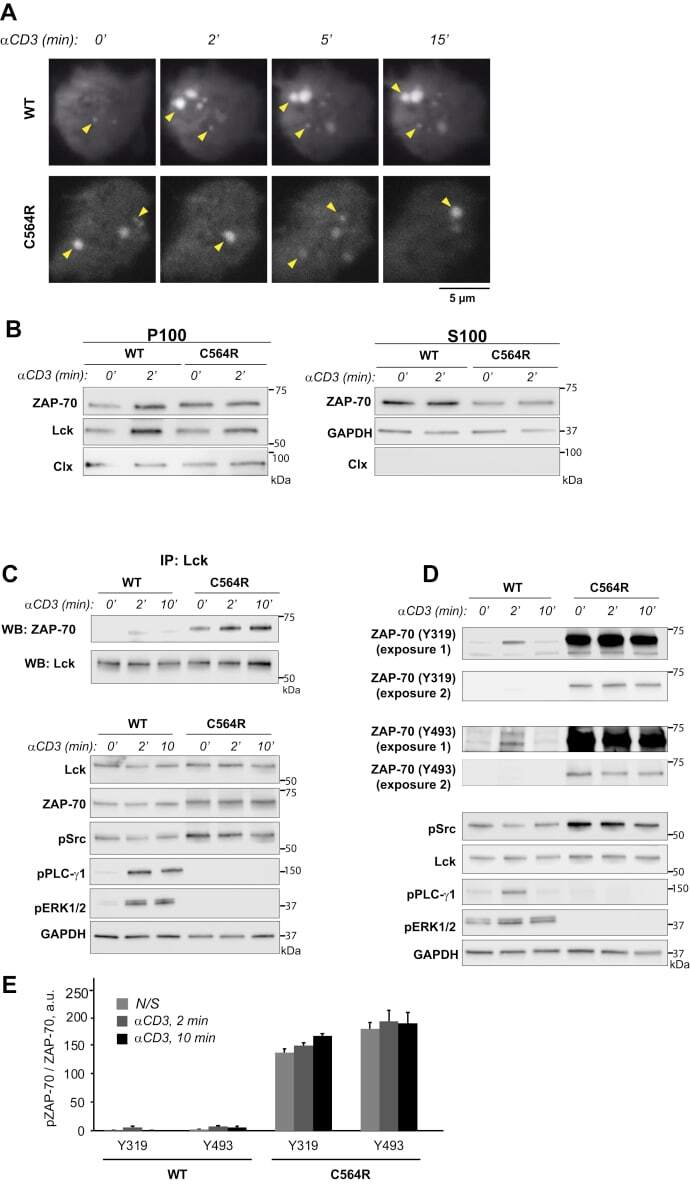
- Figure 3 Acylation-deficient ZAP-70 exhibits increased phosphorylation at Y319 and Y493. A , TIRF imaging of P116 (ZAP-70 -/-) Jurkat T cells transiently transfected with mCherry-tagged WT or acylation-deficient C564R ZAP70. Both WT ZAP-70 and C564R ZAP-70 showed similar localization patterns by forming puncta at the surface of the resting or stimulated cells. Shown are representative cells from three independent experiments. B , WT and C564R ZAP-70 were analyzed for membrane association by subcellular fractionation. GAPDH and calnexin were used as loading controls for cytosolic (S100) and membrane (P100) fractions, respectively. C , Coimmunoprecipitation of Lck and ZAP-70. P116 Jurkat T cells stably expressing WT or C564R ZAP-70 were stimulated with anti-CD3 antibody for the indicated time points. Lck was immunoprecipitated from the lysates, and the presence of ZAP-70 was assessed in eluates. D , Western blot analysis of ZAP-70 phosphorylation at Y319 and Y493. P116 Jurkat T cells stably expressing WT ZAP-70 or C564R ZAP-70 were stimulated with anti-CD3 antibody for the indicated time points, and phosphorylation of ZAP-70 was analyzed by immunoblotting. E , Quantified data showing phosphorylation of WT or C564R ZAP-70. Data shown are representative of three independent biological repeats and represented as mean +- SEM, normalized to total ZAP-70.
- Conjugate
- Near infrared dye
- Submitted by
- Invitrogen Antibodies (provider)
- Main image
- Experimental details
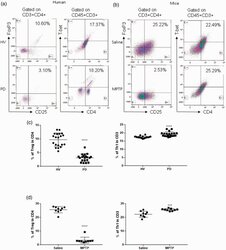
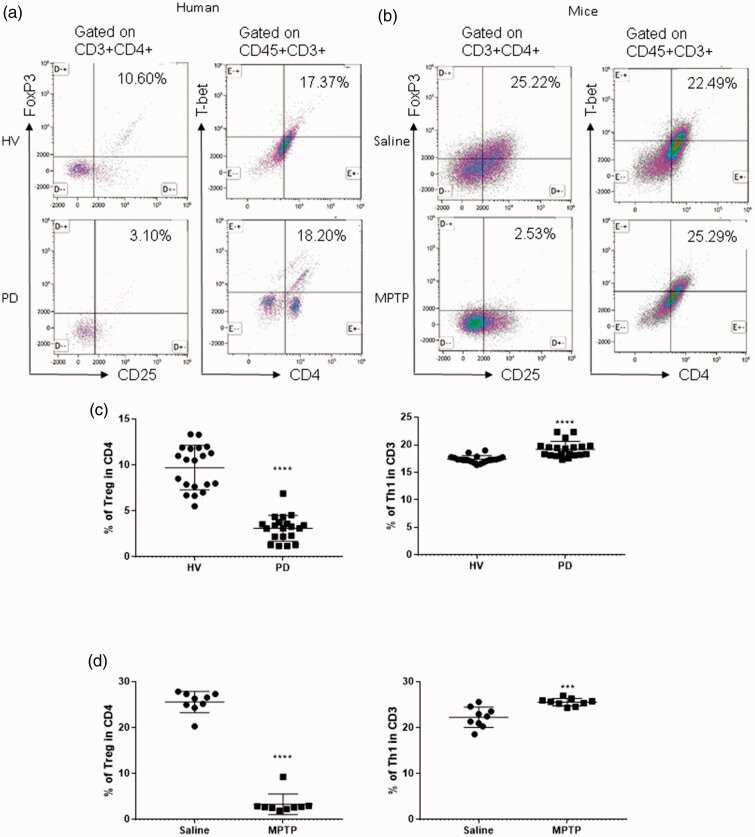
- Figure 1. Patients with Parkinson's disease (PD) and mice with experimental PD exhibit decreased regulatory T (Treg) and increased T helper 1 (Th1) cell numbers in the blood. Treg cells were defined as CD3+CD4+CD25+FoxP3+ cells, whereas Th1 cells were identified as CD3+CD4+T-bet+ cells. (a) Representative plots of Treg and Th1 cells in patients with PD and healthy volunteers (HVs). (b) Representative plots of Treg and Th1 cells in control mice (Saline) and 1-methyl-4-phenyl-1,2,3,6-tetrahydropyridine (MPTP)-treated mice. (c) Patients with PD exhibited lower Treg cell levels and greater Th1 cell levels in the blood than HVs. n = 20. ****, p < 0.0001 by a two-tailed Student's t tests. (d) MPTP-induced experimental PD mice had fewer Treg and more Th1 cells in the circulation than saline-treated mice. n = 9/group in each experiment performed in triplicate. ***, p < 0.001; ****, p < 0.0001, according to Student's t test.
- Conjugate
- Near infrared dye
- Submitted by
- Invitrogen Antibodies (provider)
- Main image
- Experimental details
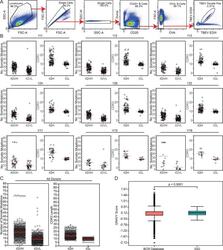
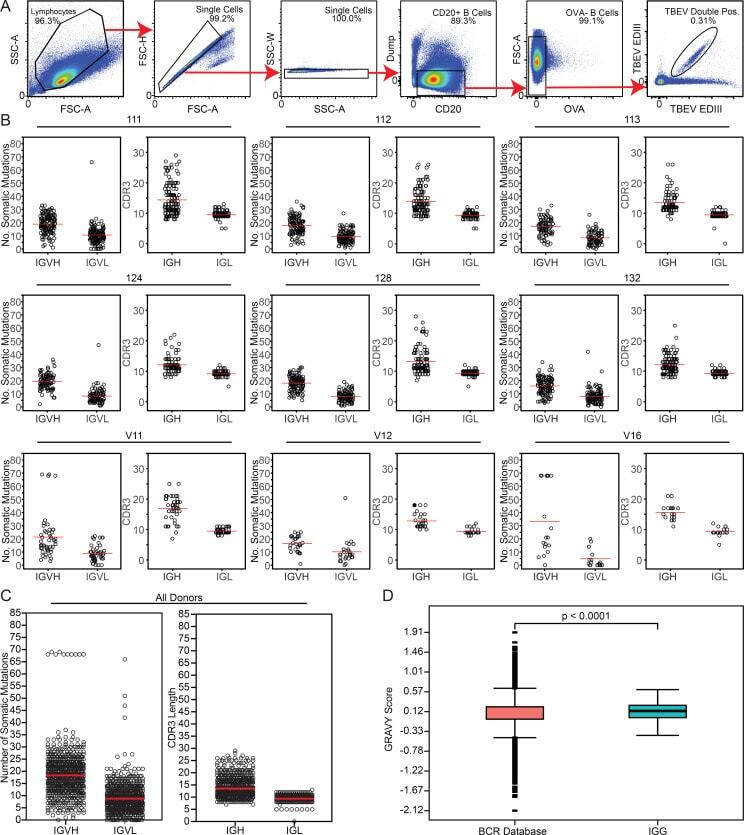
- Figure S2. Sorting strategy and antibody sequence analysis. (A) Sorting strategy. Forward and side scatter (FSC and SSC, respectively) were used to gate on single lymphocytes. Dump channel included CD3, CD8, CD14, CD16, and a viability dye. CD20 + B cells that failed to bind OVA (OVA - ) but did bind to the TBEV EDIII bait coupled with both PE and AF647 fluorophores were purified. (B) For each donor, the number of V gene somatic nucleotide mutations is shown on the left and the amino acid length of the CDR3 is shown on the right. (C) As in B, but for all donors combined. For B and C, horizontal red lines indicate the mean. (D) Distribution of hydrophobicity GRAVY scores at the IGH CDR3 of antibodies from all donors combined and compared with human repertoire (). P < 0.0001 was determined using the Wilcoxon nonparametric test. Related to Fig. 2 , Table S2 , and Table S3 .
- Conjugate
- Near infrared dye
- Submitted by
- Invitrogen Antibodies (provider)
- Main image
- Experimental details
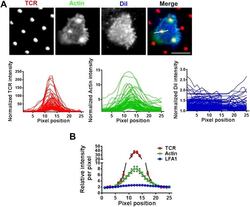
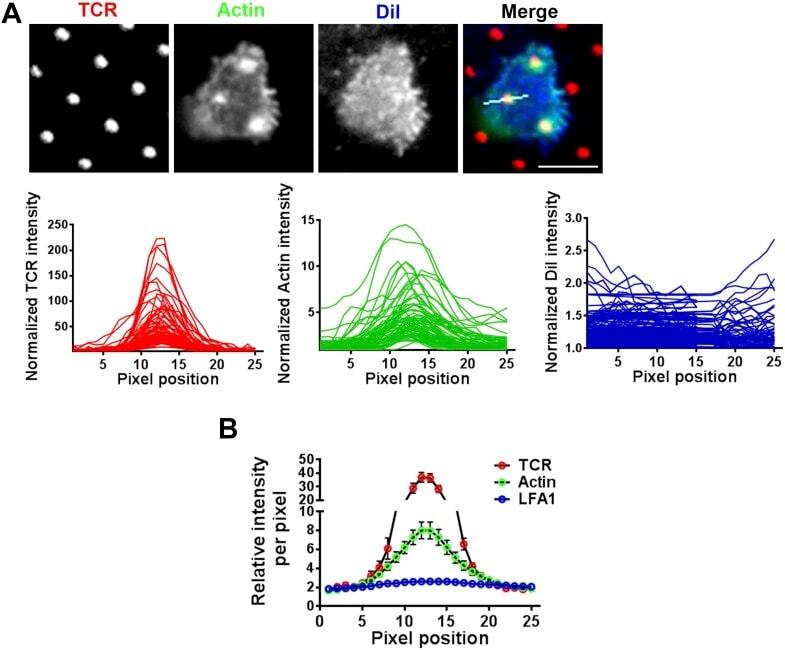
- Figure 5--figure supplement 2. F-actin foci on microdots are not enriched in phospholipid membranes. ( A ) F-actin enrichment at the microdot is not a consequence of cell morphology around the microdot. Human CD4 T cells were labeled with CM-DiI according to manufacturer's protocol and were then incubated with glass coverslip coated with patterned Alexa647 tagged anti-CD3 and ICAM1 for 5 min, fixed and stained with Alexa488-phalloidin. Cells were then imaged using TIRF microscopy. The graphs on the bottom panels show line-scan profiles of anti-CD3 (TCR, red, left), actin (Green, center) and DiI (blue, right) acquired from 70 different microdots. The TCR, actin and DiI intensities were measured from identical pixel positions for a given microdot, were then normalized by the lowest pixel intensity per microdot for a given fluorescent channel, and plotted. Note that while actin shows enrichment at the microdot site, DiI is not enriched at the same position. ( B ) The same procedure as described above, except with the use of Cy3-anti- LFA1 Fab fragments instead of DiI, was carried out in T cells, and the normalized line-scan intensities were plotted as average value per pixel position +-SEM. The graph represents mean of normalized intensities across 25 pixels, acquired using 74 different microdots. In both these experiments ( A , B ), n > 20. DOI: http://dx.doi.org/
- Conjugate
- Near infrared dye
- Submitted by
- Invitrogen Antibodies (provider)
- Main image
- Experimental details
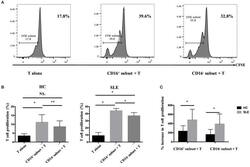
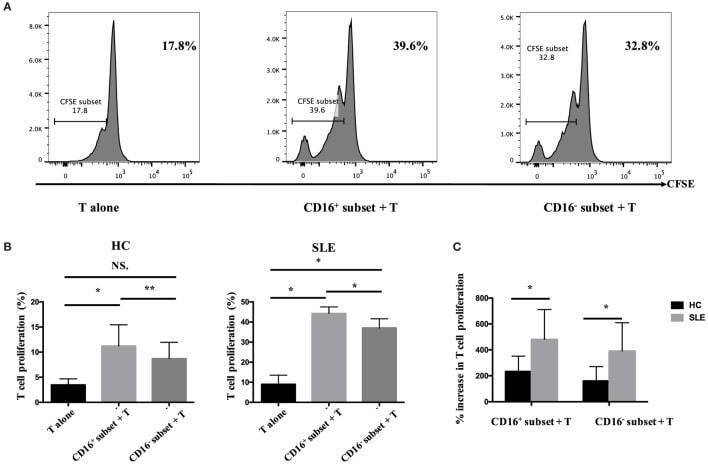
- Figure 6 CD16 + monocytes promoted T-cell proliferation in SLE . CFSE-labeled CD4 + T cells isolated from freshly collected SLE blood or blood bank collected HC blood buffy coat were cocultured with CD16 + and CD16 - monocytes for 60 h in the presence of anti-CD3 (1 mug/mL) and anti-CD 28 (1 mug/mL) antibodies and M-CSF (50 ng/mL). CFSE histograms depicted the number of events ( y -axis) and the fluorescence intensity ( x -axis), with proliferating cells displaying a progressive loss in fluorescence intensity following cell division, indicative of proliferating cells. (A) Representative histogram plots from a patient with SLE displayed the frequencies of CFSE low T cells in monocyte/T-cell cocultures and T cells cultured alone. (B) Percentages of CFSE low T cells in CD4 + T cells after coculture with each monocyte subset from five healthy donors and six patients with SLE. (C) The percentage increase in CFSE low T cells in cocultures of monocytes and T cells compared with CD4 + T cells cultured alone was compared between five healthy individuals and six patients with SLE. Data were expressed as mean +- SD and analyzed by non-parametric paired t test and Mann-Whitney U test. * P < 0.05, ** P < 0.01; NS, no significance.
- Conjugate
- Near infrared dye
- Submitted by
- Invitrogen Antibodies (provider)
- Main image
- Experimental details
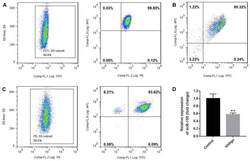
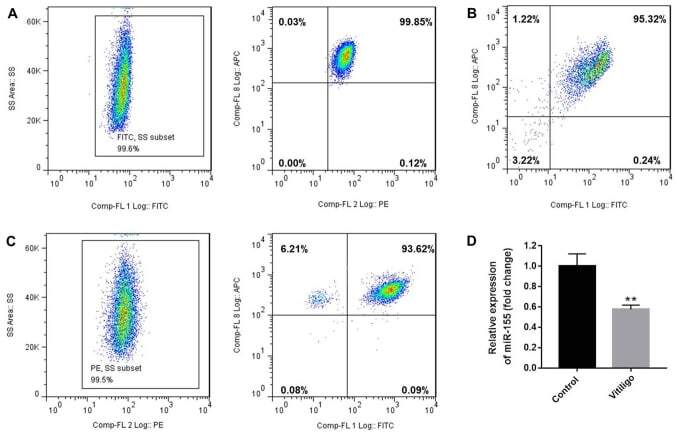
- Figure 1. Purity of CD3 + CD4 + CD45RA + T cells, CD3 + CD8 + T cells and CD4 + CD25 + FoxP3 + Treg cells. CD3 + CD4 + CD45RA + T cells and CD3 + CD8 + T cells were purified by magnetic cell sorting, and their purity was determined by flow cytometry. (A) The purity of CD3 + CD4 + CD45RA + T cells was 99.45% (CD3 + T cells, 99.6%; CD4 + CD45RA + T cells, 99.85%). (B) The purity of CD3 + CD8 + T cells was 95.32%. (C) The purity of CD4 + CD25 + FoxP3 + Treg cells was 93.15% (CD4 + T cells, 99.5%; CD25 + FoxP3 + T cells, 93.62%). (D) miR-155 expression in T cells of the patients with vitiligo and healthy donor was detected by reverse transcription quantitative polymerase chain reaction. **P
- Conjugate
- Near infrared dye
- Submitted by
- Invitrogen Antibodies (provider)
- Main image
- Experimental details
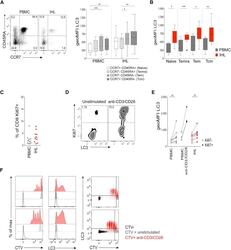
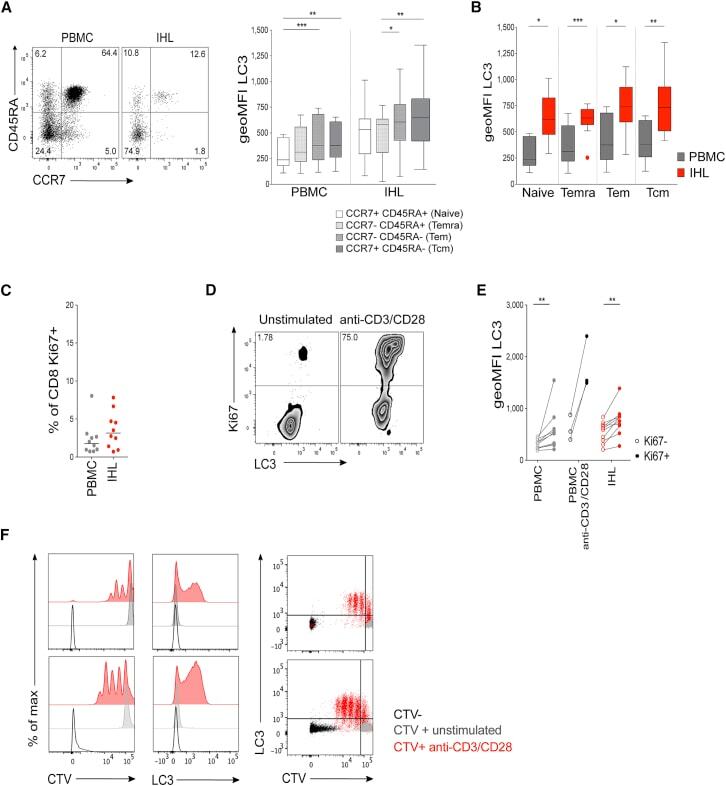
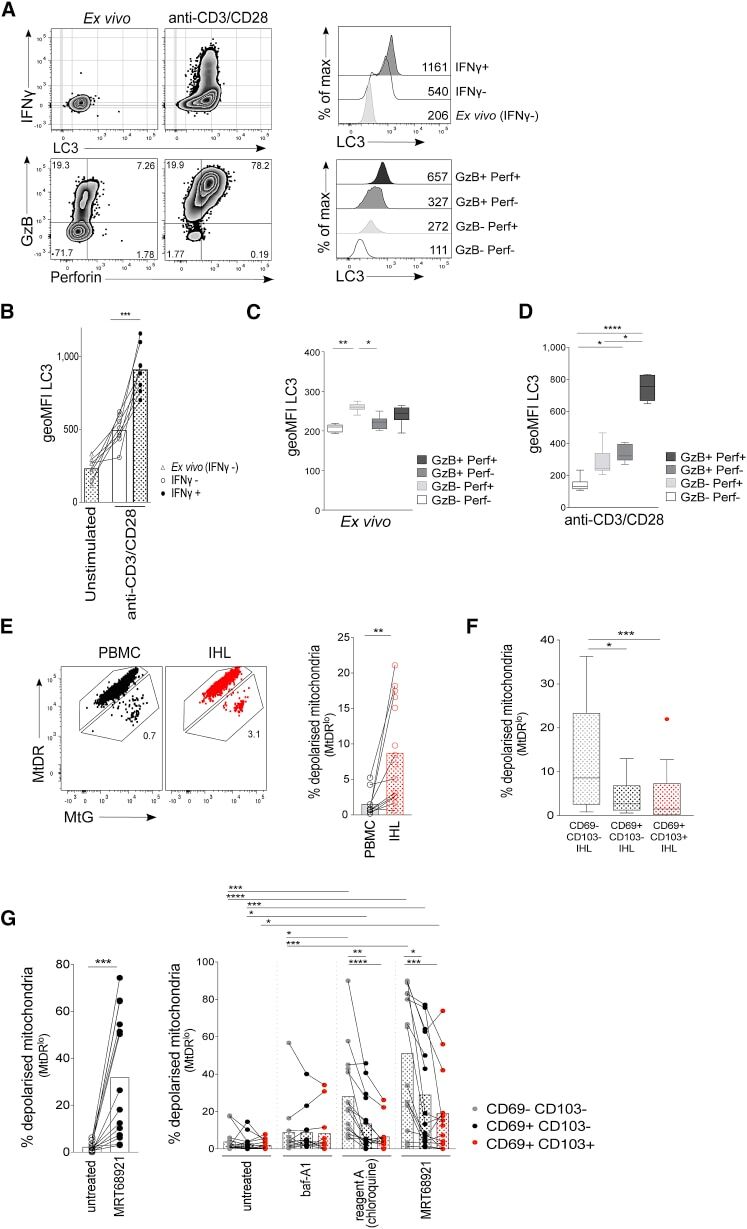
- Figure 2 High Autophagy Level of Intrahepatic T Cells Is Not a Result of a Difference in Differentiation Status or Recent Proliferation (A) Example plot of CD45RA versus CCR7 staining (CD8 + T cells) from a PBMC or IHL sample and summary data for LC3 staining of CD8 + T cell memory subsets (PBMC, 9; and IHL, 15, biological replicates; box whisker, Tukey). (B) Comparison of LC3 staining of CD8 + T cell memory subsets between paired PBMC and IHL samples (9 biological replicates; box whisker, Tukey; outliers shown as dots). (C) Ex vivo CD8 + T cell Ki67 expression. (D and E) Example plots (CD8 + T cells, PBMC) (D) and summary data for LC3 staining on Ki67 - and Ki67 + CD8 + T cells (E) in PBMCs and IHLs ex vivo (10 biological replicates) or after anti-CD3/CD28 stimulation (overnight, 0.5 mug/mL each; three biological replicates) in PBMCs. (F) Histograms showing the dilution of CellTrace Violet (CTV), LC3 staining, and co-staining of LC3 and CTV on CD8 + T cells after 5 days of stimulation with anti-CD3/CD28 (red), compared with that without stimulation (gray) or without CTV staining (black; two representative biological replicates of five, PBMCs). Cells were treated with bafA1 (A-F). Friedman test (ANOVA) with Dunn's post hoc test for pairwise multiple comparisons (A and B). Mann-Whitney t test (C and E). * p < 0.05, ** p < 0.005, *** p < 0.001.
- Conjugate
- Near infrared dye
- Submitted by
- Invitrogen Antibodies (provider)
- Main image

- Experimental details
- Figure 4 Enhanced Autophagy Levels Are Linked to Effector Function and Mitochondrial Fitness in Human T Cells (A) Example plots of IFN-gamma, LC3, granzyme B (GzB), and perforin (perf; gated on CD8 + T cells) and histograms of LC3 staining for PBMC ex vivo or after anti-CD3/CD28 stimulation (3 days; see also Figure S3 ). (B) LC3 staining of CD8 + T cells from unstimulated PBMCs (IFN-gamma - ), IFN-gamma - and IFN-gamma + CD8 + T cells after anti-CD3/CD28 stimulation (3 days; eight biological replicates). (C and D) LC3 staining on GzB and perf-expressing CD8 + T cells ex vivo (C) and after anti-CD3/CD28 stimulation (D) (3 days; eight biological replicates; box whisker, Tukey). (E) Example mitochondrial staining of CD8 + T cells in blood (PBMCs; black) and liver (IHLs; red) and summary data for the ex vivo percentage of total CD8 + T cells with depolarized mitochondria (mitoTracker deep red [MtDR] lo ; see also Figure S4 ; PBMCs, 10; and IHLs, 15 biological replicates). (F) Ex vivo percentage of CD8 + T RM cell subsets in the liver with depolarized mitochondria (14 biological replicates; box whisker, Tukey; outliers shown as dots). (G) The percentage of total CD8 + T cells or CD8 + T RM cell subsets with depolarized mitochondria after overnight culture of IHLs with DMSO (untreated), MRT68921 dihydrochloride (10 muM), bafA1 (0.1 muM), or reagent A (chloroquine diphosphate, 1:1000, FlowCellect LC3 kit; 13-15 biological replicates). Cells were treated with bafA1 (A-D). Bars at mea
- Conjugate
- Near infrared dye
- Submitted by
- Invitrogen Antibodies (provider)
- Main image
- Experimental details
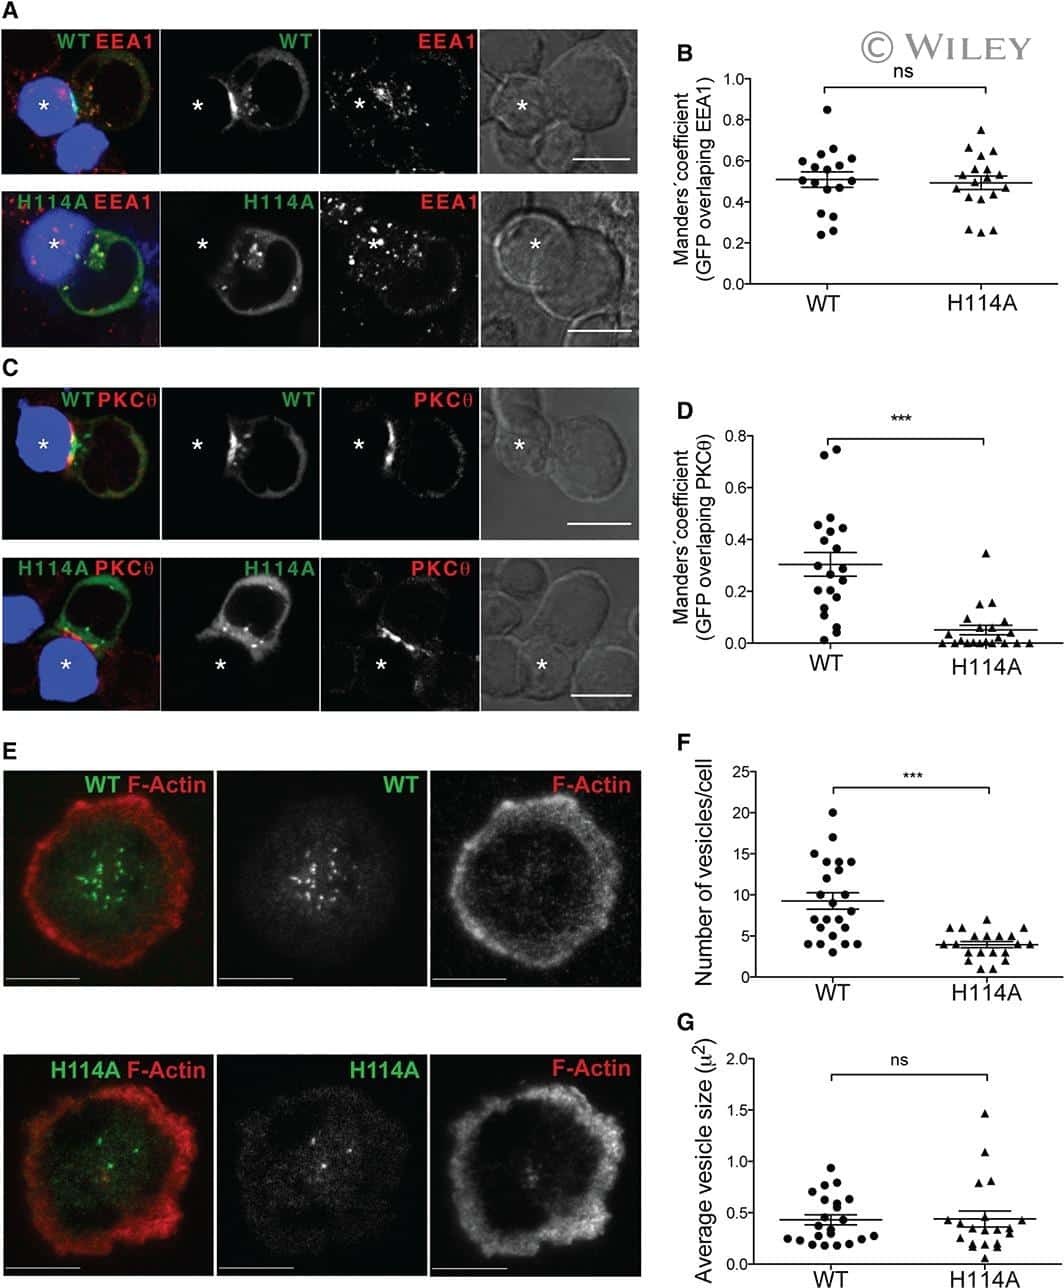
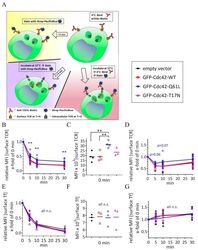
- Figure 4 Expression of Cdc42-Q61L selectively impairs internalization of the TCR-CD3 complex. ( A ) Schematic of the flow-cytometry based internalization assay; cells are labelled at 4 degC with a functional biotinylated anti-CD3epsilon and either (yellow) directly stained with Pacific Blue-streptavidin to measure surface expression of TCR-CD3 complex in resting cells, (blue) activated by incubation at 37 degC and stained with Pacific Blue-streptavidin to detect remaining TCR-CD3 at the cell surface after activation-induced internalization, or (red) activated by incubation at 37 degC, re-labelled with biotinylated anti-CD3epsilon and stained with Pacific Blue-streptavidin to detect total surface TCR-CD3 in activated cells. ( B ) Remaining TCR-CD3 at the cell surface detected by an antibody against CD3epsilon (clone OKT3) after activation-induced internalization in cells expressing an empty vector, GFP-WT-Cdc42, GFP-Cdc42-Q61L, or GFP-Cdc42-T17N. ( C ) Surface expression of TCR-CD3 complex in cells expressing the same constructs as in ( B ). ( D ) Total surface TCR-CD3 in activated cells transfected as in ( B ). ( E ) Internalization of biotinylated Tf detected with Pacific Blue-streptavidin after incubation at 37 degC as described for anti-CD3epsilon in ( A ), in cells activated by soluble anti-CD3epsilon and expressing the same constructs as in ( B ). ( F ) Surface expression of Tf in cells expressing the same constructs as in ( B ). ( G ) Total Tf at the cell surface detect
- Conjugate
- Near infrared dye

- Submitted by
- Invitrogen Antibodies (provider)
- Main image
- Experimental details
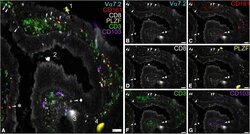
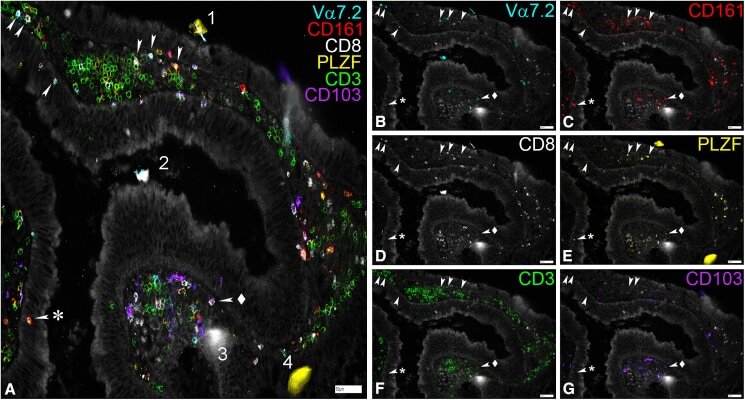
- Figure 7 MAIT Cells Can Be Found Close to and within the Colonic Epithelium (A-G) Representative images showing the expression of Va7.2, CD161, CD8, PLZF, CD3, and CD103 in the lamina propria and the epithelium of fixed samples of colonic polyp tissue. Samples were mounted on cytometer chips and iteratively stained with sets of three directly fluorochrome-conjugated antibodies as described in the methods section. Depicted are a merged picture (A) and all the individual stains for Va7.2 (B), CD161(C), CD8 (D), PLZF (E), CD3 (F), and CD103 (G). White arrows mark cells showing co-expression of Va7.2, CD161, PLZF, and CD3 that were defined as MAIT cells here. Note that while CD8 was co-expressed in most of them, CD8- MAITs (arrow + asterisk) could also be found. In contrast, CD103 was rarely co-expressed on MAITs (arrow + diamond). During the iterative staining process dust particles and other detritus can be picked up by the solution flowing over the tissue creating autofluorescent artifacts (1-4). While some of these get washed away after completion of the staining cycle (1, 4), others present during multiple imaging rounds (2, 3). Scale bars, 50mum.
- Conjugate
- Near infrared dye
- Submitted by
- Invitrogen Antibodies (provider)
- Main image
- Experimental details
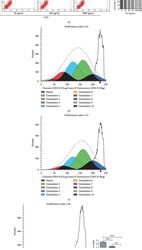
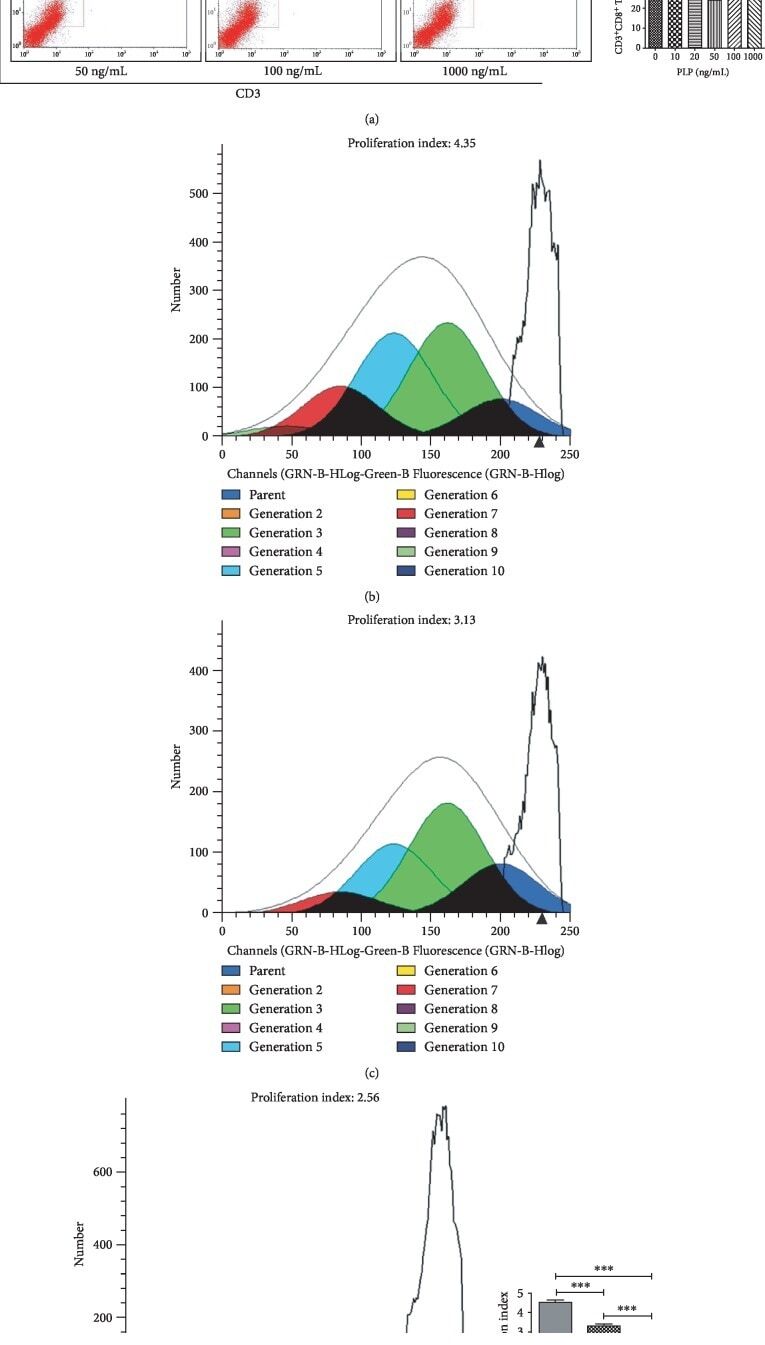
- Figure 3 Flow cytometric analysis of the proportion and proliferation ability of CD3 + CD8 + T lymphocytes. (a) Proportion of CD3 + CD8 + T lymphocytes. (b) Blank group. (c) Control group, lymphocytes cocultured with A-MSCs stimulated at 0 ng/mL PLP. (d) Treated group, lymphocytes cocultured with A-MSCs stimulated at 50 ng/mL PLP.
- Conjugate
- Near infrared dye
- Submitted by
- Invitrogen Antibodies (provider)
- Main image
- Experimental details
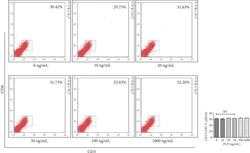
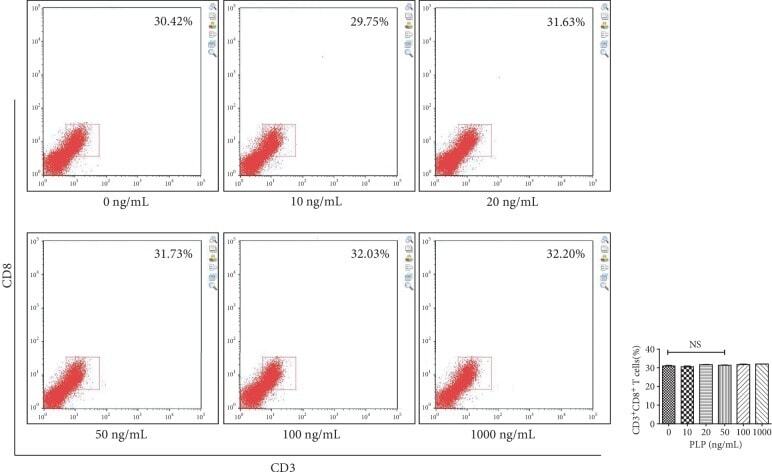
- Figure 13 Flow cytometric analysis of the proportion of CD3 + CD8 + T lymphocytes after A-MSCs coculture with TLR3 and TLR4 inhibition. There was no significant difference in the proportion of CD3 + CD8 + T lymphocytes between concentrations.
- Conjugate
- Near infrared dye
- Submitted by
- Invitrogen Antibodies (provider)
- Main image
- Experimental details
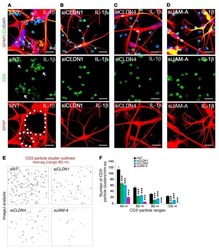
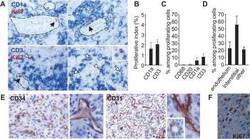
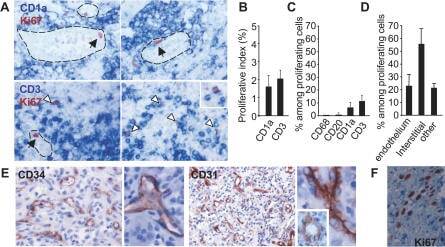
- Figure 1 Proliferating Cells in LCH Granuloma are Mostly Endothelial Cells, Fibroblasts, and T Cells Paraffin-embedded and frozen sections were stained with antibodies against Ki-67 (which label proliferating cells), CD1a (LCs), CD3 (T cells), CD20 (B cells), CD68, CD31, and CD34 (endothelial cells). (A) Double immunostaining of paraffin-embedded section from LCH eosinophilic granulomas with anti-Ki-67 Ab, (brown nuclear staining) and with anti-CD1a Ab (upper images, blue staining) or anti-CD3 Ab (lower images, blue staining). Open arrowheads indicate double-stained cells, black arrowheads indicate Ki-67 + cells with an endothelial morphology. (B) Histogram represents percentage of CD1a + cells and of CD3 + cells labeled with Ki-67 ( n = 15). (C) Histogram represents percentage of proliferating cells (Ki-67 + ) that express CD1a, CD3, CD20, or CD68 ( n = 15). (D) Histogram represents percentage of proliferating cells (Ki-67 + ) that are endothelial cells, interstitial cells (fibroblasts), and other types based on morphological examination. (E) Immunolabeling of blood vessels on paraffin-embedded section from LCH eosinophilic granulomas with CD34 (left) and CD31 (right) antibodies. (F) Proliferating Ki-67 + cells (brown nuclear staining) with a fibroblast-cell morphology in an eosinophilic granuloma.
- Conjugate
- Near infrared dye
- Submitted by
- Invitrogen Antibodies (provider)
- Main image
- Experimental details
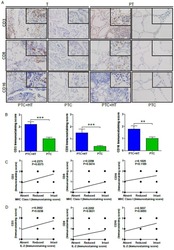
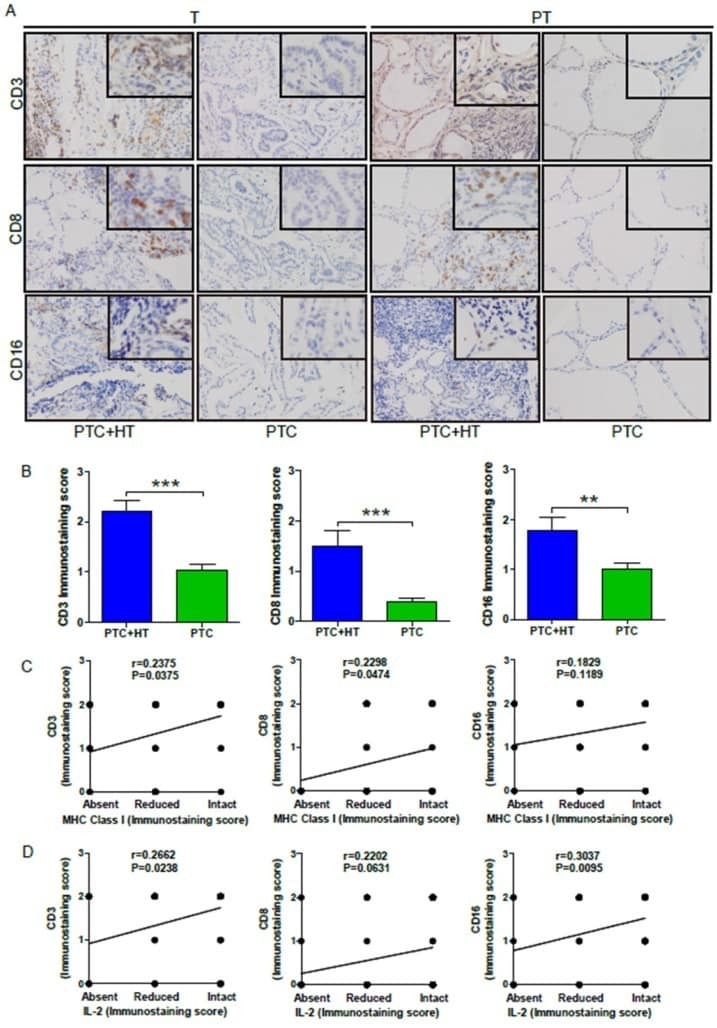
- Figure 3 UP-regulated CD3, CD8 and CD16 expression in PTC+HT tissues. A , IHC analysis of CD3, CD8, and CD16 expression in 53 PTC+HT, 91 PTC tumor (T) and their adjacent para-non-tumor tissue (PT). B , Immunostaining scores ofCD3, CD8, and CD16 expression in tumor tissues. C , The correlation between the immunostaining scores of HLA class I molecule and CD3, CD8 and CD16 expression. D , The correlation between the immunostaining scores of IL-2 and CD3, CD8 and CD16 expression. Data are representative images (magnification x 200 with a 400 inserter) or expressed as the mean +- SD of each group. * P
- Conjugate
- Near infrared dye
- Submitted by
- Invitrogen Antibodies (provider)
- Main image
- Experimental details
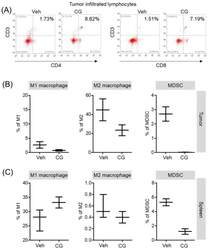
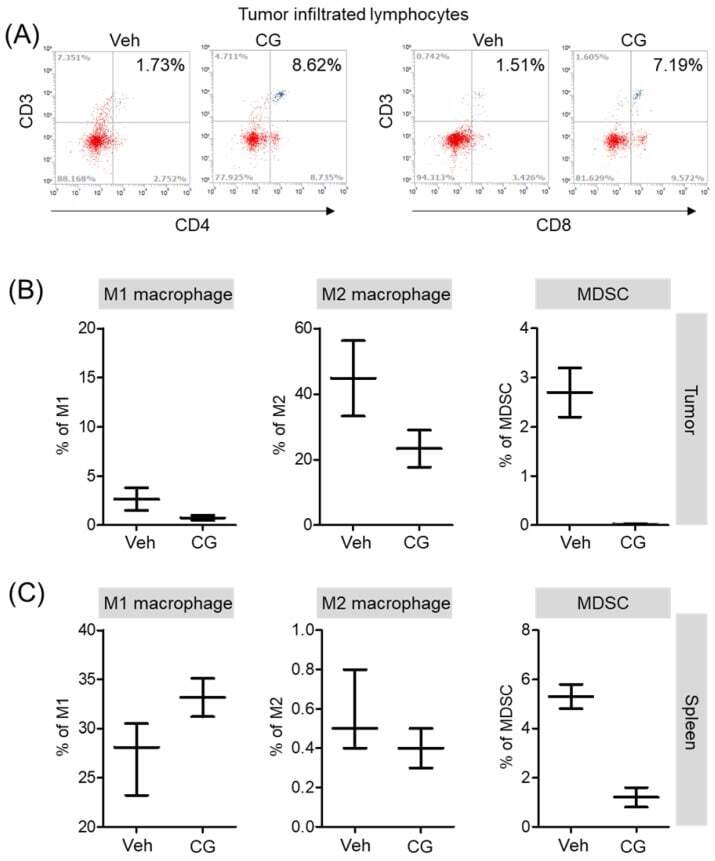
- Figure 6 The proportion of MDSCs and M1/M2 macrophage were changed by CG-745 treatment in Hepa1-6 syngeneic mouse model: (A-C) Hepa1-6 inoculated C57BL/6 mice were treated with vehicle or 15 mg/kg/day of CG (CG-745) by intraperitoneally for 5 days/week for 3 weeks. Tumor (A, B) and spleen (C) were harvested from each individual mouse. Cells were stained with fluorescence-conjugated antibodies specific to CD3, CD4, CD8, CD25 and Foxp3, and subjected to flow cytometry analysis. The graph shows means with error bars. Error bars represent standard deviations for 3 samples in each group. Results are representative of three separate experiments (A). p < 0.05.
- Conjugate
- Near infrared dye
- Submitted by
- Invitrogen Antibodies (provider)
- Main image
- Experimental details
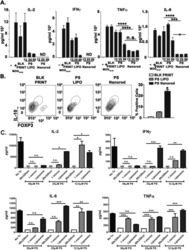
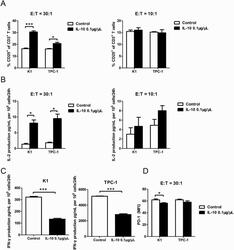
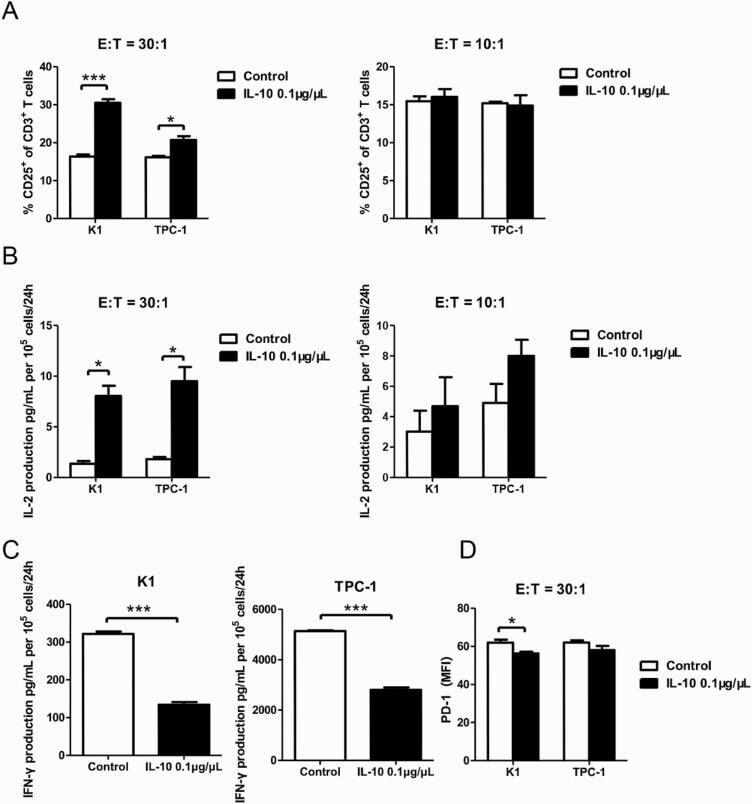
- Figure 4. IL-10 promotes T-cell activation in cocultures of CD3 + CD8 + CD25 + T cells and PTC cell lines. ( A ) Flow cytometry results of the CD25 + fraction of CD3 + T cells in coculture systems containing activated CD3 + CD8 + CD25 + T lymphocytes (effector cells, E) and pretreated PTC cells (K-1 and TPC-1 treated with 0.1 mug/muL of IL-10 for 24 hours; target cells, T) at various E:T ratios (30:1 and 10:1) (* P < 0.05, *** P < 0.001). ( B ) IL-2 production in coculture systems (details described above) measured by ELISA (* P < 0.05). ( C ) IFN-gamma production in coculture systems of CD3 + CD8 + CD25 + T lymphocytes and IL-10-stimulated PTC cells (K-1 and TPC-1) at a 30:1 ratio (*** P < 0.001). ( D ) Mean fluorescence intensity (MFI) of PD-1 expression in coculture systems of activated CD3 + CD8 + CD25 + T lymphocytes and IL-10 pretreated PTC cells at a 30:1 ratio (* P < 0.05). All tests were conducted in triplicate. ELISA, enzyme-linked immunosorbent assay; H, hours; IFN, interferon; IL, interleukin; PD-1, programmed death-1; PTC, papillary thyroid cancer.
- Conjugate
- Near infrared dye
- Submitted by
- Invitrogen Antibodies (provider)
- Main image
- Experimental details
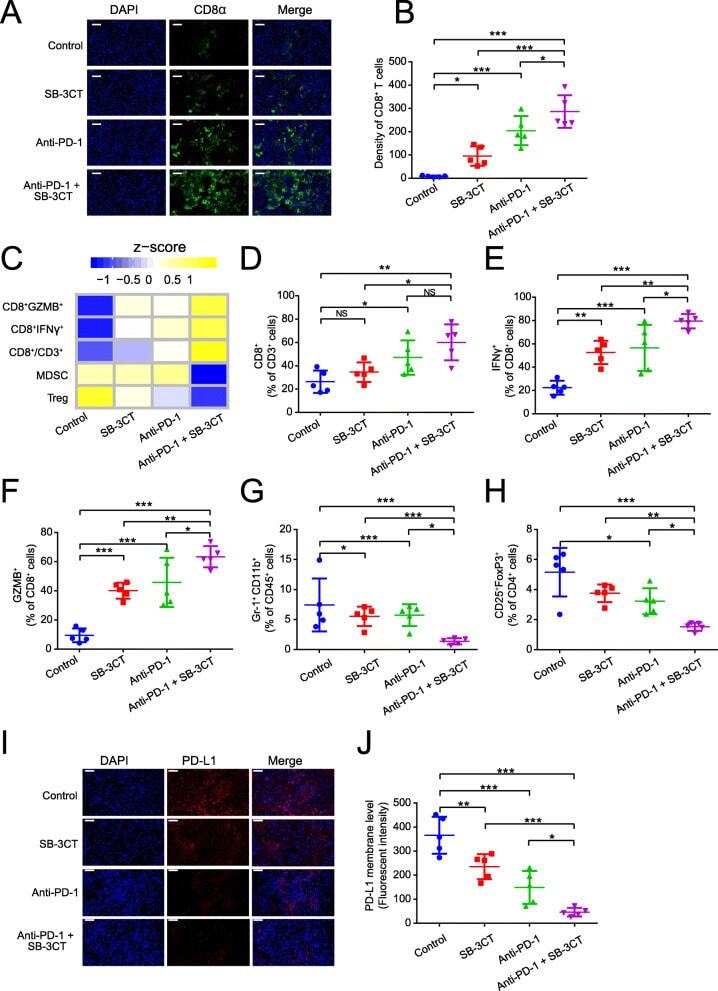
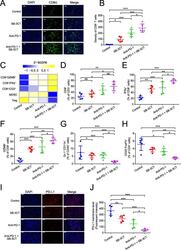
- Fig. 3 Immune features in tumors for B16F10 xenograft mouse model with SB-3CT treatment. a Fluorescence expression and b quantification of CD8 + T cells. c Heatmap of Z -score normalized percentage of immune cell populations ( d - h ) in TILs for B16F10 tumor-bearing mice treated with anti-PD-1 and SB-3CT in combination or alone. d - h In the implanted B16F10 tumors from mice treated with or without SB-3CT and PD-1 blockade, fluorescence-activated cell sorting (FACS) was used to measure d CD8 + in CD3 + T cells, e CD8 + IFNgamma + in CD8 + T cells, f CD8 + GZMB + in CD8 + T cells, g Gr-1 + CD11b + MDSCs in CD45 + cells, and h CD25 + FOXP3 + Treg in CD4 + cells. i Fluorescence expression and j quantification of PD-L1 in B16F10 tumor-bearing wild-type C57/BL6 mice treated with isotype, SB-3CT, anti-PD-1, or combination strategy. Sample size is 5 in each cohort. Scale bars, 50 mum. Results are mean +- s.d. ns, p > 0.05,* p < 0.05, ** p < 0.01, and *** p < 0.001, as determined by one-way ANOVA and Dunnett's multiple comparison test
- Conjugate
- Near infrared dye