Explore
 Validate
 Learn
LearnMA1-06101
antibody from Invitrogen Antibodies
Targeting: LMNA
CMD1A, HGPS, LGMD1B, LMN1, LMNL1, MADA, PRO1
 Western blot
 Immunocytochemistry Immunohistochemistry
 Flow cytometry Chromatin Immunoprecipitation Other assay
Antibody data
- Antibody Data
- Antigen structure
- References [4]
- Comments [0]
- Validations
- Immunocytochemistry [5]
- Immunohistochemistry [2]
- Chromatin Immunoprecipitation [1]
- Other assay [2]
Submit
Validation data
Reference
Comment
Report error
- Product number
- MA1-06101 - Provider product page

- Provider
- Invitrogen Antibodies
- Product name
- Lamin A Monoclonal Antibody (133A2)
- Antibody type
- Monoclonal
- Antigen
- Purifed from natural sources
- Description
- MA1-06101 detects lamin A in human, mouse, rat, bovine and canine samples. MA1-06101 has sucessfully been used in immunocytochemistry, immunohistochemistry (paraffin), flow cytometry, and Western blotting procedures. The MA1-06101 immunogen is partially purified recombinant human lamin A.
- Reactivity
- Human, Mouse, Rat, Bovine, Canine
- Host
- Mouse
- Isotype
- IgG
- Antibody clone number
- 133A2
- Vial size
- 100 μg
- Concentration
- 1 mg/mL
- Storage
- Store at 4°C short term. For long term storage, store at -20°C, avoiding freeze/thaw cycles.
Submitted references Vascular senescence in progeria: role of endothelial dysfunction.
Mechanical phenotyping reveals unique biomechanical responses in retinoic acid-resistant acute promyelocytic leukemia.
Apico-basal cell compression regulates Lamin A/C levels in epithelial tissues.
Dysfunction of iPSC-derived endothelial cells in human Hutchinson-Gilford progeria syndrome.
Xu Q, Mojiri A, Boulahouache L, Morales E, Walther BK, Cooke JP
European heart journal open 2022 Jul;2(4):oeac047
European heart journal open 2022 Jul;2(4):oeac047
Mechanical phenotyping reveals unique biomechanical responses in retinoic acid-resistant acute promyelocytic leukemia.
Li B, Maslan A, Kitayama SE, Pierce C, Streets AM, Sohn LL
iScience 2022 Feb 18;25(2):103772
iScience 2022 Feb 18;25(2):103772
Apico-basal cell compression regulates Lamin A/C levels in epithelial tissues.
Iyer KV, Taubenberger A, Zeidan SA, Dye NA, Eaton S, Jülicher F
Nature communications 2021 Mar 25;12(1):1756
Nature communications 2021 Mar 25;12(1):1756
Dysfunction of iPSC-derived endothelial cells in human Hutchinson-Gilford progeria syndrome.
Matrone G, Thandavarayan RA, Walther BK, Meng S, Mojiri A, Cooke JP
Cell cycle (Georgetown, Tex.) 2019 Oct;18(19):2495-2508
Cell cycle (Georgetown, Tex.) 2019 Oct;18(19):2495-2508
No comments: Submit comment
Supportive validation
- Submitted by
- Invitrogen Antibodies (provider)
- Main image

- Experimental details
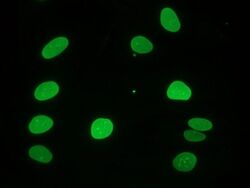
- Immunocytochemical staining of fiboblasts showing nuclear lamina stained with Lamin A monoclonal antibody (Product # MA1-06101).
- Submitted by
- Invitrogen Antibodies (provider)
- Main image
- Experimental details
- Immunocytochemical staining of fiboblasts showing nuclear lamina stained with Lamin A monoclonal antibody (Product # MA1-06101).
- Submitted by
- Invitrogen Antibodies (provider)
- Main image

- Experimental details
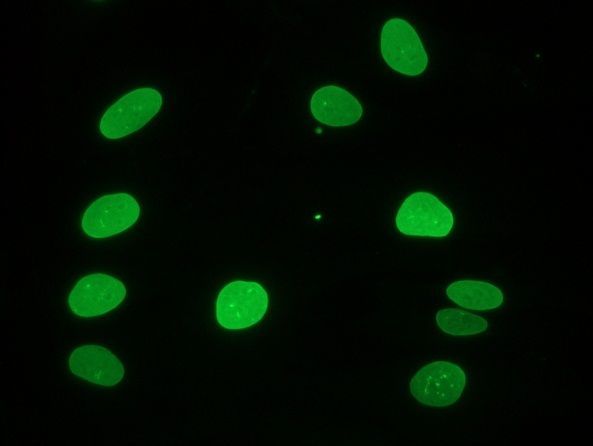
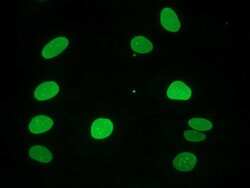
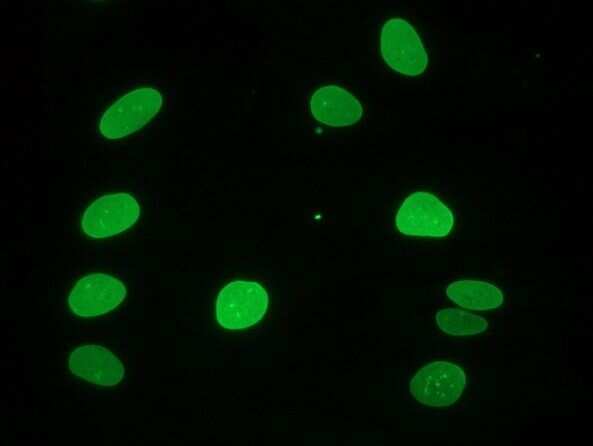
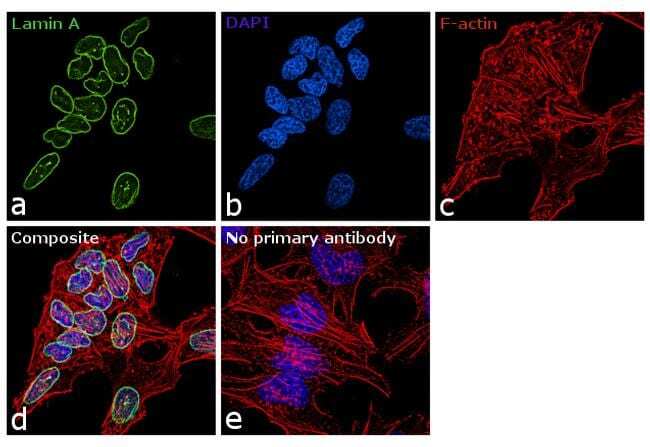
- Immunofluorescence analysis of Lamin A was performed using 70% confluent log phase HeLa cells. The cells were fixed with 4% paraformaldehyde for 10 minutes, permeabilized with 0.1% Triton™ X-100 for 10 minutes, and blocked with 1% BSA for 1 hour at room temperature. The cells were labeled with Lamin A Monoclonal Antibody (133A2) (Product # MA1-06101) at 5 µg/mL in 0.1% BSA and incubated overnight at 4 degree and then labeled with Goat anti-Mouse IgG (H+L) Superclonal™ Secondary Antibody, Alexa Fluor® 488 conjugate (Product # A28175) at a dilution of 1:2000 for 45 minutes at room temperature (Panel a: green). Nuclei (Panel b: blue) were stained with SlowFade® Diamond Antifade Mountant with DAPI (Product # P36962). F-actin (Panel c: red) was stained with Rhodamine Phalloidin (Product # R415, 1:300). Panel d represents the merged image showing nuclear membrane localization. Panel e shows the no primary antibody control. The images were captured at 60X magnification.
- Submitted by
- Invitrogen Antibodies (provider)
- Main image
- Experimental details
- Immunocytochemical staining of fiboblasts showing nuclear lamina stained with Lamin A monoclonal antibody (Product # MA1-06101).

- Submitted by
- Invitrogen Antibodies (provider)
- Main image

- Experimental details
- Immunofluorescence analysis of Lamin A was performed using 70% confluent log phase HeLa cells. The cells were fixed with 4% paraformaldehyde for 10 minutes, permeabilized with 0.1% Triton™ X-100 for 10 minutes, and blocked with 1% BSA for 1 hour at room temperature. The cells were labeled with Lamin A Monoclonal Antibody (133A2) (Product # MA1-06101) at 5 µg/mL in 0.1% BSA and incubated overnight at 4 degree and then labeled with Goat anti-Mouse IgG (H+L) Superclonal™ Secondary Antibody, Alexa Fluor® 488 conjugate (Product # A28175) at a dilution of 1:2000 for 45 minutes at room temperature (Panel a: green). Nuclei (Panel b: blue) were stained with SlowFade® Diamond Antifade Mountant with DAPI (Product # P36962). F-actin (Panel c: red) was stained with Rhodamine Phalloidin (Product # R415, 1:300). Panel d represents the merged image showing nuclear membrane localization. Panel e shows the no primary antibody control. The images were captured at 60X magnification.

Supportive validation
- Submitted by
- Invitrogen Antibodies (provider)
- Main image
- Experimental details
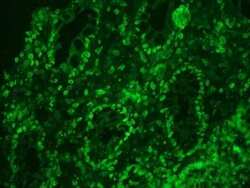
- Immunohistochemistry on frozen sections of human colon showing nuclear lamina staining in epithelial and connective tissue cells stained with Lamin A monoclonal antibody (Product # MA1-06101).

- Submitted by
- Invitrogen Antibodies (provider)
- Main image

- Experimental details
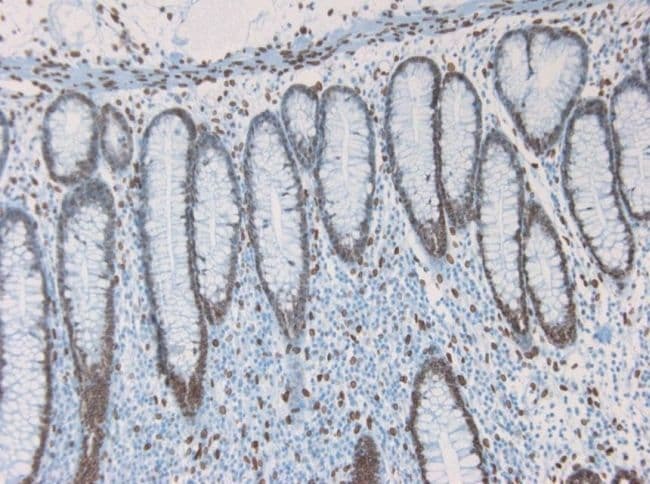
- Immunohistochemistry on paraffin section of human colon stained with Lamin A monoclonal antibody (Product # MA1-06101).
Supportive validation
- Submitted by
- Invitrogen Antibodies (provider)
- Main image

- Experimental details
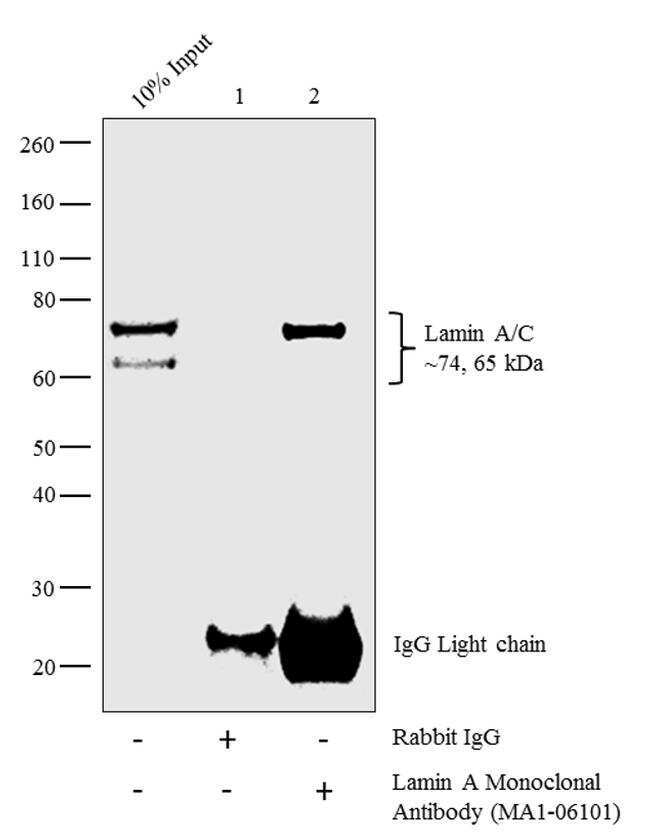
- Chromatin Immunoprecipitation-Western Blot (ChIP-WB) of endogenous Lamin A protein using Anti-Lamin A Antibody: ChIP was performed using Lamin A Mouse Monoclonal Antibody (Product # MA1-06101, 10 µg) (lane 2) on sheared chromatin from 4 million formaldehyde fixed HeLa cells. Normal Rabbit IgG (lane 1) was used as negative IP control. Western blot analysis of immunoprecipitated proteins was performed using Lamin A/C Mouse Monoclonal Antibody (Product # MA1-5820, 1:200 dilution).
Supportive validation
- Submitted by
- Invitrogen Antibodies (provider)
- Main image
- Experimental details
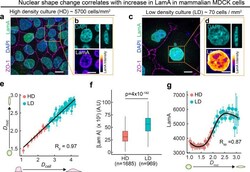
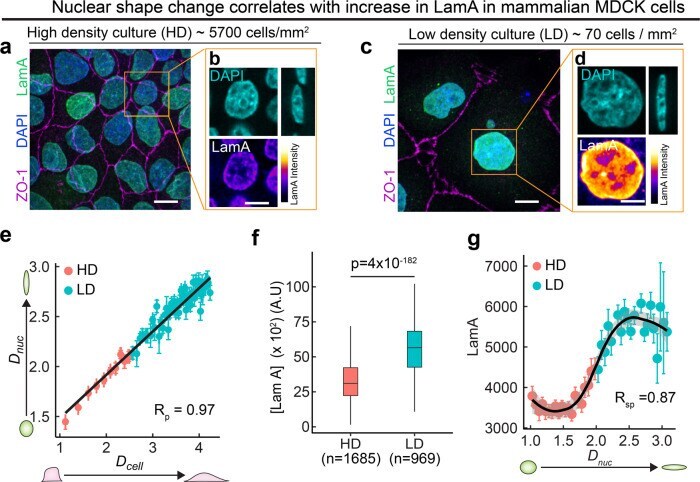
- Fig. 6 Regulation of Lamin A/C by apico-basal cell compression is also observed in mammalian epithelial cells. a Image showing high-density culture of 5700 cells/mm 2 . Tight junction protein ZO-1 is shown in magenta, Lamin A in green, and DAPI in blue. Scalebar, 15 um. b Enlarged images of the region shown by the orange ROI in ( h ). DAPI is shown in blue and Lamin A is shown in color-coded intensity. Scale bar, 10 um. c Image showing low density culture of 70 cells/ mm 2 . Tight junction protein ZO-1 is shown in magenta, Lamin A in green, and DAPI in blue. Scalebar, 15 um. d Enlarged images of the region shown by orange ROI in ( j ). DAPI is shown in blue, and Lamin A is shown in color-coded intensity. Scale bar, 10 um. e Binned scatter plot between D cell and D nuc generated by binning D cell in bins of 0.07. Each point in the plot represents mean value of D cell and D nuc in the bin. The red points represent data from HD culture and cyan points represent data from LD culture. The data are presented as mean +- S.E.M. Solid red line represents the linear regression to the data. Pearson's correlation coefficient R p is 0.97. f Box-plot showing LamA in high density (HD) and low density (LD) cultures. The sample number, n represents the number of cells analyzed over 3 independent biological replicates. g Binned scatter plot between D nuc and LamA intensity generated by binning D nuc in bins of 0.06. Each point in the plot represents mean value of D nuc and LamA in the bin. The
- Submitted by
- Invitrogen Antibodies (provider)
- Main image
- Experimental details
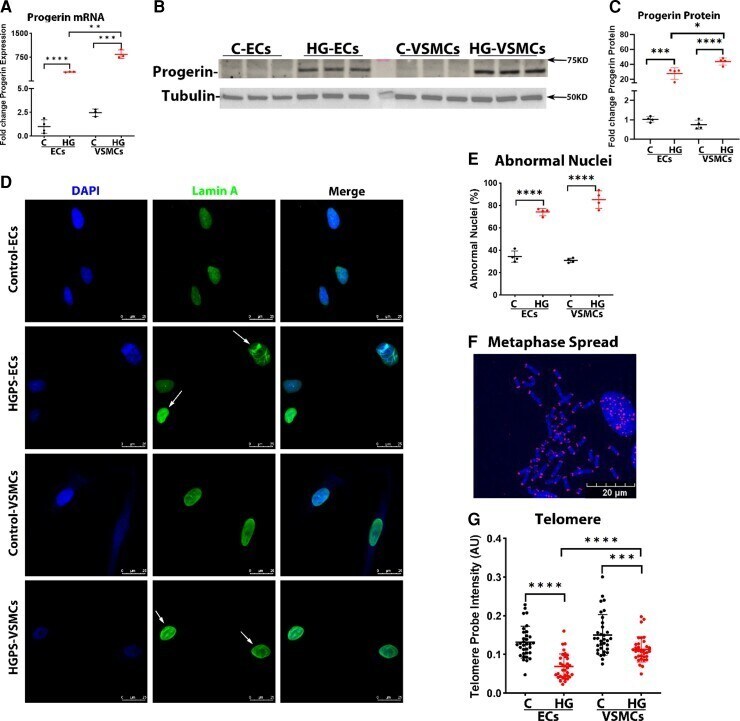
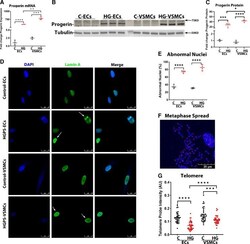
- Progerin causes senescence phenotype in both endothelial cells and vascular smooth muscle cells of Hutchinson-Gilford progeria syndrome. ( A ) Quantitative reverse transcription polymerase chain reaction for progerin expression in endothelial cells and vascular smooth muscle cells. n = 4 for control-ECs, and n = 3 for other groups. ( B and C ) Western blot and its quantification of progerin level in endothelial cells and vascular smooth muscle cells. n = 4. ( D ) Immunofluorescence staining of lamin A for nuclear morphology and quantification in ( E ); the white arrows represent abnormal nuclei. n = 4. ( F ) A representative figure of metaphase spread (blue: DAPI nucleus, red: cy5 telomere, scale bar: 20 mum). ( G ) Telomere probe intensities were normalized with the DAPI signal for both endothelial cells and vascular smooth muscle cells, n = 33 metaphase spread for each group, replicated at least three times. ( H ) Real-time cell proliferation using xCELLigence measured by impedance for both endothelial cells and vascular smooth muscle cells from control and Hutchinson-Gilford progeria syndrome. n = 4, replicated three times. ( I and J ) Increased beta-galactosidase staining in both HGPS-ECs and HGPS-VSMCs compared with respective controls, with an especially higher percentage in HGPS-ECs among all groups (scale bar: 300 mum) n = 5 for HGPS-ECs, n = 4 for other groups. ( K ) Quantitative reverse transcription polymerase chain reaction for P16 and P21 expression in endothelia