 Explore
 Validate
 Learn
LearnMA3-1000
antibody from Invitrogen Antibodies
Targeting: LMNA
CMD1A, HGPS, LGMD1B, LMN1, LMNL1, MADA, PRO1
 Western blot
 Immunohistochemistry
Antibody data
- Antibody Data
- Antigen structure
- References [26]
- Comments [0]
- Validations
- Western blot [3]
- Immunocytochemistry [9]
- Other assay [16]
Submit
Validation data
Reference
Comment
Report error
- Product number
- MA3-1000 - Provider product page

- Provider
- Invitrogen Antibodies
- Product name
- Lamin A/C Monoclonal Antibody (mab636)
- Antibody type
- Monoclonal
- Antigen
- Other
- Description
- MA3-1000 detects lamin A/C from human, bovine, porcine and canine samples. MA3-1000 has been successfully used in Western blot, immunofluorescence and immunohistochemistry procedures. By Western blot, this antibody detects ~ 70 and 65 kDa proteins corresponding to lamin A and C, respectively, from HeLa cell extract. This antibody can also be used for immunofluorescence and immunohistochemistry for subcellular localization experiments. MA3-1000 has been widely used for detection of lamin A/C control in siRNA experiments. The MA3-1000 antigen is porcine lamin preparation.
- Reactivity
- Human, Bovine, Porcine
- Host
- Mouse
- Isotype
- IgG
- Antibody clone number
- mab636
- Vial size
- 200 µL
- Concentration
- 1 mg/mL
- Storage
- -20° C, Avoid Freeze/Thaw Cycles
Submitted references RNA 5-methylcytosine status is associated with DNMT2/TRDMT1 nuclear localization in osteosarcoma cell lines.
iMyoblasts for ex vivo and in vivo investigations of human myogenesis and disease modeling.
A human infertility-associated KASH5 variant promotes mitochondrial localization.
HMGB1 enhances chemotherapy resistance in multiple myeloma cells by activating the nuclear factor-κB pathway.
Integrative Proteomic and Phosphoproteomic Analyses of Granulosa Cells During Follicular Atresia in Porcine.
Human MuStem Cell Grafting into Infarcted Rat Heart Attenuates Adverse Tissue Remodeling and Preserves Cardiac Function.
Myogenic Progenitor Cell Lineage Specification by CRISPR/Cas9-Based Transcriptional Activators.
Surface Roughness Gradients Reveal Topography-Specific Mechanosensitive Responses in Human Mesenchymal Stem Cells.
Proteomics Profiling of KAIMRC1 in Comparison to MDA-MB231 and MCF-7.
Placental Expression of NEMO Protein in Normal Pregnancy and Preeclampsia.
TcellSubC: An Atlas of the Subcellular Proteome of Human T Cells.
Inhibition of JAK-STAT Signaling with Baricitinib Reduces Inflammation and Improves Cellular Homeostasis in Progeria Cells.
A positive feedback loop involving nuclear factor IB and calpain 1 suppresses glioblastoma cell migration.
Upregulation of tryptophanyl-tRNA synthethase adapts human cancer cells to nutritional stress caused by tryptophan degradation.
Protein interaction and functional data indicate MTHFD2 involvement in RNA processing and translation.
Exploring Modifications of an HIV-1 Capsid Inhibitor: Design, Synthesis, and Mechanism of Action.
Mechanical stability of the cell nucleus - roles played by the cytoskeleton in nuclear deformation and strain recovery.
Differentiation alters stem cell nuclear architecture, mechanics, and mechano-sensitivity.
Association between cytoplasmic CRABP2, altered retinoic acid signaling, and poor prognosis in glioblastoma.
Human Cytomegalovirus pUL93 Links Nucleocapsid Maturation and Nuclear Egress.
Progerin impairs chromosome maintenance by depleting CENP-F from metaphase kinetochores in Hutchinson-Gilford progeria fibroblasts.
Perinuclear localization of the HIV-1 regulatory protein Vpr is important for induction of G2-arrest.
Identification of RANBP16 and RANBP17 as novel interaction partners for the bHLH transcription factor E12.
Myosin Vb localises to nucleoli and associates with the RNA polymerase I transcription complex.
Duplexes of 21-nucleotide RNAs mediate RNA interference in cultured mammalian cells.
Induction of nuclear lamins A/C in macrophages in in vitro cultures of rat bone marrow precursor cells and human blood monocytes, and in macrophages elicited in vivo by thioglycollate stimulation.
Betlej G, Ząbek T, Lewińska A, Błoniarz D, Rzeszutek I, Wnuk M
Journal of bone oncology 2022 Oct;36:100448
Journal of bone oncology 2022 Oct;36:100448
iMyoblasts for ex vivo and in vivo investigations of human myogenesis and disease modeling.
Guo D, Daman K, Chen JJ, Shi MJ, Yan J, Matijasevic Z, Rickard AM, Bennett MH, Kiselyov A, Zhou H, Bang AG, Wagner KR, Maehr R, King OD, Hayward LJ, Emerson CP Jr
eLife 2022 Jan 25;11
eLife 2022 Jan 25;11
A human infertility-associated KASH5 variant promotes mitochondrial localization.
Bentebbal SA, Meqbel BR, Salter A, Allan V, Burke B, Horn HF
Scientific reports 2021 May 12;11(1):10133
Scientific reports 2021 May 12;11(1):10133
HMGB1 enhances chemotherapy resistance in multiple myeloma cells by activating the nuclear factor-κB pathway.
Ning J, Yang R, Wang H, Cui L
Experimental and therapeutic medicine 2021 Jul;22(1):705
Experimental and therapeutic medicine 2021 Jul;22(1):705
Integrative Proteomic and Phosphoproteomic Analyses of Granulosa Cells During Follicular Atresia in Porcine.
Yang F, Liu Q, Chen Y, Ye H, Wang H, Zeng S
Frontiers in cell and developmental biology 2020;8:624985
Frontiers in cell and developmental biology 2020;8:624985
Human MuStem Cell Grafting into Infarcted Rat Heart Attenuates Adverse Tissue Remodeling and Preserves Cardiac Function.
Rannou A, Toumaniantz G, Larcher T, Leroux I, Ledevin M, Hivonnait A, Babarit C, Fleurisson R, Dubreil L, Ménoret S, Anegon I, Charpentier F, Rouger K, Guével L
Molecular therapy. Methods & clinical development 2020 Sep 11;18:446-463
Molecular therapy. Methods & clinical development 2020 Sep 11;18:446-463
Myogenic Progenitor Cell Lineage Specification by CRISPR/Cas9-Based Transcriptional Activators.
Kwon JB, Vankara A, Ettyreddy AR, Bohning JD, Gersbach CA
Stem cell reports 2020 May 12;14(5):755-769
Stem cell reports 2020 May 12;14(5):755-769
Surface Roughness Gradients Reveal Topography-Specific Mechanosensitive Responses in Human Mesenchymal Stem Cells.
Hou Y, Xie W, Yu L, Camacho LC, Nie C, Zhang M, Haag R, Wei Q
Small (Weinheim an der Bergstrasse, Germany) 2020 Mar;16(10):e1905422
Small (Weinheim an der Bergstrasse, Germany) 2020 Mar;16(10):e1905422
Proteomics Profiling of KAIMRC1 in Comparison to MDA-MB231 and MCF-7.
Alghanem B, Ali R, Nehdi A, Al Zahrani H, Altolayyan A, Shaibah H, Baz O, Alhallaj A, Moresco JJ, Diedrich JK, Yates JR 3rd, Boudjelal M
International journal of molecular sciences 2020 Jun 18;21(12)
International journal of molecular sciences 2020 Jun 18;21(12)
Placental Expression of NEMO Protein in Normal Pregnancy and Preeclampsia.
Sakowicz A, Lisowska M, Biesiada L, Płuciennik E, Gach A, Rybak-Krzyszkowska M, Huras H, Sakowicz B, Romanowicz H, Piastowska-Ciesielska AW, Grzesiak M, Pietrucha T
Disease markers 2019;2019:8418379
Disease markers 2019;2019:8418379
TcellSubC: An Atlas of the Subcellular Proteome of Human T Cells.
Joshi RN, Stadler C, Lehmann R, Lehtiö J, Tegnér J, Schmidt A, Vesterlund M
Frontiers in immunology 2019;10:2708
Frontiers in immunology 2019;10:2708
Inhibition of JAK-STAT Signaling with Baricitinib Reduces Inflammation and Improves Cellular Homeostasis in Progeria Cells.
Liu C, Arnold R, Henriques G, Djabali K
Cells 2019 Oct 18;8(10)
Cells 2019 Oct 18;8(10)
A positive feedback loop involving nuclear factor IB and calpain 1 suppresses glioblastoma cell migration.
Vo TM, Jain S, Burchett R, Monckton EA, Godbout R
The Journal of biological chemistry 2019 Aug 23;294(34):12638-12654
The Journal of biological chemistry 2019 Aug 23;294(34):12638-12654
Upregulation of tryptophanyl-tRNA synthethase adapts human cancer cells to nutritional stress caused by tryptophan degradation.
Adam I, Dewi DL, Mooiweer J, Sadik A, Mohapatra SR, Berdel B, Keil M, Sonner JK, Thedieck K, Rose AJ, Platten M, Heiland I, Trump S, Opitz CA
Oncoimmunology 2018;7(12):e1486353
Oncoimmunology 2018;7(12):e1486353
Protein interaction and functional data indicate MTHFD2 involvement in RNA processing and translation.
Koufaris C, Nilsson R
Cancer & metabolism 2018;6:12
Cancer & metabolism 2018;6:12
Exploring Modifications of an HIV-1 Capsid Inhibitor: Design, Synthesis, and Mechanism of Action.
Xu JP, Francis AC, Meuser ME, Mankowski M, Ptak RG, Rashad AA, Melikyan GB, Cocklin S
Journal of drug design and research 2018;5(2)
Journal of drug design and research 2018;5(2)
Mechanical stability of the cell nucleus - roles played by the cytoskeleton in nuclear deformation and strain recovery.
Wang X, Liu H, Zhu M, Cao C, Xu Z, Tsatskis Y, Lau K, Kuok C, Filleter T, McNeill H, Simmons CA, Hopyan S, Sun Y
Journal of cell science 2018 Jul 4;131(13)
Journal of cell science 2018 Jul 4;131(13)
Differentiation alters stem cell nuclear architecture, mechanics, and mechano-sensitivity.
Heo SJ, Driscoll TP, Thorpe SD, Nerurkar NL, Baker BM, Yang MT, Chen CS, Lee DA, Mauck RL
eLife 2016 Nov 30;5
eLife 2016 Nov 30;5
Association between cytoplasmic CRABP2, altered retinoic acid signaling, and poor prognosis in glioblastoma.
Liu RZ, Li S, Garcia E, Glubrecht DD, Poon HY, Easaw JC, Godbout R
Glia 2016 Jun;64(6):963-76
Glia 2016 Jun;64(6):963-76
Human Cytomegalovirus pUL93 Links Nucleocapsid Maturation and Nuclear Egress.
DeRussy BM, Boland MT, Tandon R
Journal of virology 2016 Aug 15;90(16):7109-7117
Journal of virology 2016 Aug 15;90(16):7109-7117
Progerin impairs chromosome maintenance by depleting CENP-F from metaphase kinetochores in Hutchinson-Gilford progeria fibroblasts.
Eisch V, Lu X, Gabriel D, Djabali K
Oncotarget 2016 Apr 26;7(17):24700-18
Oncotarget 2016 Apr 26;7(17):24700-18
Perinuclear localization of the HIV-1 regulatory protein Vpr is important for induction of G2-arrest.
Sörgel S, Fraedrich K, Votteler J, Thomas M, Stamminger T, Schubert U
Virology 2012 Oct 25;432(2):444-51
Virology 2012 Oct 25;432(2):444-51
Identification of RANBP16 and RANBP17 as novel interaction partners for the bHLH transcription factor E12.
Lee JH, Zhou S, Smas CM
Journal of cellular biochemistry 2010 Sep 1;111(1):195-206
Journal of cellular biochemistry 2010 Sep 1;111(1):195-206
Myosin Vb localises to nucleoli and associates with the RNA polymerase I transcription complex.
Lindsay AJ, McCaffrey MW
Cell motility and the cytoskeleton 2009 Dec;66(12):1057-72
Cell motility and the cytoskeleton 2009 Dec;66(12):1057-72
Duplexes of 21-nucleotide RNAs mediate RNA interference in cultured mammalian cells.
Elbashir SM, Harborth J, Lendeckel W, Yalcin A, Weber K, Tuschl T
Nature 2001 May 24;411(6836):494-8
Nature 2001 May 24;411(6836):494-8
Induction of nuclear lamins A/C in macrophages in in vitro cultures of rat bone marrow precursor cells and human blood monocytes, and in macrophages elicited in vivo by thioglycollate stimulation.
Röber RA, Gieseler RK, Peters JH, Weber K, Osborn M
Experimental cell research 1990 Oct;190(2):185-94
Experimental cell research 1990 Oct;190(2):185-94
No comments: Submit comment
Supportive validation
- Submitted by
- Invitrogen Antibodies (provider)
- Main image

- Experimental details
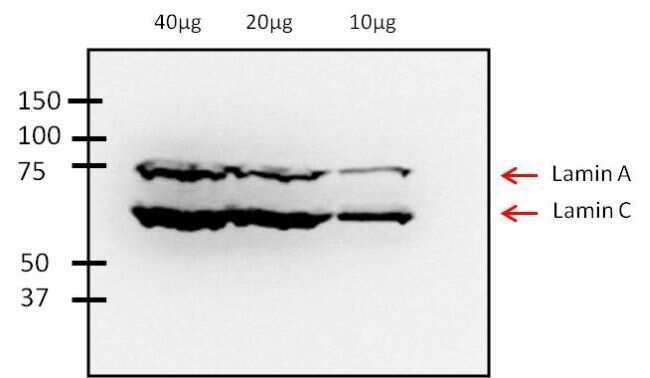
- Western blot analysis of Lamin A/C was performed by loading various amounts of Human fibroblast whole cell lysate onto a 10% SDS-PAGE gel. Proteins were transferred to a nitrocellulose membrane and blocked with PBS-0.002% Tween-20 containing 3% non-fat dry milk for at least 1 hour. Membranes were probed with a mouse monoclonal antibody recognizing Lamin A/C (Product # MA3-1000) at a dilution of 1:2000 overnight at 4°C on a rocking platform. Membranes were then washed in PBS-0.002% Tween-20 and probed with a goat anti-mouse-HRP secondary antibody (Product # 32430) at a dilution of 1:20,000 for at least one hour. Membranes were washed and chemiluminescent detection was performed using Super Signal West Pico (Product # 34087).
- Submitted by
- Invitrogen Antibodies (provider)
- Main image
- Experimental details
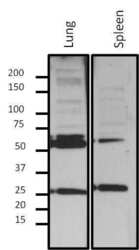
- Western blot analysis of Lamin A/C was performed by loading 10 µg nuclear extract from fractionated mouse tissue lysate onto a 4-20% Tris-HCl polyacrylamide gel. Proteins were transferred to a PVDF membrane and blocked with 5% BSA/TBST for at least 1 hour. Membranes were then probed with a mouse monoclonal antibody recognizing phospho-Lamin A/C (Product # MA3-1000) at a dilution of 1:500 overnight at 4°C on a rocking platform. Membranes were then washed in TBS-0.1%Tween 20 and probed with a goat anti-mouse-HRP secondary antibody (Product # 31430) at a dilution of 1:15000 for at least one hour. Membranes were washed and chemiluminescent detection was performed using Super Signal West Dura (Product # 34075).

- Submitted by
- Invitrogen Antibodies (provider)
- Main image

- Experimental details
- CRISPR-Cas9 mediated genome editing ofLamin A (as confirmed by next generation sequencing) was achieved by using LentiArray™ Lentiviral sgRNA (Product # A32042, AssayID CRISPR817702_LV) and LentiArray Cas9 Lentivirus (Product # A32064). Fig (a) Western blot analysis of Lamin A was performed by loading 30 µg of HeLa Cas9 (Lane 1) and HeLa Cas9 cells transduced with Lamin A Lentiviral sgRNA (Lane 2) modified whole cell extracts. The samples were electrophoresed using NuPAGE™ Novex™ 4-12% Bis-Tris Protein Gel (Product # NP0322BOX). Resolved proteins were then transferred onto a nitrocellulose membrane (Product # IB23001) by iBlot® 2 Dry Blotting System (Product # IB21001). The blot was probed with Anti-Lamin A/C Monoclonal Antibody (mab636) (Product # MA3-1000) using 1:2000 dilution and Goat anti-Mouse IgG (H+L) Superclonal™ Recombinant Secondary Antibody, HRP (Product # A28177 1:20000 dilution).Chemiluminescent detection was performed using SuperSignal™ West Dura Extended Duration Substrate (Product # 34076). A loss of signal in sgRNA transduced cells using the LentiArray™ CRISPR product line confirms that antibody is specific toLamin A (Fig (b)).

Supportive validation
- Submitted by
- Invitrogen Antibodies (provider)
- Main image

- Experimental details
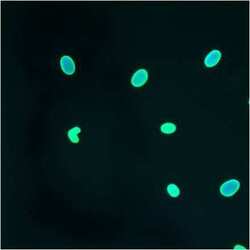
- Immunofluorescent analysis of Lamin A/C using anti-Lamin A/C monoclonal antibody (Product # MA3-1000) shows staining in HMVEC Cells.

- Submitted by
- Invitrogen Antibodies (provider)
- Main image

- Experimental details
- Immunofluorescent analysis of Lamin A/C using anti-Lamin A/C monoclonal antibody (Product # MA3-1000) shows staining in A549 Cells.

- Submitted by
- Invitrogen Antibodies (provider)
- Main image
- Experimental details
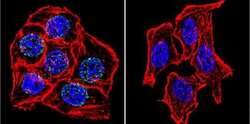
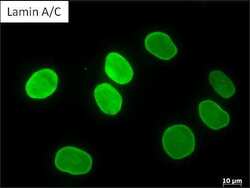
- Immunofluorescent analysis of Lamin A/C using Lamin A/C Monoclonal Antibody (mab636) (Product # MA3-1000) shows staining in Hela Cells. Lamin A/C (green), F-Actin staining with Phalloidin (red) and nuclei with DAPI (blue) is shown. Cells were grown on chamber slides and fixed with formaldehyde prior to staining. Cells were probed without (control) or with an antibody recognizing Lamin A/C (Product # MA3-1000) at a dilution of 1:20 over night at 4 °C, washed with PBS and incubated with a DyLight-488 conjugated secondary antibody (Product # 35552 for GAR, Product # 35503 for GAM). Images were taken at 60X magnification.

- Submitted by
- Invitrogen Antibodies (provider)
- Main image
- Experimental details
- Immunofluorescent analysis of Lamin A/C using anti-Lamin A/C monoclonal antibody (Product # MA3-1000) shows staining in HMVEC Cells.

- Submitted by
- Invitrogen Antibodies (provider)
- Main image

- Experimental details
- Immunofluorescent analysis of Lamin A/C using Lamin A/C Monoclonal Antibody (mab636) (Product # MA3-1000) shows staining in U251 Cells. Lamin A/C (green), F-Actin staining with Phalloidin (red) and nuclei with DAPI (blue) is shown. Cells were grown on chamber slides and fixed with formaldehyde prior to staining. Cells were probed without (control) or with an antibody recognizing Lamin A/C (Product # MA3-1000) at a dilution of 1:200 over night at 4 °C, washed with PBS and incubated with a DyLight-488 conjugated secondary antibody (Product # 35552 for GAR, Product # 35503 for GAM). Images were taken at 60X magnification.

- Submitted by
- Invitrogen Antibodies (provider)
- Main image

- Experimental details
- Immunofluorescent analysis of Lamin A/C (red) in MDCK cells. The cells were permeabilized with 0.1% Triton X-100 in PBS for 15 minutes, and blocked with 3% BSA in PBS (Product # 37525) for 15 minutes at room temperature. Cells were stained with a Lamin A/C mouse monoclonal antibody (Product # MA3-1000), at a dilution 1:100 in blocking buffer for at least 1 hour at room temperature, and then incubated with a Rabbit anti-Mouse IgG (H+L) Superclonal™ Secondary Antibody, Alexa Fluor® 594 conjugate (Product # A27027) at a dilution of 1:1000 for 30 minutes at room temperature (red). Nuclei (blue) were stained with Hoechst 33342 dye (Product # 62249). Images were taken on a Thermo Scientific ToxInsight Instrument at 20X magnification.

- Submitted by
- Invitrogen Antibodies (provider)
- Main image

- Experimental details
- Immunofluorescent analysis of Lamin A/C (red) in HeLa cells at high magnification.

- Submitted by
- Invitrogen Antibodies (provider)
- Main image

- Experimental details
- Immunofluorescent analysis of Lamin A/C (green) in untreated U2-OS cells (A) or HeLa cells (B). Formalin fixed cells were permeabilized with 0.1% Triton X-100 in TBS for 10 minutes at room temperature. Cells were then blocked with 0.3% BSA for 15 minutes at room temperature. Cells were then probed with a mouse monoclonal antibody recognizing Lamin A/C (Product # MA3-1000), at a dilution of 1:100 for at least 1 hour at room temperature. Cells were then washed with PBS and incubated with DyLight 488 goat-anti-mouse secondary antibody (Product # 35503) at a dilution of 1:400 for 30 minutes at room temperature. Nuclei (blue) were stained with Hoechst 33342 dye (Product # 62249). Images were taken on a Thermo Scientific ArrayScan at 20X magnification.

- Submitted by
- Invitrogen Antibodies (provider)
- Main image
- Experimental details
- Immunofluorescent analysis of Lamin A/C (green) in Human fibroblast cells. Methanol fixed cells were permeabilized with 0.1% Triton X-100 in TBS for 10 minutes at room temperature. Cells were then blocked with 5% normal goat serum (Product # 31873) for 15 minutes at room temperature. Cells were then probed with a mouse monoclonal antibody recognizing Lamin A/C (Product # MA3-1000), at a dilution of 1:200 for at least 1 hour at room temperature. Cells were then washed with PBS and incubated with DyLight 488 goat-anti-mouse secondary antibody at a dilution of 1:400 for 30 minutes at room temperature.

Supportive validation
- Submitted by
- Invitrogen Antibodies (provider)
- Main image

- Experimental details
- NULL

- Submitted by
- Invitrogen Antibodies (provider)
- Main image

- Experimental details
- NULL

- Submitted by
- Invitrogen Antibodies (provider)
- Main image

- Experimental details
- NULL

- Submitted by
- Invitrogen Antibodies (provider)
- Main image

- Experimental details
- NULL

- Submitted by
- Invitrogen Antibodies (provider)
- Main image

- Experimental details
- Fig. 4 MTHFD2 is a short-lived and dynamically regulated protein. a Half-life of enzymes of the one-carbon pathway in in HeLa, C2C12, and NIH3T3 cell lines. b Cumulative frequency of all quantified enzymes (596, 576, and 605 respectively) half-life in three cell lines. Dotted lines indicate relative half-life of MTHFD2 in each cell line. c Effect of treatment of HCT-116 cells for 24 h with 25 mg/ml protein translation inhibitor cyclohexamide on MTHFD2 protein levels. d qRT-PCR measurement of effect of 48 h serum starvation on mRNA of folate one-carbon enzymes. e Immunoblots of MTHFD1, MTHFD1L, MTHFD2, and beta-tubulin in HCT-116 grown in normal media or serum starved for 24 or 48 h. f Immunoblot showing time course of MTHFD2 protein response to serum replenishment in HCT-116 cells. SS, serum-starved; rep, serum replenishment (time point indicated). g Quantification of MTHFD2 mRNA in HCT-116 cells in control media, serum starved (SS) for 48 h, and serum starved followed by 24 h serum replenishment (rep). h Levels of MTHFD2 protein in nuclear and cytosolic compartments in HCT-116 cells that were serum starved for 48 h or in replenished media for 24 h after serum starvation. The COX IV and Lamin were used as cytosolic and nuclear markers respectively. Numbers in f and g indicate fold changes relative to control

- Submitted by
- Invitrogen Antibodies (provider)
- Main image

- Experimental details
- Figure 3. MSC differentiation results in marked nuclear reorganization. ( a ) On day 1, Lamin A/C (LMAC) was spread diffusely throughout the nucleus in both Ctrl and Diff conditions. By day 7, Diff conditions resulted in a restriction of LMAC to the nuclear periphery (scale: 20 um). ( b ) Quantification showed that the nuclear volume occupancy ratio of LMAC (relative to DAPI) did not change in Ctrl conditions, while this ratio decreased significantly in Diff conditions as a function of culture duration (ANOVA, *p

- Submitted by
- Invitrogen Antibodies (provider)
- Main image

- Experimental details
- Figure 9 Status of the nuclear proteins in HGPS cells A. Representative Western blots are shown for lamin A/C, progerin, lamin B1, emerin, SUN1, and beta-actin in total cell extracts that were isolated from control and HGPS cultures. B. Representative Western blots for calnexin, NPC 414, Aurora B, CENP-F, alpha-tubulin and beta-actin are shown. C. Quantifications are shown for lamin A, progerin, lamin C, lamin B1, emerin, SUN1, calnexin, NPC 414, Aurora B, CENP-F and alpha-tubulin levels after normalization to beta-actin as fold-changes relative to the levels of control cells (n=8; * P < 0.05, Student's t-test). Unsynchronized HGPS cells showed increased levels of progerin, SUN1, emerin and calnexin compared to control cells. Lamin B, Aurora B and CENP-F levels were reduced in unsynchronized HGPS cells than in control cells.

- Submitted by
- Invitrogen Antibodies (provider)
- Main image

- Experimental details
- Figure 3 Transplantation of VP64 dCas9 VP64 -Generated Myogenic Progenitors into Immunodeficient Mice Demonstrates In Vivo Regenerative Potential (A) Detection of human-derived fibers in VP64 dCas9 VP64 -treated cells 1 month after intramuscular injection of 5 x 10 5 differentiated iPSCs into NSG mice pre-injured with BaCl 2 . Sections are stained with human-specific dystrophin and lamin A/C antibodies to mark donor-derived fibers and nuclei. Scale bars, 100 mum. (B) Quantification of human dystrophin + fibers in the section with highest number of dystrophin + fibers in each muscle. * p < 0.05 determined by Student's t test compared with control (mean +- SEM, n = 3 mice). (C) Identification of donor-derived satellite cells expressing PAX7 and human-specific lamin A/C, and residing adjacent to the basal lamina as indicated by laminin staining. Scale bars, 25 mum.

- Submitted by
- Invitrogen Antibodies (provider)
- Main image
- Experimental details
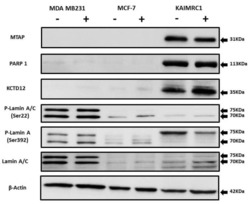
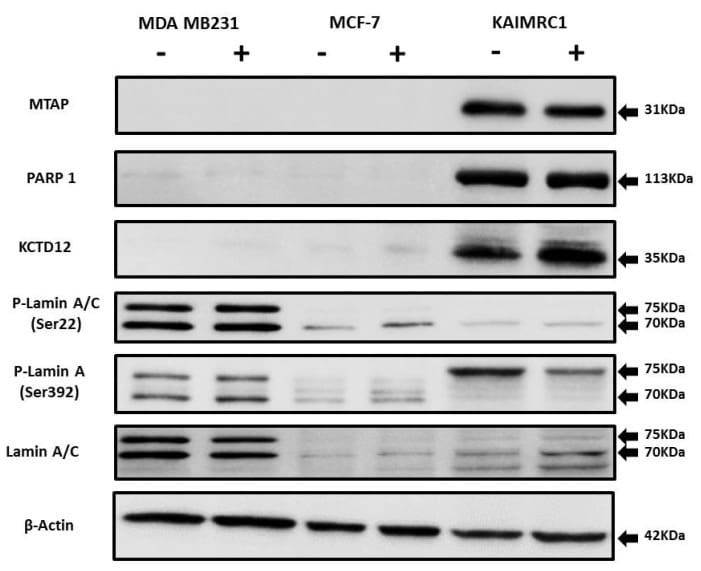
- Figure 5 Expression of MTAP, PARP1, KCTD12, and Lamin A/C in cancer cell lines: Western blot analysis of protein expression of MTAP, PARP1, KCTD12, Lamin A/C, and phosphorylated Lamin A/C in MDA MB231, MCF-7, and KAIMRC1 cells. Preparation of cell lysates and western blot were performed as described under the Materials and Methods section. In both normal (+) and serum-starved (-) conditions, KAIMRC1 cells showed strong expression of MTAP, PARP1, and KCTD12 compared to MDA-MB231 and MCF-7 cells. Moreover, KAIMRC1 cells showed weak expression of Lamin A/C and phosphorylated Lamin A/C in comparison to MDA MB231 cells, thus validating our proteomics results.
- Submitted by
- Invitrogen Antibodies (provider)
- Main image

- Experimental details
- FIGURE 2 Western blotting validation of expression levels of target proteins found to be differentially expressed among H, SA, and A follicles by proteomics. (A) Validation of the proteome quantification. Protein levels of beta catenin, laminA/C, inhibin alpha, HSD17B1, and MIF were detected by Western blotting in granulosa cells from healthy, slightly atretic, and atretic porcine follicles. The histogram shows the quantitative analysis (mean +- SD) of the results of three independent Western blots. The bars are labeled with completely different letters (a, b, c) indicating significant difference, P < 0.05. (B) Immunohistochemical detection of MIF expression in pig healthy, slightly atretic, and atretic porcine follicles. (C) MIF is primarily expressed in granulosa cells of primordial follicles, primary follicles, secondary follicles, and small antrum follicles. (D) MIF is also expressed in cumulus cells. (E) MIF concentrations in follicular fluid from H, SA, and A follicles. (F) MIF mRNA levels in GCs from H, SA, and A follicles. H, healthy follicle; SA, slightly atretic follicle; A, atretic follicle; BM, basement membrane; GC, granulosa cell; TC, theca cell. Scale bar is 100 mum. The data are representative of at least three independent experiments.

- Submitted by
- Invitrogen Antibodies (provider)
- Main image

- Experimental details
- FIGURE 5 The expressions of caspase6, cleaved caspase6, p-laminA/C-S22, laminA/C, and cleaved laminA/C in GCs from healthy (H), slightly atretic (SA), and atretic (A) follicles, as well as the possible regulatory pathways of caspase6, caspase3, laminA/C, and apoptosis. (A) Protein levels of caspase6, cleaved caspase6, p-laminA/C-S22, laminA/C, and cleaved laminA/C in GCs from H, SA, and A follicles were detected by Western blotting. Quantitative analysis of these proteins is shown in histograms. The bars are labeled with completely different letters (a, b, c) indicating significant difference, P < 0.05. (B) The expression of laminA/C and caspase6 in GCs of follicles in different health states was detected by immunofluorescence. Nuclei were stained with Hoechst. Scale bar = 100 mum. TC, theca cell; GC, granulosa cell; BM, basement membrane. (C) Hypothetical model of the regulatory pathways of caspase6, caspase3, and laminA/C in GCs during follicular atresia. (D) Caspase6 S76A increased the ratios of caspase6 cleavage compared with the wild-type caspase6 and caspase6 S76D, after transfection and apoptosis induction. 293T cells were transfected with caspase6, caspase6 S76A, and caspase6 S76D plasmids for 16 h; the CN and p-EGFP-N1 are transfection control. Then, the cells were treated with 30 mug/mL CHX and 50 ng/mL TNFalpha for 12 h. The cell was harvested for Western blotting analysis. The ratios of cleaved caspase6/caspase6 and cleaved caspase3/caspase3 in the pig caspase6 (P

- Submitted by
- Invitrogen Antibodies (provider)
- Main image

- Experimental details
- Figure 2 The L535Q KASH5 localizes to the mitochondria. U2OS cells grown on coverslips were transfected with an N-terminal GFP-tagged version of wild-type or L535Q KASH5. The subcellular localization was determined by immunostaining with organelle-specific protein markers. ( A ) Nuclear localization was assessed using an anti-lamin A/C antibody (red). ( B ) Mitochondria localization was assessed with an anti-TOM20 antibody (red). ( C ) Peroxisome localization was assessed with an anti-PEX14 antibody (red). ( D ) Pearson''s correlation coefficient between GFP-KASH5 and organelle markers. KASH5 vs Lamin A/C: N = 24, KASH5 vs TOM20: N = 35 and KASH5 vs Pex14: N = 72. The values indicate - 1: opposing, 0: no and 1 complete colocalization. Scale bar 10 mum. ****P < 0.0001; ***P < 0.0002. The experiment was repeated seven times.

- Submitted by
- Invitrogen Antibodies (provider)
- Main image

- Experimental details
- Figure 4 Interference with endogenous HMGB1 inhibits NF-kappaB signaling activity in chemotherapy-resistant multiple myeloma cells. Chemotherapy-sensitive cells, RPMI8226, and three chemotherapy-resistant cells, RPMI8226/ADR, RPMI8226/BOR and RPMI8226/DEX cells, were transfected with HMGB1 shRNA or control shRNA. (A) The relative mRNA expression of TLR4 and NF-kappaB mRNA were detected by reverse transcription-quantitative PCR. (B) The protein expression of TLR4, p-IKKalpha/beta, total IKKalpha/beta, p-IkappaBalpha, total IkappaBalpha, p-p65 and total p65 in whole cell lysate of RPMI8226, RPMI8226/ADR, RPMI8226/BOR and RPMI8226/DEX cells were detected by western blotting. beta-actin was used as a loading control. (C) The protein expression of p-p65 and total p-65 in the nucleus of RPMI8226, RPMI8226/ADR, RPMI8226/BOR and RPMI8226/DEX cells were detected by western blotting and quantified. Lamin-A was used as a loading control. Data are presented as mean +- SD from three independent experiments. * P

- Submitted by
- Invitrogen Antibodies (provider)
- Main image

- Experimental details
- Characterization of the lamin A/C and lamin B1 levels in U-2 OS, SaOS-2 and MG-63 cells (A) and prediction of the post-translational modifications of DNMT2/TRDMT1 (B, C). (A) Changes in the levels of lamin A/C (left) and lamin B1 (right). Lamin A/C and lamin B1 signals were analyzed using immunofluorescence and imaging flow cytometry. Representative histograms are shown (top). The blue histograms indicate lamin A/C and lamin B1 levels in U-2 OS, green histograms indicate lamin A/C and lamin B1 levels in SaOS-2 cells, while red histograms indicate lamin A/C and lamin B1 levels in MG-63 cells. Representative microphotographs are also shown (bottom). BF- bright field, SSC- side scatter. (B) Protein plot generated by the Scansite program showing the full length of DNMT2/TRDMT1 protein and the predicted phosphorylation sites. (C) Table generated by Scansite program showing predicted site and sequence of DNMT2/TRDMT1 protein likely to be phosphorylated, possible factors causing post-translational modification and colocalization of the DNMT2/TRDMT1 with possible modifiers.

- Submitted by
- Invitrogen Antibodies (provider)
- Main image

- Experimental details
- Figure 3. Trp depletion upregulates WARS expression. (A) WARS mRNA expression measured by qRT-PCR in A172 glioblastoma cells, which exhibit constitutive TDO2 activity, cultured for 120 h in normal DMEM or with additional supplementation of 78 uM Trp after 72 h. (B) WARS2 mRNA expression measured by qRT-PCR in A172 glioblastoma cells under the conditions described in (A). (C) WARS mRNA expression measured by qRT-PCR in glioblastoma (A172, LN18, LN229) and ovarian carcinoma cells (SKOV-3) after 24 h of cultivation in medium containing 78 uM versus no Trp. (D) WARS protein levels in LN229 glioblastoma cells detected by Western blot after 48 h or 72 h of cultivation in medium containing 78 uM or no Trp. GAPDH served as loading control (E) WARS2 mRNA expression measured by qRT-PCR was not altered by the conditions described in (C). (F) WARS protein levels in the cytoplasmic or nuclear fraction of LN229 glioblastoma cells detected by Western blot after 48 h of cultivation in medium containing 78 uM or no Trp. GAPDH served as loading control for the cytoplasmic fraction, lamin A/C as loading control for the nuclear fraction. (G) WARS protein concentrations measured by ELISA in the supernatants of LN229 and A172 glioblastoma cells cultured for 48 h in the presence or absence of Trp. All data are expressed as mean +- s.e.m. Statistical significance is assumed at P < 0.05 (* P < 0.05, ** P < 0.01, *** P

- Submitted by
- Invitrogen Antibodies (provider)
- Main image

- Experimental details
- Figure 2 Engraftment of Skeletal hMuStem Cells in the Heart of Immunodeficient Rats (A) Schematic representation of the experimental design. (B) Frozen cross-sections of recipient heart were colabeled with specific human lamin A/C Ab and wheat germ agglutinin (WGA). hMuStem cells were predominantly located in the dense connective tissue. Nuclei were counterstained using DRAQ5 (dark blue). Scale bars, 100 mum (B); 10 mum (B, insets). (C) Representative hematoxylin-eosin-saffron (HES)- and Picrosirius-stained cross-sections of the cardiac injection zone. Scale bars, 1 mm (C); and 250 mum (C, inset). (D) Representative lead II ECG traces and 2-dimensional (2D) echocardiography and pulsed Doppler images of rats injected with hMuStem cells before (baseline) and 4 weeks after thread passage. Scale bar, 100 ms. M-mode, time-movement mode; LVEDD, left-ventricular end-diastolic diameter; E/A ratio, early-diastolic (E)/late-diastolic (A) ratio; DT, deceleration time; IVRT, isovolumetric relaxation time.
