Explore
 Validate
 Learn
Learn Western blot
 Flow cytometry
Antibody data
- Antibody Data
- Antigen structure
- References [19]
- Comments [0]
- Validations
- Flow cytometry [1]
- Other assay [27]
Submit
Validation data
Reference
Comment
Report error
- Product number
- 14-5963-82 - Provider product page

- Provider
- Invitrogen Antibodies
- Product name
- Blimp-1 Monoclonal Antibody (6D3), eBioscience™
- Antibody type
- Monoclonal
- Antigen
- Other
- Description
- Description: This 6D3 monoclonal antibody reacts with B lymphocyte-induced maturation protein-1 (Blimp-1), a transcriptional repressor expressed in B and T cells. This approximately 90-kDa protein contains five consecutive Kruppel-like zinc finger domains by which it binds DNA. In B cells, Blimp-1 promotes terminal differentiation into antibody-secreting plasma cells during a primary immune response. In addition, Blimp-1 has been implicated in germinal center formation in response to T-dependent and T-independent antigens, as well as in some diffuse large B cell lymphomas. Expressed in CD4+ and CD8+ effector/memory T cells and FoxP3+ regulatory T cells, reports have suggested possible roles for Blimp-1 in T cell homeostasis and suppression of IL-2 production. Moreover, by suppressing Th1 differentiation, Blimp-1 plays a role in T helper cell differentiation. Finally, Blimp-1 has been demonstrated to play a significant role in the terminal differentiation of effector and effector memory CD8+ T cells during viral infection. Applications Reported: This 6D3 antibody has been reported for use in immunoblotting (WB) and immunohistology staining of paraffin-embedded tissue sections. Applications Tested: This 6D3 antibody has been tested by western blot of reduced A20 cell lysates. For western blottiing, this antibody can be used at 1-10 µg/mL. Moreover, this antibody was tested by immunohistochemistry of formalin-fixed paraffin embedded human tonsil tissue. Antigen retrieval was performed using 10mM citrate buffer at pH 6.0. For immunohistochemistry, this antibody can be used at 10 µg/mL. It is recommended that the antibody be carefully titrated for optimal performance in the assay of interest. Purity: Greater than 90%, as determined by SDS-PAGE. Aggregation: Less than 10%, as determined by HPLC. Filtration: 0.2 µm post-manufacturing filtered.
- Reactivity
- Human, Mouse
- Host
- Rat
- Isotype
- IgG
- Antibody clone number
- 6D3
- Vial size
- 100 µg
- Concentration
- 0.5 mg/mL
- Storage
- 4° C
Submitted references Murine myeloid cell MCPIP1 suppresses autoimmunity by regulating B-cell expansion and differentiation.
Single-cell Transcriptome Profiling reveals Dermal and Epithelial cell fate decisions during Embryonic Hair Follicle Development.
Contribution of GATA6 to homeostasis of the human upper pilosebaceous unit and acne pathogenesis.
MEF2D sustains activation of effector Foxp3+ Tregs during transplant survival and anticancer immunity.
Efficient generation of human primordial germ cell-like cells from pluripotent stem cells in a methylcellulose-based 3D system at large scale.
Principles of early human development and germ cell program from conserved model systems.
The aryl hydrocarbon receptor controls cell-fate decisions in B cells.
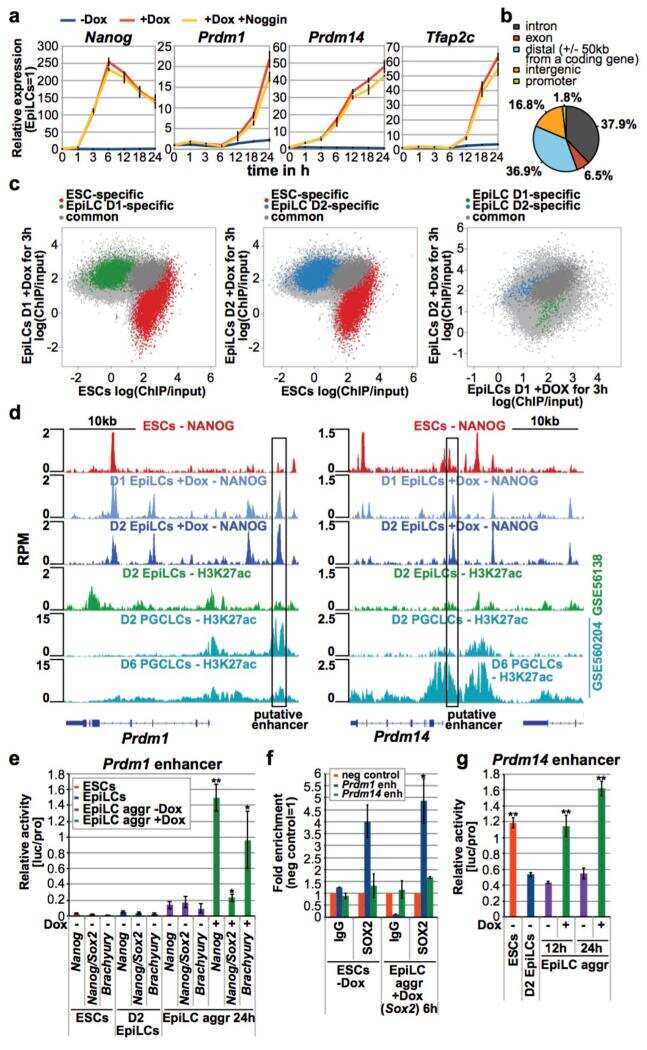
NANOG alone induces germ cells in primed epiblast in vitro by activation of enhancers.
Blimp1/Prdm1 Functions in Opposition to Irf1 to Maintain Neonatal Tolerance during Postnatal Intestinal Maturation.
SOX17 is a critical specifier of human primordial germ cell fate.
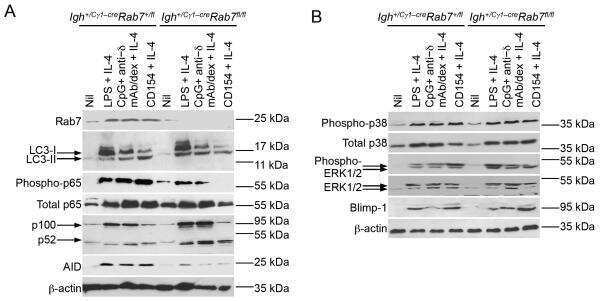
B cell Rab7 mediates induction of activation-induced cytidine deaminase expression and class-switching in T-dependent and T-independent antibody responses.
BLIMP1 is required for postnatal epidermal homeostasis but does not define a sebaceous gland progenitor under steady-state conditions.
Transcription elongation factor ELL2 drives Ig secretory-specific mRNA production and the unfolded protein response.
Histone deacetylase inhibitors upregulate B cell microRNAs that silence AID and Blimp-1 expression for epigenetic modulation of antibody and autoantibody responses.
A genome-wide regulatory network identifies key transcription factors for memory CD8⁺ T-cell development.
Sox2 modulates the function of two distinct cell lineages in mouse skin.
Prdm14 promotes germline fate and naive pluripotency by repressing FGF signalling and DNA methylation.
Distinct fibroblast lineages determine dermal architecture in skin development and repair.
Blimp-1 transcription factor is required for the differentiation of effector CD8(+) T cells and memory responses.
Dobosz E, Lorenz G, Ribeiro A, Würf V, Wadowska M, Kotlinowski J, Schmaderer C, Potempa J, Fu M, Koziel J, Lech M
Disease models & mechanisms 2021 Mar 18;14(3)
Disease models & mechanisms 2021 Mar 18;14(3)
Single-cell Transcriptome Profiling reveals Dermal and Epithelial cell fate decisions during Embryonic Hair Follicle Development.
Ge W, Tan SJ, Wang SH, Li L, Sun XF, Shen W, Wang X
Theranostics 2020;10(17):7581-7598
Theranostics 2020;10(17):7581-7598
Contribution of GATA6 to homeostasis of the human upper pilosebaceous unit and acne pathogenesis.
Oulès B, Philippeos C, Segal J, Tihy M, Vietri Rudan M, Cujba AM, Grange PA, Quist S, Natsuga K, Deschamps L, Dupin N, Donati G, Watt FM
Nature communications 2020 Oct 20;11(1):5067
Nature communications 2020 Oct 20;11(1):5067
MEF2D sustains activation of effector Foxp3+ Tregs during transplant survival and anticancer immunity.
Di Giorgio E, Wang L, Xiong Y, Akimova T, Christensen LM, Han R, Samanta A, Trevisanut M, Bhatti TR, Beier UH, Hancock WW
The Journal of clinical investigation 2020 Dec 1;130(12):6242-6260
The Journal of clinical investigation 2020 Dec 1;130(12):6242-6260
Efficient generation of human primordial germ cell-like cells from pluripotent stem cells in a methylcellulose-based 3D system at large scale.
Wang X, Liao T, Wan C, Yang X, Zhao J, Fu R, Yao Z, Huang Y, Shi Y, Chang G, Zheng Y, Luo F, Liu Z, Wang Y, Mao X, Zhao XY
PeerJ 2019;6:e6143
PeerJ 2019;6:e6143
Principles of early human development and germ cell program from conserved model systems.
Kobayashi T, Zhang H, Tang WWC, Irie N, Withey S, Klisch D, Sybirna A, Dietmann S, Contreras DA, Webb R, Allegrucci C, Alberio R, Surani MA
Nature 2017 Jun 15;546(7658):416-420
Nature 2017 Jun 15;546(7658):416-420
The aryl hydrocarbon receptor controls cell-fate decisions in B cells.
Vaidyanathan B, Chaudhry A, Yewdell WT, Angeletti D, Yen WF, Wheatley AK, Bradfield CA, McDermott AB, Yewdell JW, Rudensky AY, Chaudhuri J
The Journal of experimental medicine 2017 Jan;214(1):197-208
The Journal of experimental medicine 2017 Jan;214(1):197-208
NANOG alone induces germ cells in primed epiblast in vitro by activation of enhancers.
Murakami K, Günesdogan U, Zylicz JJ, Tang WWC, Sengupta R, Kobayashi T, Kim S, Butler R, Dietmann S, Surani MA
Nature 2016 Jan 21;529(7586):403-407
Nature 2016 Jan 21;529(7586):403-407
Blimp1/Prdm1 Functions in Opposition to Irf1 to Maintain Neonatal Tolerance during Postnatal Intestinal Maturation.
Mould AW, Morgan MA, Nelson AC, Bikoff EK, Robertson EJ
PLoS genetics 2015 Jul;11(7):e1005375
PLoS genetics 2015 Jul;11(7):e1005375
SOX17 is a critical specifier of human primordial germ cell fate.
Irie N, Weinberger L, Tang WW, Kobayashi T, Viukov S, Manor YS, Dietmann S, Hanna JH, Surani MA
Cell 2015 Jan 15;160(1-2):253-68
Cell 2015 Jan 15;160(1-2):253-68
B cell Rab7 mediates induction of activation-induced cytidine deaminase expression and class-switching in T-dependent and T-independent antibody responses.
Pone EJ, Lam T, Lou Z, Wang R, Chen Y, Liu D, Edinger AL, Xu Z, Casali P
Journal of immunology (Baltimore, Md. : 1950) 2015 Apr 1;194(7):3065-78
Journal of immunology (Baltimore, Md. : 1950) 2015 Apr 1;194(7):3065-78
BLIMP1 is required for postnatal epidermal homeostasis but does not define a sebaceous gland progenitor under steady-state conditions.
Kretzschmar K, Cottle DL, Donati G, Chiang MF, Quist SR, Gollnick HP, Natsuga K, Lin KI, Watt FM
Stem cell reports 2014 Oct 14;3(4):620-33
Stem cell reports 2014 Oct 14;3(4):620-33
Transcription elongation factor ELL2 drives Ig secretory-specific mRNA production and the unfolded protein response.
Park KS, Bayles I, Szlachta-McGinn A, Paul J, Boiko J, Santos P, Liu J, Wang Z, Borghesi L, Milcarek C
Journal of immunology (Baltimore, Md. : 1950) 2014 Nov 1;193(9):4663-74
Journal of immunology (Baltimore, Md. : 1950) 2014 Nov 1;193(9):4663-74
Histone deacetylase inhibitors upregulate B cell microRNAs that silence AID and Blimp-1 expression for epigenetic modulation of antibody and autoantibody responses.
White CA, Pone EJ, Lam T, Tat C, Hayama KL, Li G, Zan H, Casali P
Journal of immunology (Baltimore, Md. : 1950) 2014 Dec 15;193(12):5933-50
Journal of immunology (Baltimore, Md. : 1950) 2014 Dec 15;193(12):5933-50
A genome-wide regulatory network identifies key transcription factors for memory CD8⁺ T-cell development.
Hu G, Chen J
Nature communications 2013;4:2830
Nature communications 2013;4:2830
Sox2 modulates the function of two distinct cell lineages in mouse skin.
Lesko MH, Driskell RR, Kretzschmar K, Goldie SJ, Watt FM
Developmental biology 2013 Oct 1;382(1):15-26
Developmental biology 2013 Oct 1;382(1):15-26
Prdm14 promotes germline fate and naive pluripotency by repressing FGF signalling and DNA methylation.
Grabole N, Tischler J, Hackett JA, Kim S, Tang F, Leitch HG, Magnúsdóttir E, Surani MA
EMBO reports 2013 Jul;14(7):629-37
EMBO reports 2013 Jul;14(7):629-37
Distinct fibroblast lineages determine dermal architecture in skin development and repair.
Driskell RR, Lichtenberger BM, Hoste E, Kretzschmar K, Simons BD, Charalambous M, Ferron SR, Herault Y, Pavlovic G, Ferguson-Smith AC, Watt FM
Nature 2013 Dec 12;504(7479):277-281
Nature 2013 Dec 12;504(7479):277-281
Blimp-1 transcription factor is required for the differentiation of effector CD8(+) T cells and memory responses.
Kallies A, Xin A, Belz GT, Nutt SL
Immunity 2009 Aug 21;31(2):283-95
Immunity 2009 Aug 21;31(2):283-95
No comments: Submit comment
Supportive validation
- Submitted by
- Invitrogen Antibodies (provider)
- Main image
- Experimental details
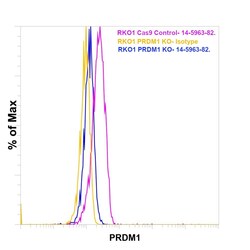
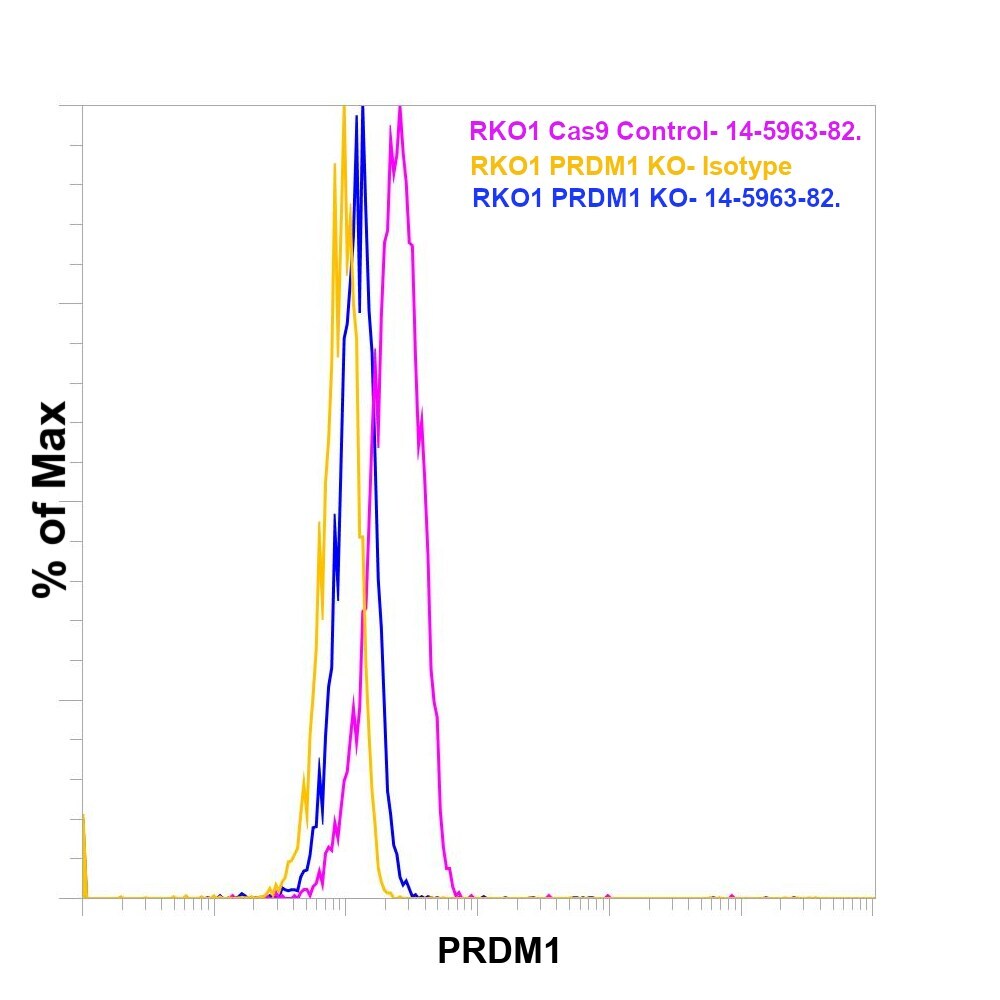
- Knockout of Blimp-1 was achieved by CRISPR-Cas9 genome editing using LentiArray™ Lentiviral sgRNA (Product # A32042, Assay ID CRISPR 965410_LV) and LentiArray Cas9 Lentivirus (Product # A32064). For Flow cytometry analysis, RKO Blimp-1 Knock out cells were stained intracellularly using the Foxp3 / Transcription Factor Staining Buffer Set Buffer Set (Product # 00-5523-00) and protocol, with 5 µg/mL Goat anti-rat IgG2a Secondary Antibody (Product # PA1-84755, yellow histogram) or 5 µg/mL Blimp-1 Monoclonal Antibody (6D3), eBioscience&trade (Product # 14-5963-82, blue histogram) followed by (Product # , 1:1000). RKO Cas9 control cells were also stained similarly with 0.5 mg/mL Blimp-1 Monoclonal Antibody (E.995.1) (Product # 14-5963-82, pink histogram) followed by the secondary antibody. Lossof signal was observed in the Blimp-1 KOcells stained with Blimp-1 antibody clone (E.995.1) but not in the control Cas9cells. Viable cells were used for analysis, as determined by Fixable Viability Dye eFluor™ 780 (Product # 65-0865-18).
Supportive validation
- Submitted by
- Invitrogen Antibodies (provider)
- Main image
- Experimental details
- NULL
- Submitted by
- Invitrogen Antibodies (provider)
- Main image
- Experimental details
- NULL
- Submitted by
- Invitrogen Antibodies (provider)
- Main image
- Experimental details
- NULL
- Submitted by
- Invitrogen Antibodies (provider)
- Main image
- Experimental details
- NULL
- Submitted by
- Invitrogen Antibodies (provider)
- Main image
- Experimental details
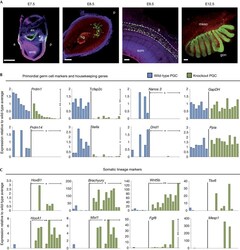
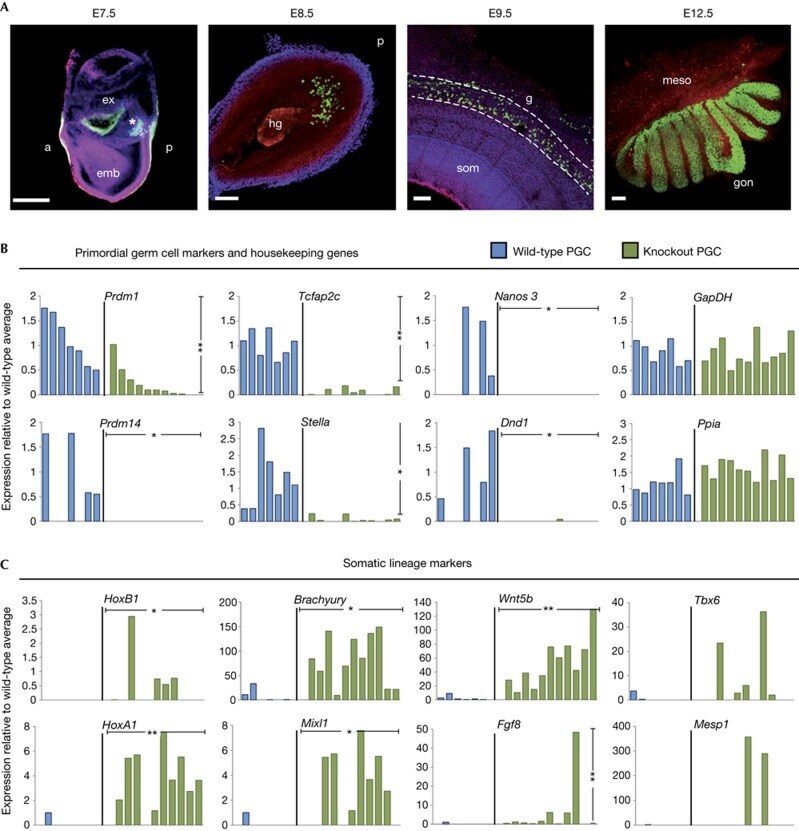
- Figure 1 Loss of germline-specific expression and gain of somatic fate markers in Prdm14 mutant PGCs. ( A ) Stages of wild-type PGC development (PGCs marked by GFP in green). The founder population of PGCs forms a cluster (E7.5; Prdm1 -GFP, marked by asterisk), enters the hindgut region (E8.5; Stella -GFP), migrates through the gut (E9.5; Oct4 -DeltaPE-GFP) and enters into the gonads (E12.5; Oct4 -DeltaPE-GFP) to continue their development into gametes. (scale bars=100 mum). ( B , C ) Gene expression levels relative to wild-type average, which is set to 1 (where expression was absent in all wild-type samples, expression levels are relative to knockout average) of individual wild-type (blue) or knockout (green) PGCs. Single cells were ordered according to levels of Prdm1 expression, with values normalized with Arbp . Transcript levels are shown for PGC genes and two housekeeping genes ( Gapdh and Ppia ; B ) and somatic lineage markers ( C ). Welch's t -test was used to calculate statistical significances of differences in expression levels (vertical bars) between wild-type and mutant PGCs. The chi 2 test was used to determine statistical significances for expression frequency differences (horizontal bars). (* P
- Submitted by
- Invitrogen Antibodies (provider)
- Main image
- Experimental details
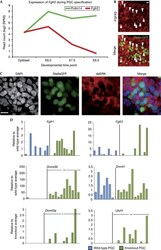
- Figure 2 Prdm14 -deficient PGCs fail to repress Fgfr2 and DNA methyltransferases. ( A ) Average changes in transcript levels of Prdm14 and Fgfr2 over the course of PGC specification determined by single-cell RNA sequencing of two wild-type cells. ( B ) Whole-mount immunostaining for FGFR2 (red) and PGCs, marked by a Stella GFP reporter (green, arrowheads) in an E8.5 wild-type embryo (scale bar=15 mum). ( C ) Whole-mount immunostaining for PGCs, marked by Stella GFP (green), and phosphorylated ERK (red) in wild-type embryos at E8.75 (scale bar=15 mum). ( D ) Expression of FGF receptors or genes involved in the regulation of DNA methylation in single wild-type (blue) or knockout (green) PGCs. Expression was normalized with Arbp and is shown relative to the average wild-type level, which was set to 1 (where expression was absent in all wild-type samples, expression levels are relative to knockout average). Statistical significances by chi 2 test. (* P
- Submitted by
- Invitrogen Antibodies (provider)
- Main image
- Experimental details
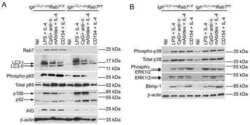
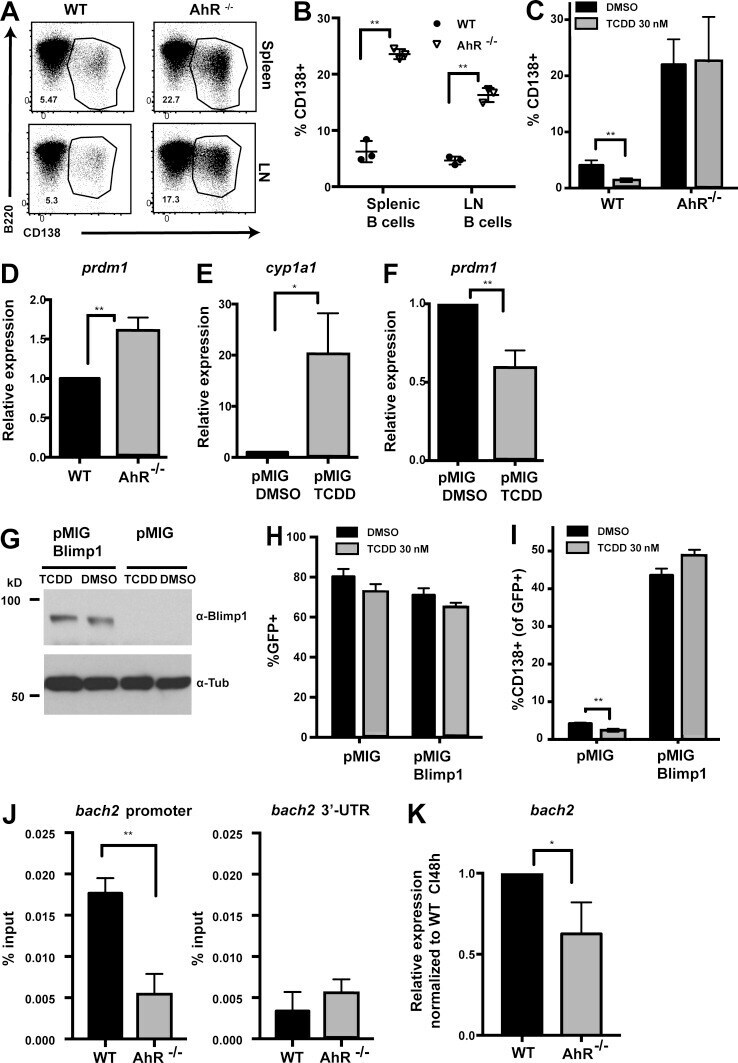
- Figure 3. AhR antagonizes PCD ex vivo via Blimp-1 repression. (A) Representative flow cytometry plot of WT and AhR -/- splenic (top) and LN (bottom) B cells stimulated with anti-CD40 + IL-4 (CI) for 96 h, showing CD138 + plasma cells. (B) Quantification summary of percent CD138 + splenic and LN B cells from WT and AhR -/- mice. A representative of three experiments with three mice per group is shown. (C) Percentage of CD138 + cells at 96 h after CI stimulation of WT and AhR -/- B cells treated with DMSO or TCDD. (D) Relative mRNA expression of prdm1 (normalized to beta actin) at 48 h CI stimulation between WT and AhR -/- splenic B cells. (E) Relative cyp1a1 mRNA levels (normalized to beta actin) as a measure of AhR activation in 48-h CI-treated WT B cells infected with pMIG in the presence of DMSO or TCDD. (F) Relative mRNA expression of prdm1 (normalized to beta actin) in CI-stimulated WT B cells infected with pMIG (48 h) in the presence of DMSO or TCDD. (G) Western blot showing Blimp-1 and tubulin (Tub; loading control) expression in CI-stimulated WT B cells infected with empty vector (pMIG) or pMIG-Blimp-1 for 48 h in the presence of DMSO or TCDD. Endogenous Blimp-1 was not detectable using the Blimp-1 antibody. A representative of two experiments is shown. (H) Percent GFP + in pMIG- or pMIG-Blimp-1-infected (96 h after infection) WT B cells stimulated with CI in the presence of DMSO or TCDD. (I) Percent CD138 + cells at 96 h after infection with empty vector or pMIG-Blimp
- Submitted by
- Invitrogen Antibodies (provider)
- Main image
- Experimental details
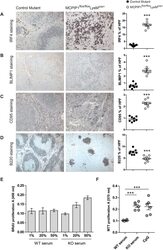
- Fig. 4. Macrophage-derived MCPIP1 regulates B-lymphocyte expansion in lymphoid organs. (A-D) Spleen sections were stained with anti-mouse IRF4, BLIMP1, CD95 and B220 antibodies and quantified by Adobe Photoshop software as percentage of positively stained high-power field (HPF) from eight mice per group; *** P
- Submitted by
- Invitrogen Antibodies (provider)
- Main image
- Experimental details
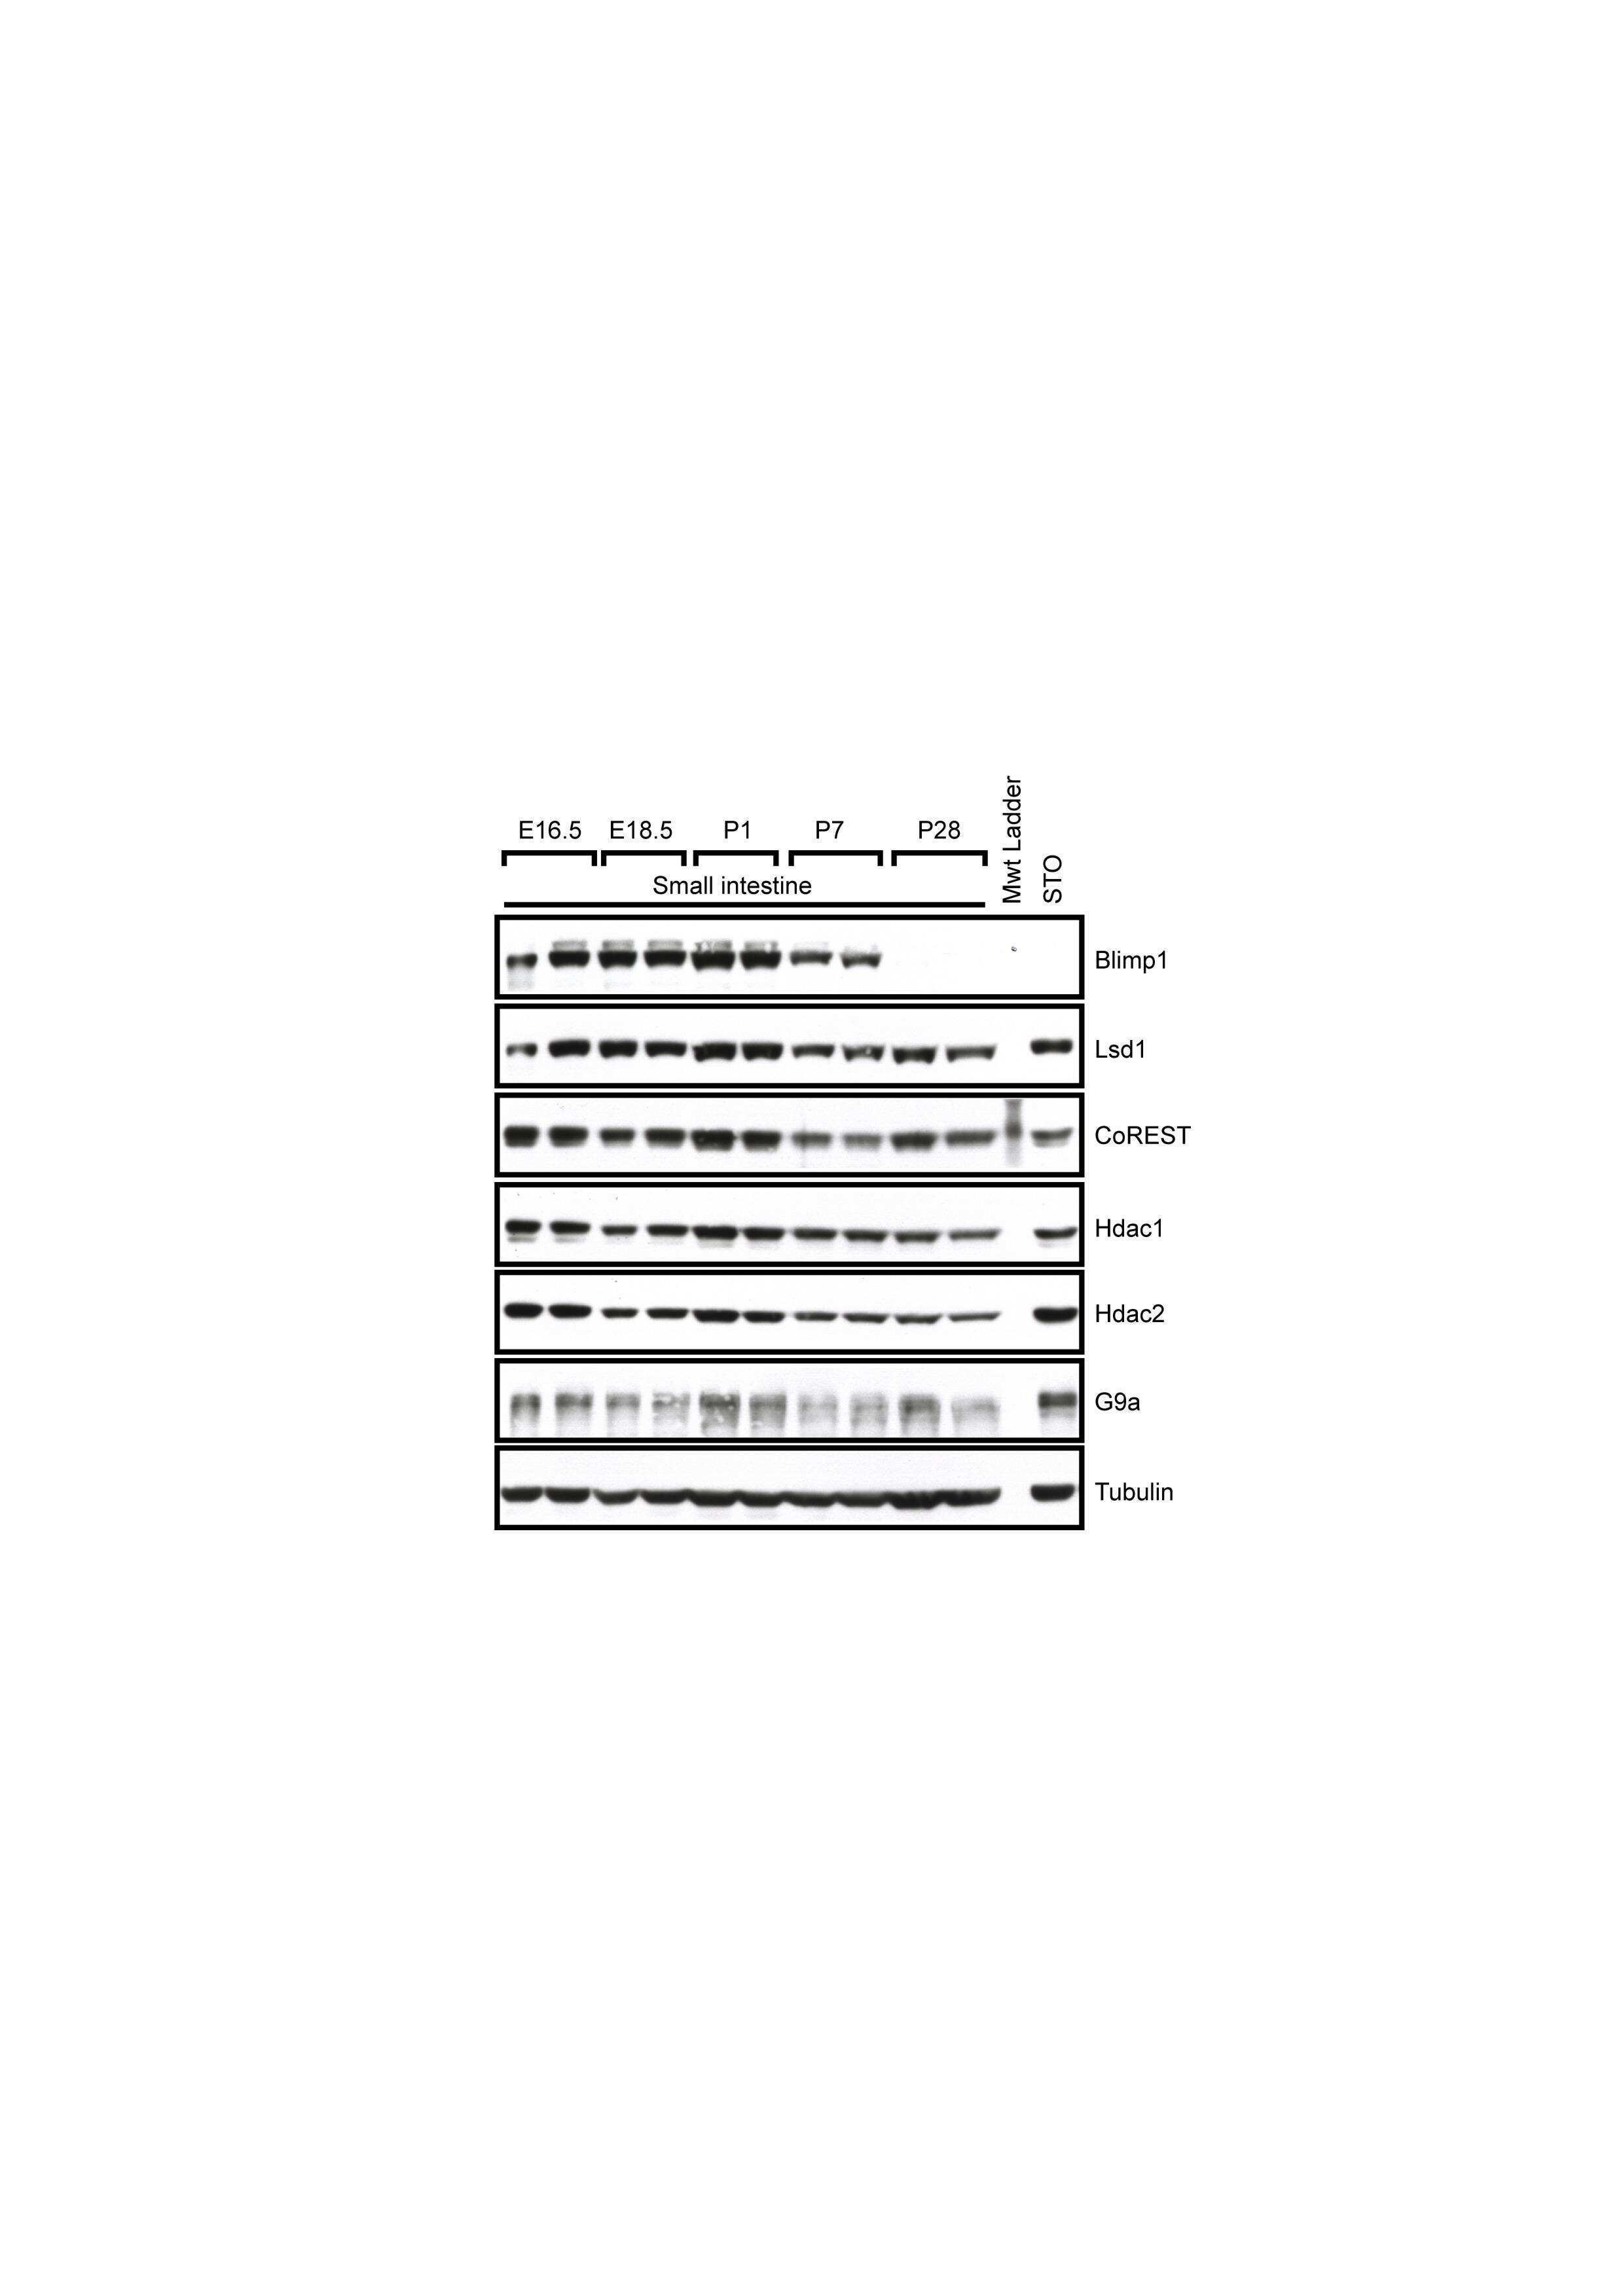
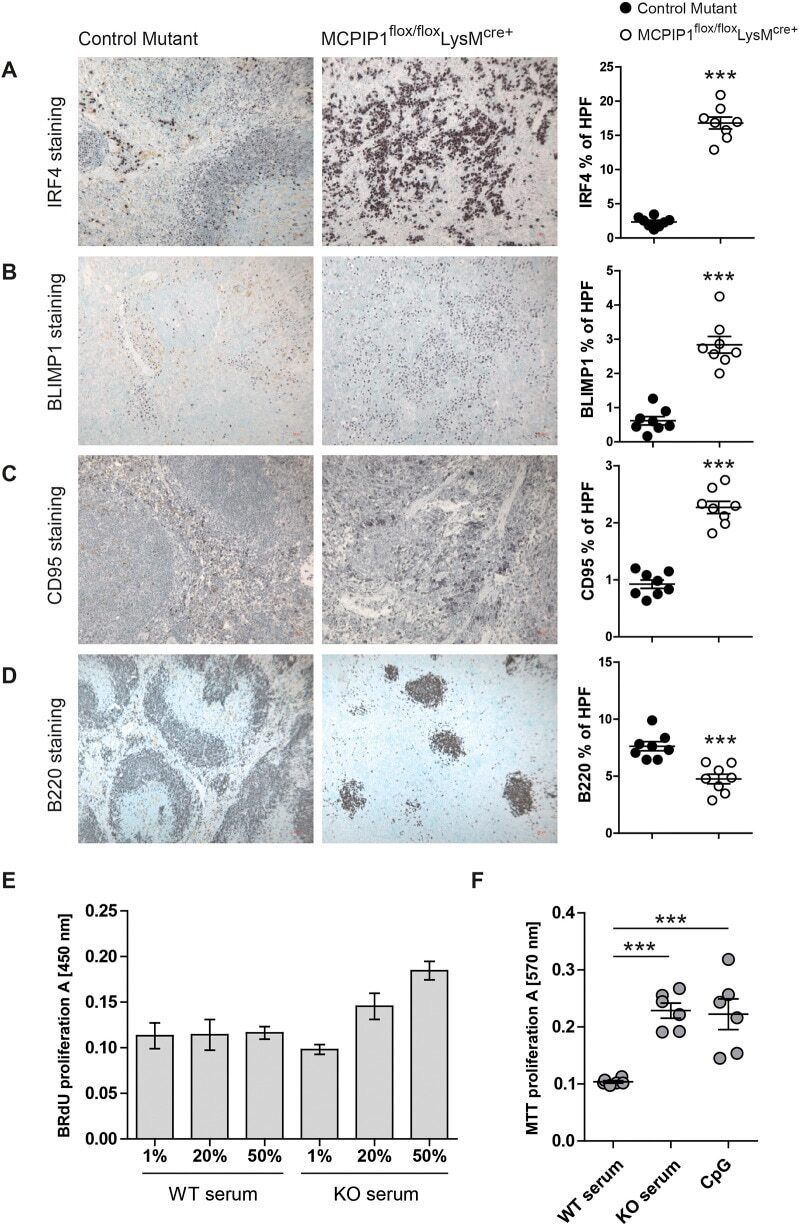
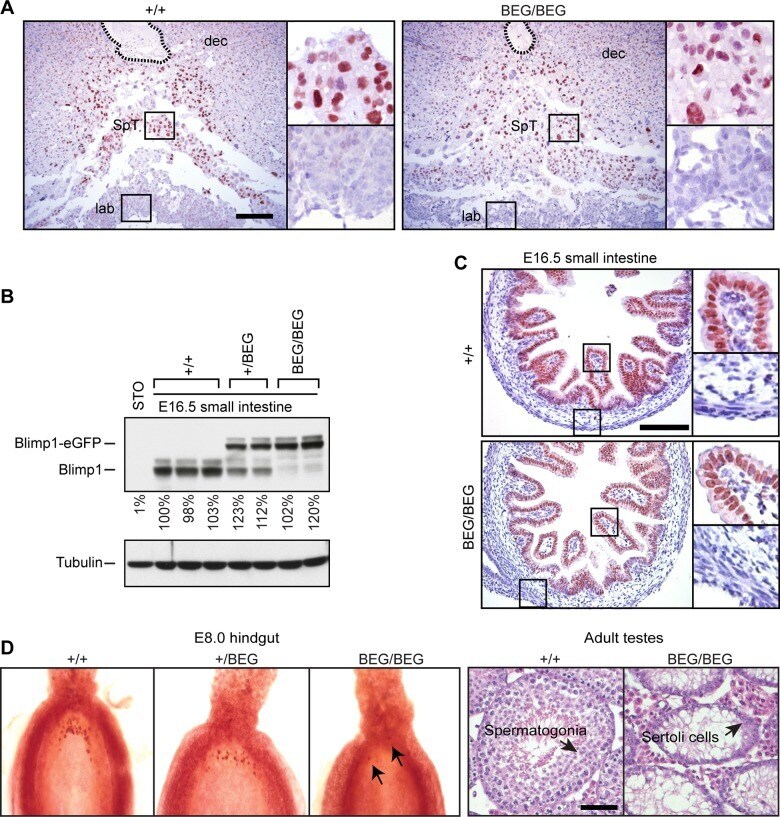
- Fig 2 The eGFP-tagged Blimp1-fusion protein is efficiently expressed in the developing placenta and embryonic small intestine, but fails to rescue germ cell defects. (A) Immunohistochemical staining of E9.5 placentae demonstrates the eGFP-tagged Blimp1-fusion protein is correctly expressed in the spongiotrophoblast layer. The position of the central maternal artery is outlined. Bar, 200 mum. SpT, spongiotrophoblast; dec, maternal decidua; lab, labyrinth trophoblast. (B) Western blot analysis demonstrates robust expression in E16.5 small intestine. RIPA lysates of STO fibroblasts are included as a negative control. Levels of Blimp1 expression were quantified relative to the first wild type littermate. (C) Immunohistochemical staining demonstrates nuclear expression of both endogenous and eGFP-tagged Blimp1 protein in E16.5 villus epithelium. Bar, 200 mum. (D) The eGFP-tagged Blimp1 knock-in allele fails to reconstitute germ cell formation. Fast red alkaline phosphatase staining at E7.5 demonstrates markedly reduced numbers of PGCs (black arrows). Hematoxylin- and eosin-stained sections confirm that adult homozygous BEG/BEG testes lack spermatocytes. Bar, 200 mum.
- Submitted by
- Invitrogen Antibodies (provider)
- Main image

- Experimental details
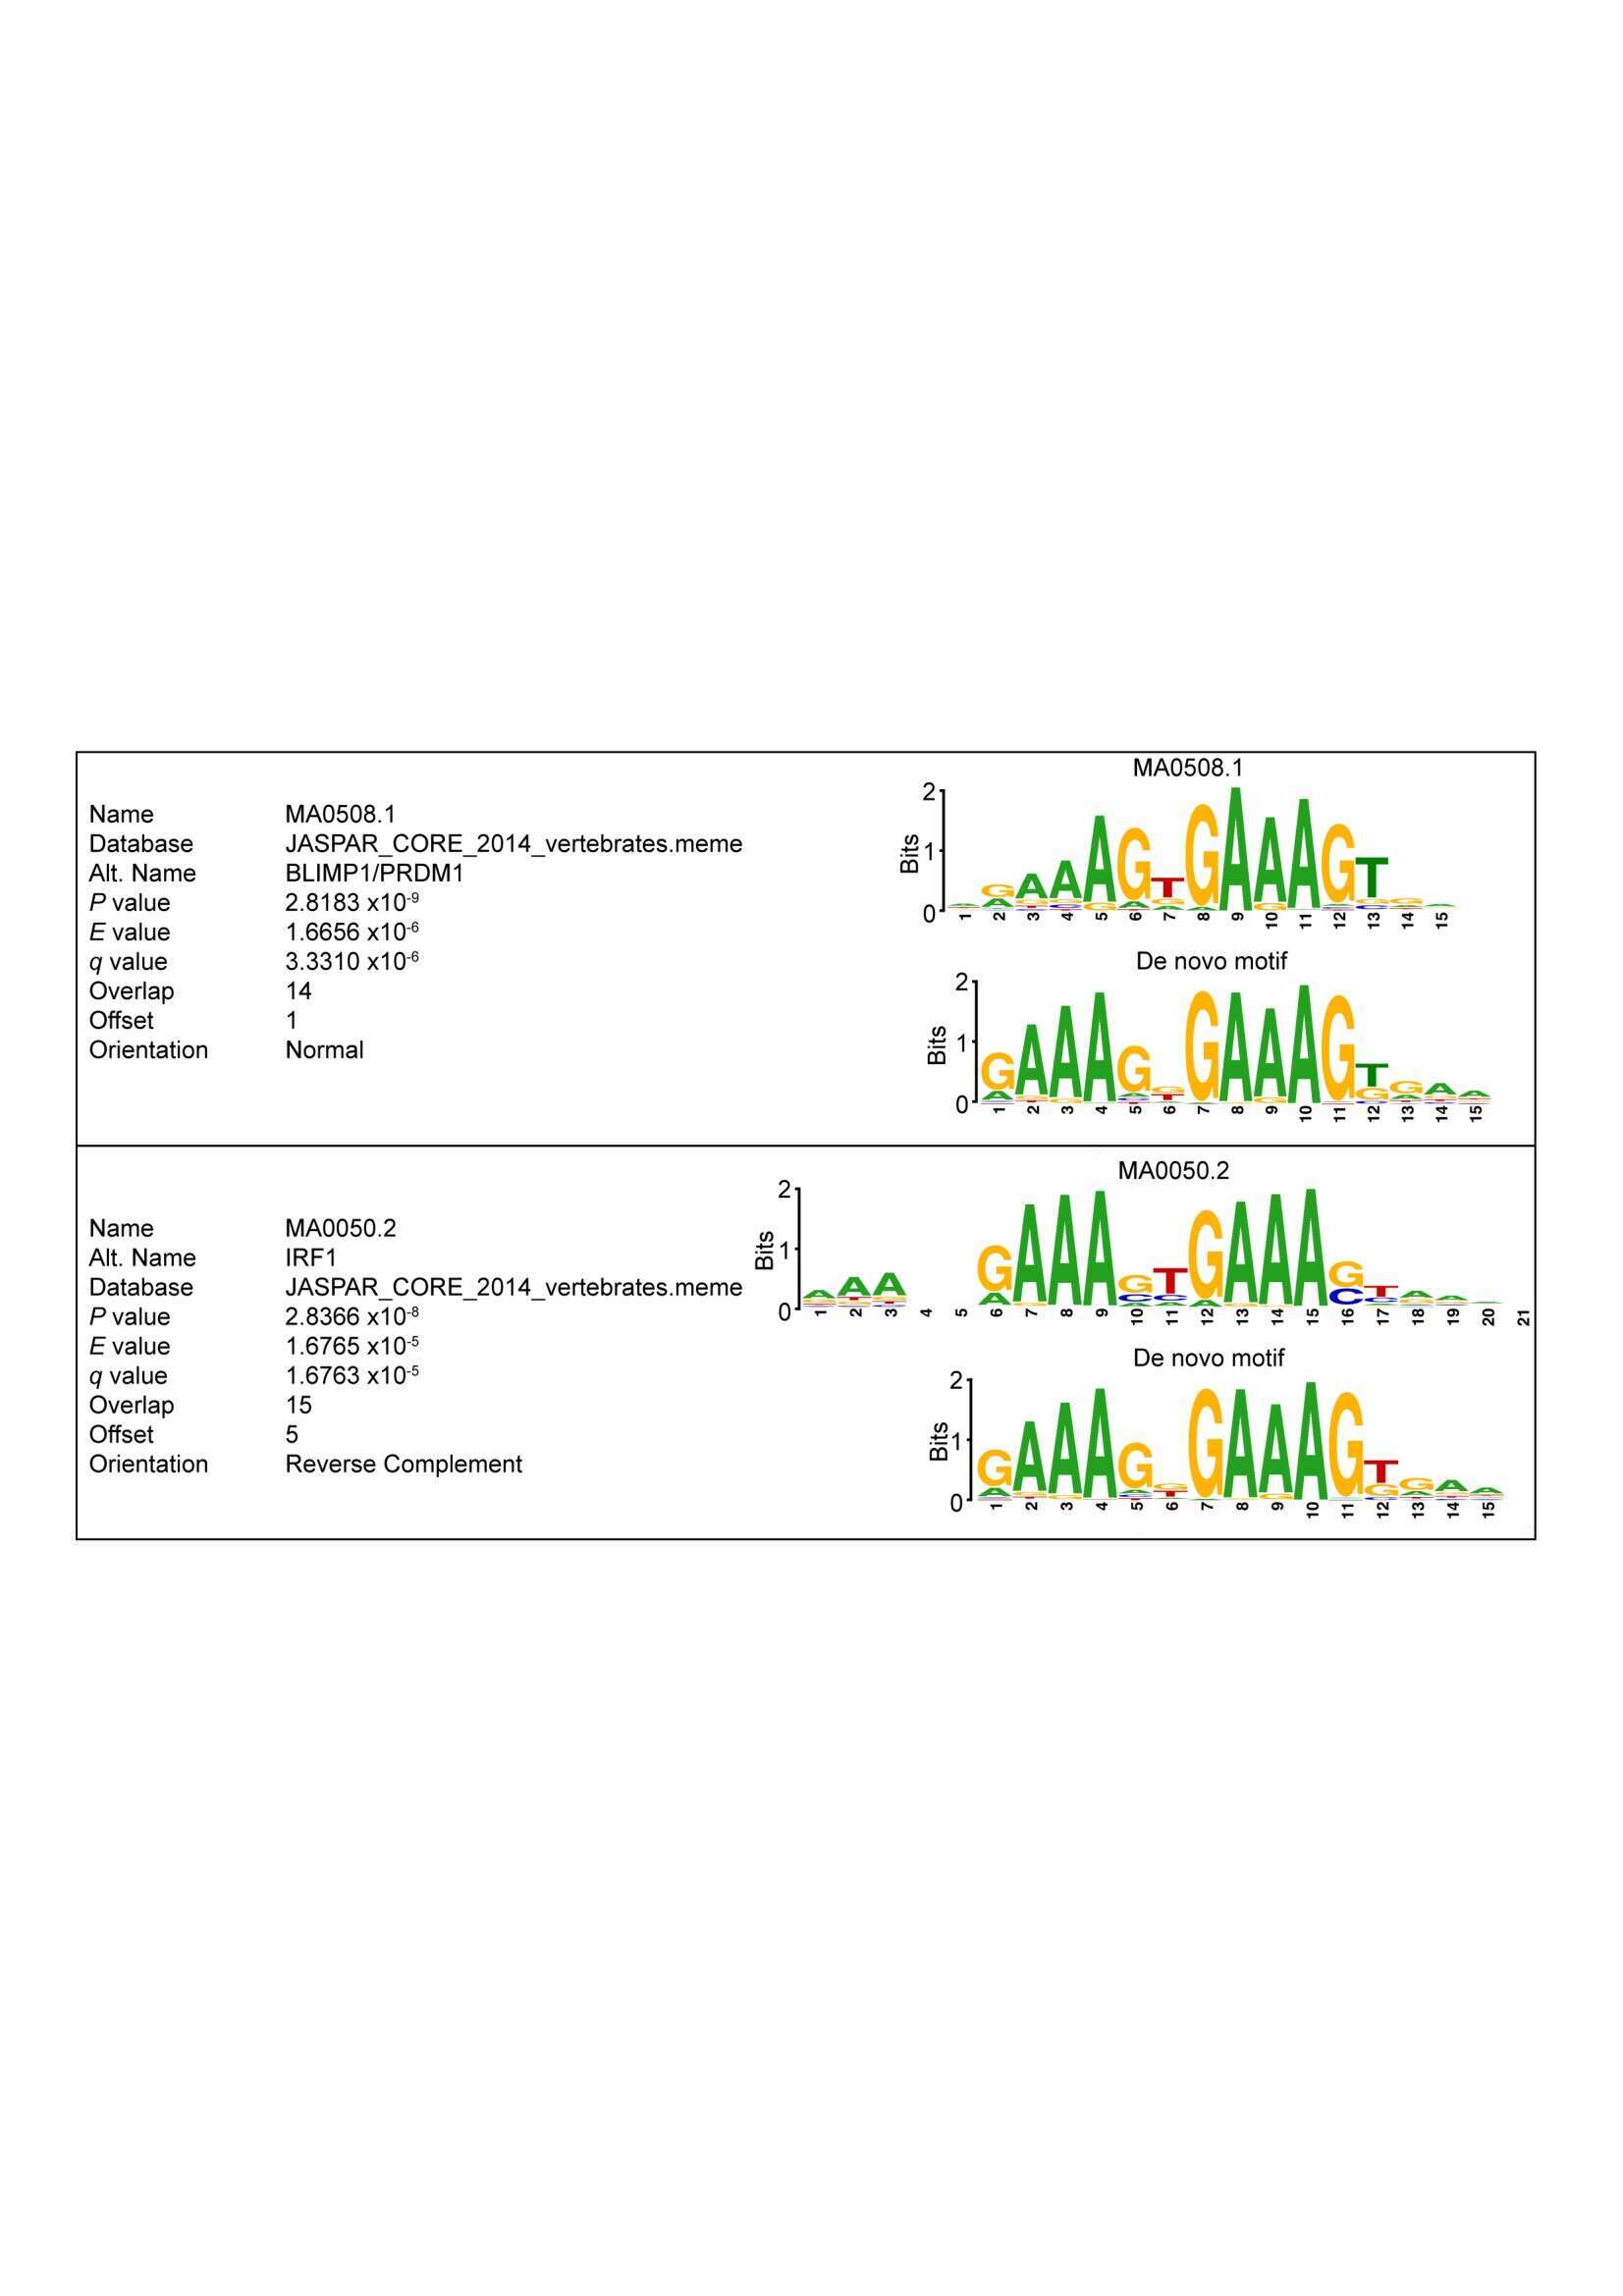
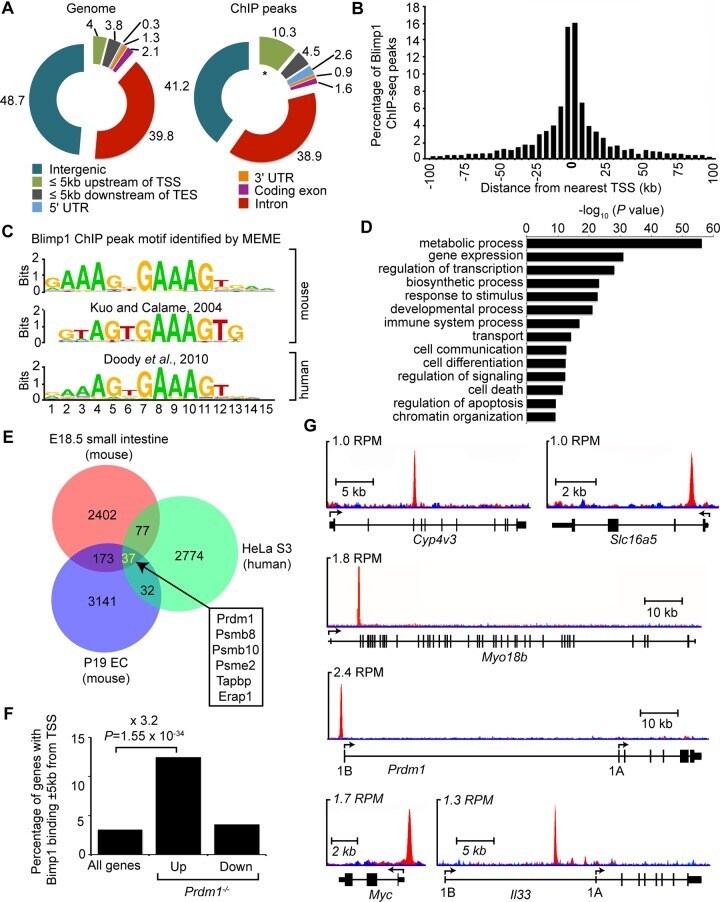
- Fig 3 ChIP-seq analysis of genome-wide Blimp1 binding sites in E18.5 small intestine. (A) Distribution of all Blimp1 peak locations in comparison to whole genome at defined genomic regions. * P = 2.5 x 10 -45 in comparison to whole genome for the same region. (B) The distance of each Blimp1 ChIP-seq peak from the nearest TSS binned at 5 kb intervals. (C) De novo motif analysis (MEME) identifies significant enrichment of a consensus Blimp1 binding motif underlying Blimp1 peaks (n = 2689, MEME E value = 4.7 x 10 -712 ) that closely resembles previously reported mouse (STAMP E value = 3.4 x 10 -7 ) and human BLIMP1 motifs (TOMTOM P value = 2.8 x 10 -9 ). (D) Functional annotation analysis using GREAT reveals Blimp1 preferentially binds to promoter regions upstream of genes associated with metabolism, transcription, developmental and immune processes. (E) A subset of overlapping Blimp1 peaks shared with previously reported mouse and human ChIP-seq datasets. (F) Up-regulated genes in conditional mutants are significantly ( P = 1.1 x 10 -22 ) enriched for Blimp1 binding (+/- 5 kb of TSS) relative to all genes on the array. (G) UCSC track view of ChIP (red) and input (blue) wiggle plot overlays showing enrichment of GFP ChIP-seq density in Prdm1 BEG/BEG embryonic small intestine proximal to the promoters of Cyp4v3 , Slc16a5 , Myo18b , Prdm1 , Myc and Il33 .
- Submitted by
- Invitrogen Antibodies (provider)
- Main image

- Experimental details
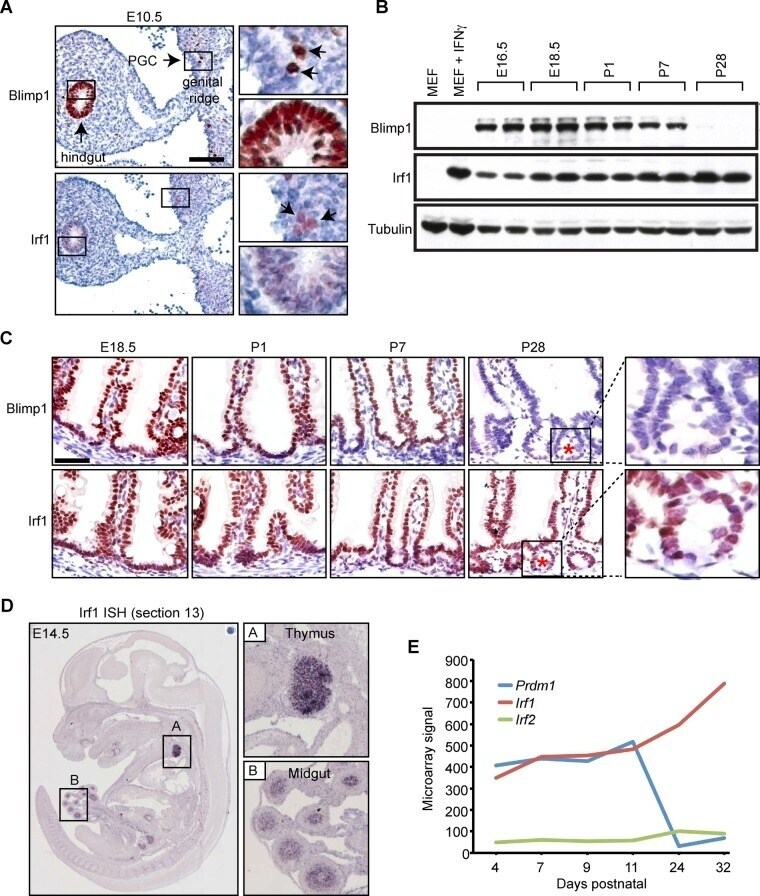
- Fig 4 Irf1 is constitutively expressed in the developing thymus and small intestine. (A) Immunohistochemical staining reveals weak Irf1 expression in the pseudo-stratified epithelium of the developing gut tube and PGCs (black arrows) closely overlaps with robust Blimp1 expression. Bar, 100 mum. (B) Western blot analysis demonstrates Irf1 constitutively expressed in E16.5 intestine and throughout post-natal stages. In contrast, Blimp1 expression becomes down-regulated during the suckling to weaning transition. (C) Irf1 and Blimp1 nuclear staining in the villus epithelium from E18.5 to early postnatal stages (P7). Irf1 expression maintained in villus epithelium at post-weaning stages is readily detectable in the developing crypts of Lieberkuhn (indicated by red asterisk). Bar, 50 mum. (D) ISH analysis reveals Irf1 robustly expressed in the developing thymus and midgut at E14.5 (data from EurExpress) [ 38 ]. (E) Microarray expression data (GEO accession number GDS2989) reveals abundant levels of Irf1 , but not Irf2 transcripts in the early postnatal small intestine are up-regulated at later stages when Blimp1 expression becomes extinguished.
- Submitted by
- Invitrogen Antibodies (provider)
- Main image
- Experimental details
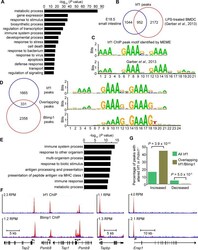
- Fig 5 ChIP-seq analysis of genome-wide Irf1 binding sites in E18.5 small intestine. (A) Functional annotation analysis of genes bound by Irf1. (B) Overlapping Irf1 peaks between those identified in the present study and a mouse LPS-BMDC ChIP-seq dataset. (C) De novo motif analysis identifies significant enrichment of the consensus IRF1 binding motif underlying Irf1 peaks (n = 1996, MEME E value 1.9 x 10 -802 ) that closely resembles the motif identified by Garber et al . [ 42 ] (STAMP E value = 0). (D) Comparison of our Irf1 and Blimp1 ChIP-seq datasets identifies a subset of overlapping peaks that selectively display the IRF1 motif. (E) Functional annotation analysis of genes bound by both Irf1 and Blimp1 demonstrates enrichment of immune response and antigen processing genes. (F) UCSC track view of ChIP (red) and input (blue) Wiggle plots. Both Irf1 and Blimp1 ChIP-seq peaks were present proximal to the promoters of Psmb8 , Psmb9 , Tap1 , Tap2 , Tapbp and Erap1 . Positions of the TSS and direction of transcription are indicated by the arrows. (G) Overlapping Irf1 and Blimp1 peaks near a subset of Irf1 target genes display increased Irf1 occupancy in the absence of Blimp1 competition.

- Submitted by
- Invitrogen Antibodies (provider)
- Main image
- Experimental details
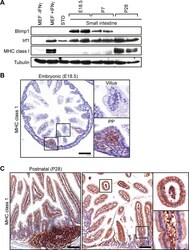
- Fig 6 The onset of MHC class I expression coincides with down-regulated Blimp1 expression during the suckling to weaning transition. (A) Western Blot analysis reveals down-regulated Blimp1 and slightly increased Irf1 co-incident with the onset MHC class I expression detectable at post weaning stages. As a positive control Irf1 and MHC class I were strongly induced in IFNgamma-treated MEFs. (B) Immunohistochemical analysis demonstrates MHC class I expression initially appears in immature Peyer's patches (PP). Bar, 200 mum. (C) MHC class I is robustly expressed in post-natal villus epithelium (P28), as well as mature Peyer's patches and villus mesenchyme. Bar, 200 mum.
- Submitted by
- Invitrogen Antibodies (provider)
- Main image
- Experimental details
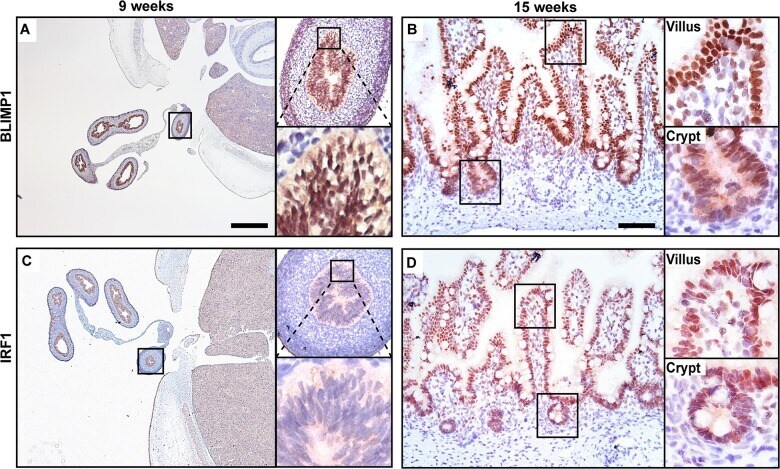
- Fig 7 BLIMP1 and IRF1 are co-expressed in fetal human intestine. Nuclear BLIMP1 staining detected in the pseudostratified epithelium of the developing gut tube at (A) 9 weeks of gestation persists in (B) the villus epithelium including the immature crypts of Lieberkuhn at 15 weeks of gestation. (C) Although not detected in the gut tube prior to villus formation nuclear IRF1 staining is present in the villus epithelium at (D) 15 weeks of gestation. (A, C) Bar, 800 mum, (B, D) Bar 200 mum.
- Submitted by
- Invitrogen Antibodies (provider)
- Main image

- Experimental details
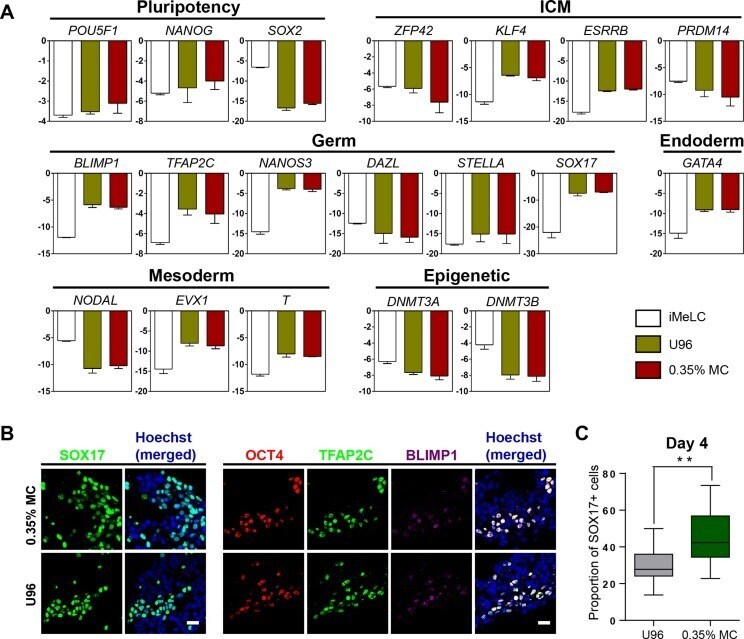
- Figure 2 Similar gene expression profile and germ cell-specific protein level of hPGCLCs generated via 0.35% MC method and U96 method. (A) Quantitative analysis of the expression of specific genes in EpCAM-/INTEGRINalpha6-high cells (day 4) via U96 method and 0.35% MC method, respectively. The error bars represent mean +- SD with three biological replicates (white, iMeLC; green, U96; red, MC). (B) Immunofluorescence analysis of OCT4, TFAP2C, BLIMP1, and SOX17 on day 4 embryoids from 0.35% MC method and U96 method. The nuclei were stained with Hoechst (left). Scale bars, 20 mum. (C) The proportion of Sox17 (+) cells at day 4 EBs via 0.35% MC method and U96 method (right); gray, U96; dark green, 0.35% MC; ** P < 0.01.
- Submitted by
- Invitrogen Antibodies (provider)
- Main image
- Experimental details
- Extended Data Fig.8 Effect of NANOG on hPGC induction, characterization of NANOS3-tdTomato reporter hPSC containing inducible SOX17, BLIMP1 with or without TFAP2C, and similarity between Cytokine- and SOX17/BLIMP1-induced hPGC a. Represents overexpression of Dex-inducible NANOG transgenes in NT reporter Comp-hPSC. b. Day4 embryoids following induction of NANOG (by Dex), with or without cytokines as indicated. c. FACS patterns after induction of hPGCs; NT/AP +ve cells (%) shown in Extended Data Fig. 8b. d. Represents overexpression of Dex-inducible SOX17, Dox-inducible BLIMP1, Shield1(S1)-inducible TFAP2C transgenes in NT reporter Comp-hPSC. e. Immunostaining of NT reporter Comp-hPSC +iSBT 1 day after induction of SOX17, BLIMP1 and TFAP2C by addition of Dex, Dox or S1. Scale bar: 50 um. f. Immunostaining of NT reporter Comp-hPSC +iSB 1 day after induction of SOX17 or BLIMP1 by addition of Dex or Dox. Scale bar: 50 um. g . Immunostaining of day 2 embyroid induced with or without Dex to induce nuclear localization of SOX17. Notably, accumulation of SOX17 signal is observed in +Dex condition. h. Changes in gene expression (RT-qPCR) during hPGC induction: Comp-hPSCs control (AP +ve cells); NT +ve hPGCs induced by SOX17/BLIMP1 or Cytokines; NT -ve cells in cells exposed to Cytokines. i. Unsupervised hierarchical clustering (UHC) of gene expression. j. Gene set enrichment analysis (GSEA) of 123 hPGC-specific genes ( Supplementary Table 1 ) on the transcriptome o

- Submitted by
- Invitrogen Antibodies (provider)
- Main image
- Experimental details
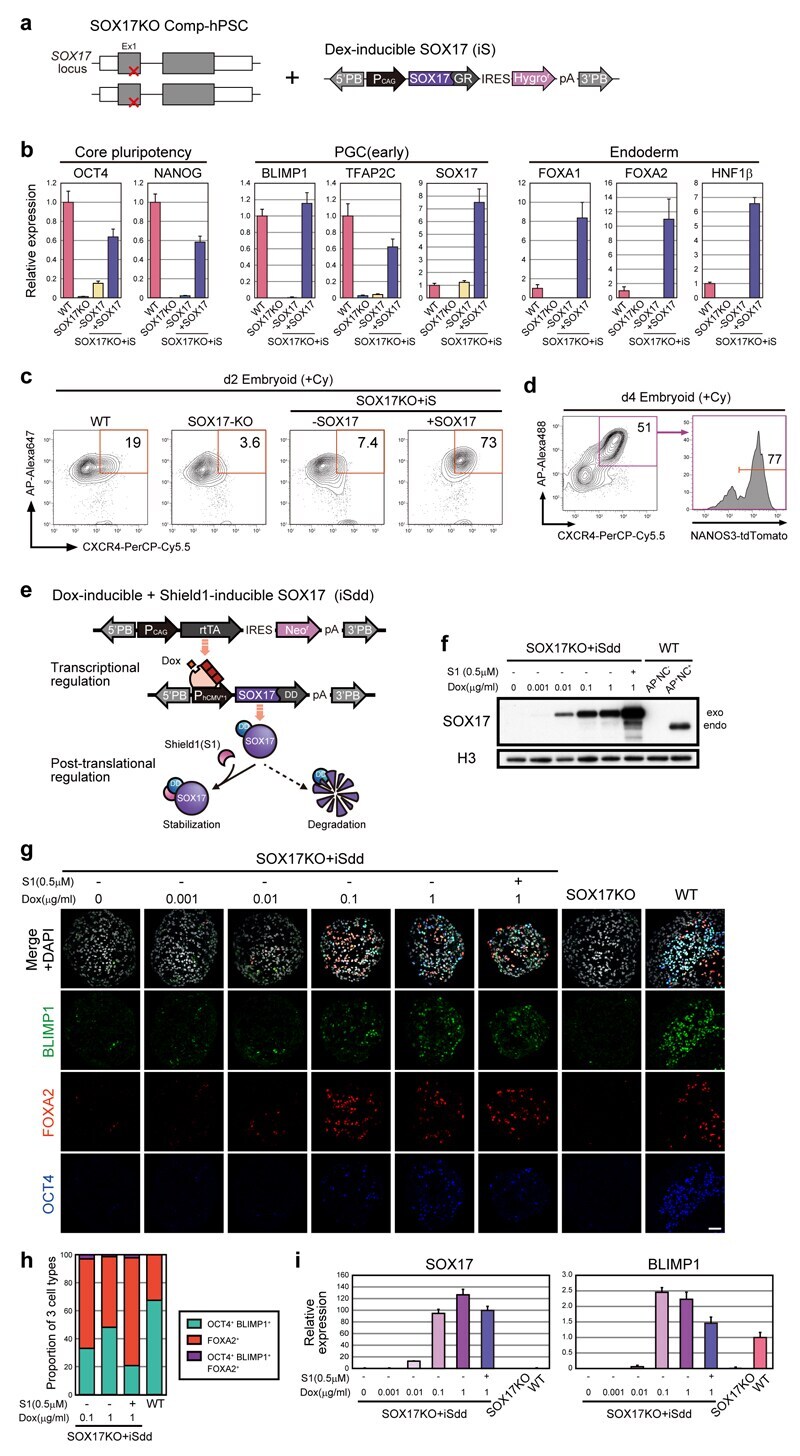
- Extended Data Fig.9 Response of SOX17 KO Comp-hPSC to SOX17 a. Overexpression of Dex-inducible SOX17 (iS) in SOX17 KO Comp-hPSC. b. Gene expression (RT-qPCR) on day 4 of FACS-sorted NANOS3-mCherry (NC)/Alkaline phosphatase (AP) +ve hPGCs by RT-qPCR. c. FACS analysis of d2 embryoids induced from WT Comp-hPSC, SOX17 KO Comp-hPSC and SOX17KO Comp-hPSC rescued with SOX17GR transgene (iS) (% CXCR4/AP+ cells). d. FACS pattern of day 2 embyoid induced from NT reporter Comp-hPSC showing AP/CXCR4 +ve cells expressing NT. e. Represents SOX17 inducible system (iSdd). Expression of SOX17 fused with destabilized domain (DD) can be induced by Doxycycline (Dox); addition of Shield1 (S1) can stabilize SOX17-DD protein. f. Western blots showing SOX17 expression level in day 5 embryoids from SOX17KO+iSdd Comp-hPSC. Embryoids were induced with Cytokines. To induce SOX17, different concentration of Dox and S1 were added. As controls, NC/AP +ve hPGCs and NC/AP -ve cells from WT Comp-hPSC-derived embryoids induced with Cytokines were used. Histone H3 (H3) was used for internal control. g. Immunostaining of day 4 embryoids from SOX17KO+iSdd Comp-hPSC. Embryoids from SOX17 KO and WT Comp-hPSC induced with Cytokines were used as controls. Scale bar: 50 mum. h. Quantification of immunostaining data in Extended Data Fig. 9g. The numbers of OCT4/BLIMP1 +ve hPGCs, FOXA2 +ve endodermal cells and OCT4/BLIMP1 +ve hPGCs expressing FOXA2 were counted from 3 different embryoids. The proportions of the 3 popula
- Submitted by
- Invitrogen Antibodies (provider)
- Main image
- Experimental details
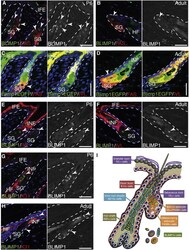
- Figure 1 BLIMP1 Is Expressed by Terminally Differentiated Epidermal Cells in IFE, SG, and HF (A-H) Paraffin sections of murine wild-type or Blimp1EGFP (as indicated) back skin collected at postnatal day (P)6 or P56 (adult) labeled with antibodies against BLIMP1 (green in A, B, and E-H), GFP (green in C and D), FAS (red in A, B, and left panels of C and D), and involucrin (IVL) (red in E, F, and right panels of C and D) and counterstained with DAPI (blue). Black and white panels show BLIMP1 channel separately. Arrowheads, BLIMP1 + cells; dashed lines, epidermal-dermal boundary. (I) Summary of epidermal BLIMP1 expression. HF, hair follicle; IFE, interfollicular epidermis; INF, infundibulum; SG, sebaceous gland. Scale bars represent 50 mum. See also Figure S1 .
- Submitted by
- Invitrogen Antibodies (provider)
- Main image
- Experimental details
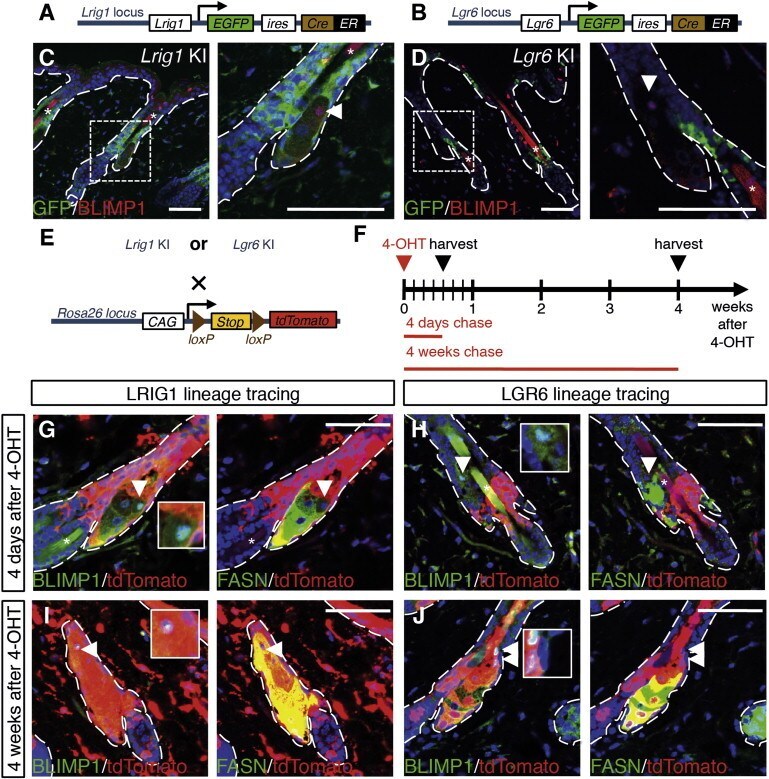
- Figure 6 Lineage Tracing the Progeny of LRIG1 + and LGR6 + Stem Cells (A and B) Genetic elements of the Lrig1 knockin (KI) and Lgr6 KI. (C and D) Paraffin sections of adult Lrig1 KI (C) and Lgr6 KI (D) back skin stained with antibodies against GFP (green) and BLIMP1 (red), counterstained with DAPI (blue). Boxed area is shown at higher magnification. (E and F) Schematic of experimental breeding and procedures. (G-J) Paraffin sections of Lrig1 KI x Rosa26tdTomato (G and I) and Lgr6 KI x Rosa26tdTomato (H and J) collected 4 days (G and H) and 4 weeks (I and J) after one dose of 4-OHT and stained for BLIMP1 (green, left panels) or FAS (green, right panels) and tdTomato (red). Arrowheads indicate BLIMP1 + cells. Dashed lines indicate epidermal-dermal boundary. Scale bars represent 100 mum. See also Figure S4 .
- Submitted by
- Invitrogen Antibodies (provider)
- Main image
- Experimental details
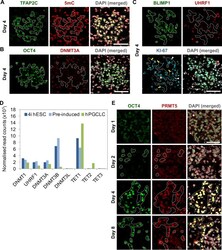
- Figure S3 Immunofluorescence for Epigenetic Modifications and Modifiers in Embryoids, Related to Figure 3 (A-C) Immunofluorescence analysis was carried out for (A) 5-methylcytosine (5mC); (B) DNMT3A; (C) UHRF1 on day 4 embryoids. TFAP2C, OCT4 or BLIMP1 were used to counterstain for hPGCLCs. hPGCLCs were highlighted by white dashed lines. White arrowheads showed examples of KI-67-positive PGCLCs while yellow arrows showed the KI-67-negative PGCLCs (C). Scale bars = 50 mum. (D) Expression level of methylation related epigenetic modifiers from RNA-Seq dataset. Mean normalized read counts from two biological replicates were shown. (E) Immunofluoresence of PRMT5 on cryosections of embryoids collected at day 1, 2, 4 and 8 post-hPGCLC induction. hPGCLCs were counterstained with OCT4 as highlighted. Scale bar = 70 mum.
- Submitted by
- Invitrogen Antibodies (provider)
- Main image
- Experimental details
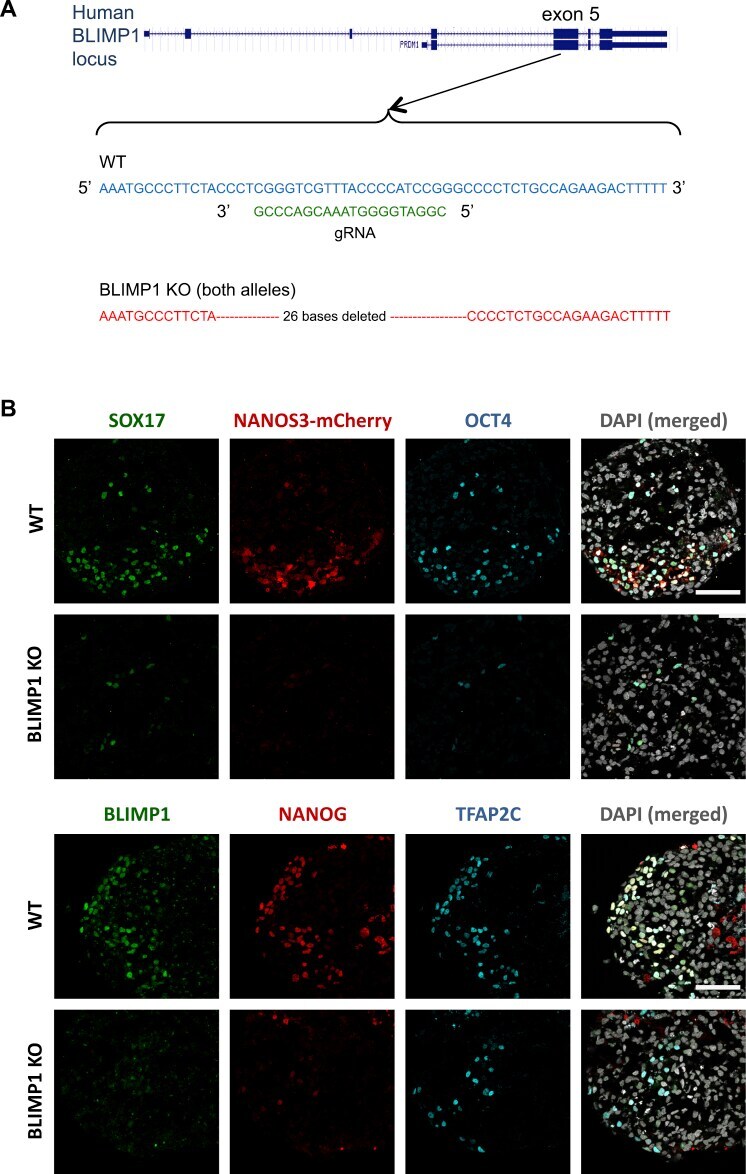
- Figure S5 Generation of BLIMP1 KO in WIS2-NANOS3-mCherry hESC Line, Related to Figure 5 (A) Targeting strategy of BLIMP1 knockout in hESC with the designated guide RNA (gRNA) and the resulting deleted sequences. (B) Immunofluorescence of SOX17, NANOS3-mCherry and OCT4 (upper panel); and BLIMP1, NANOG and TFAP2C on wild-type (WT) and BLIMP1 KO day 4 embryoids. Scale bars = 70 mum.
- Submitted by
- Invitrogen Antibodies (provider)
- Main image
- Experimental details
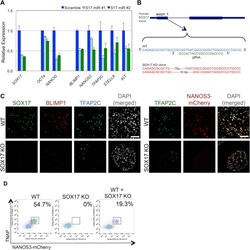
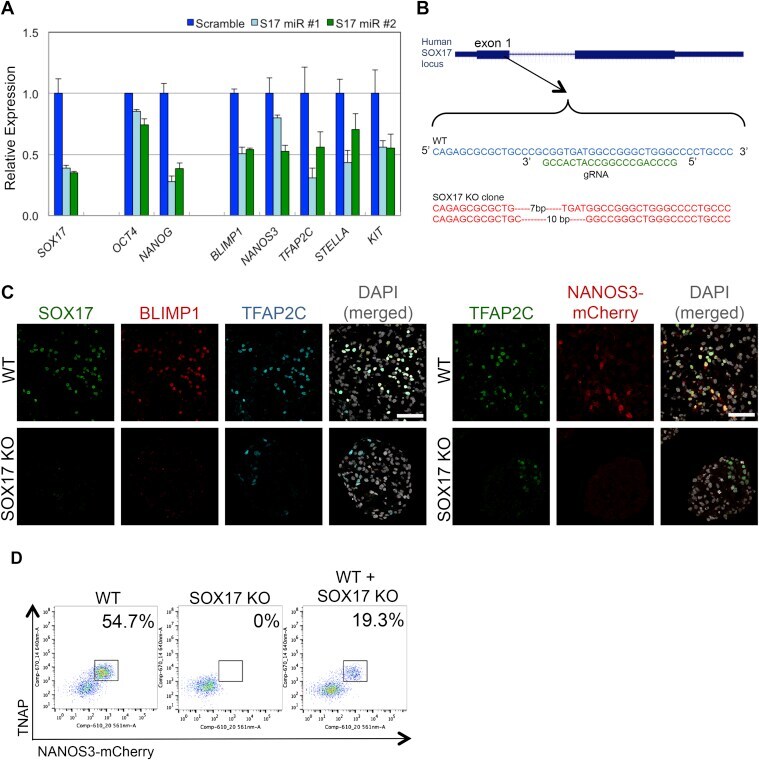
- Figure S6 Generation of SOX17 KO in WIS2-NANOS3-mCherry hESC Line, Related to Figure 6 (A) Expression analysis by RT-qPCR of pluripotency and germ cell genes after knock-down of SOX17 in TCam-2. Two independent, miRs against SOX17 (S17 miR #1 and #2) were used for the knockdown with a scramble miR as control. Error bars are mean +- SD. Relative expression levels are shown with normalization to GAPDH . Representative data were shown from two independent biological replicates. (B) Targeting strategy of SOX17 knockout in hESC with the designated guide RNA (gRNA) and the resulting deleted sequences. (C) Immunofluorescence of SOX17, BLIMP1 and TFAP2C (left panel); and TFAP2C and NANOS3-mCherry on wild-type (WT) and SOX17 KO day 4 embryoids. Scale bars = 70 mum (D) FACS analysis of day 4 embryoids derived from wild-type (WT), SOX17 knockout (SOX17 KO) and 1 to 1 mixture of WT and SOX17 KO cells (WT + SOX17 KO).
- Submitted by
- Invitrogen Antibodies (provider)
- Main image
- Experimental details
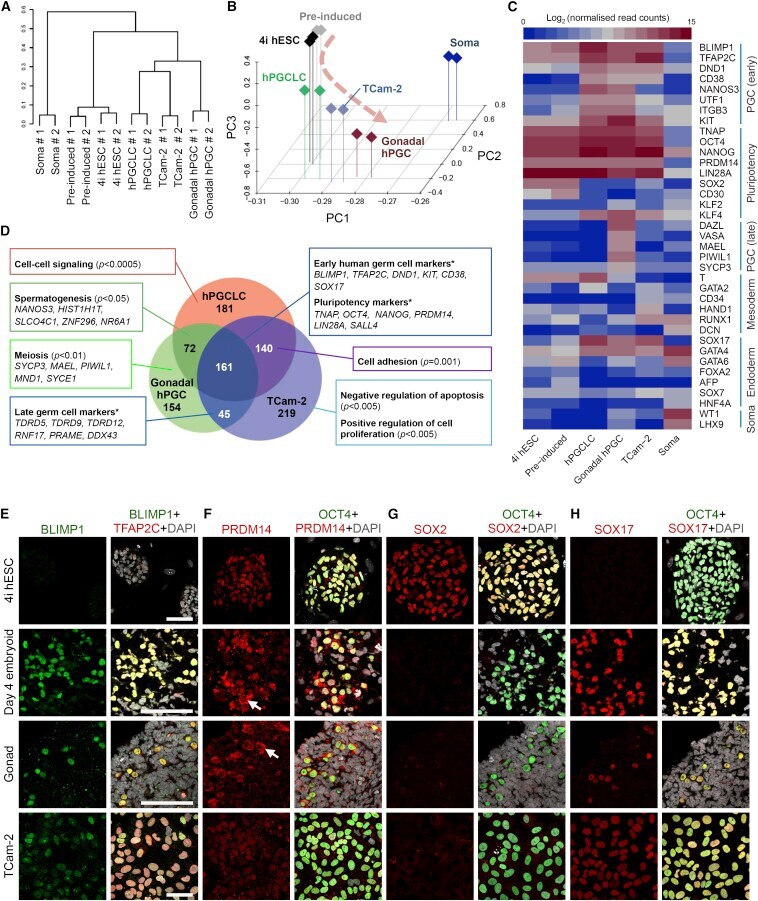
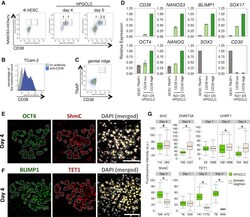
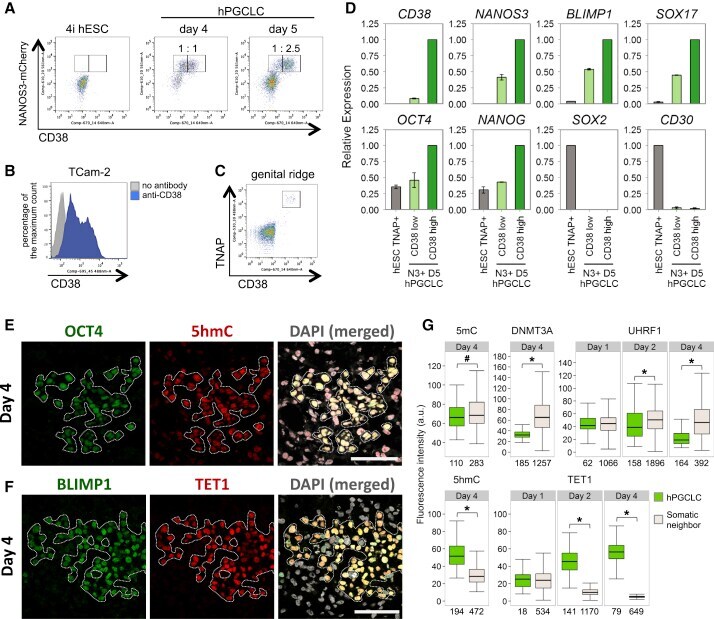
- Figure 2 hPGCLC Shares Transcriptional Profile with Human Embryonic PGCs and TCam-2 Seminoma (A) Unsupervised hierarchical clustering (UHC) of gene expression in 4i hESC, preinduced cells (Pre-induced), day 4 hPGCLCs (hPGCLC), gonadal hPGC, TCam-2, and gonadal somatic cell (Soma). RNA-seq was performed on two biological replicates (#1 and #2) for each cell type. (B) PCA of RNA-seq data. Arrowline indicates potential germline progression from 4i hESC to hPGCLC and gonadal hPGC. (C) Heat map of gene expression of key PGC-associated genes (early and late) and of pluripotency, mesoderm, endoderm, and gonadal somatic (Soma) markers. (D) Venn diagram illustrates common and differentially expressed genes. Significantly upregulated genes in hPGCLC, gonadal hPGC, and TCam-2 (with log2 (fold change) > 3 and adjusted p value < 0.05 versus gonadal Soma, respectively) were compared. Representative genes that were exclusive to each category are indicated. Text boxes indicate gene ontology biological processes (BP) terms that were significantly enriched as indicated by p values. Asterisk denotes custom categories absent from BP annotation. (E-H) Immunofluorescence analysis for (E) BLIMP1, (F) PRDM14, (G) SOX2, and (H) SOX17 on 4i hESCs (top row), day 4 hPGCLC embryoids (second row), human week 7 male gonad (third row), and TCam-2 (bottom row). Samples were counterstained with TFAP2C or OCT4 to identify hPGCLCs in embryoids and hPGCs in embryonic gonad. Arrows indicate cytoplasmic enrichment
- Submitted by
- Invitrogen Antibodies (provider)
- Main image
- Experimental details
- Figure 3 CD38 Expression in Human Germ-Cell-Related Cells and Epigenetic Changes in hPGCLCs (A) FACS analysis of NANOS3-mCherry and CD38 on WIS2-NANOS3-mCherry cell line cultured in 4i medium and on day 4 and 5 embryoids following hPGCLC induction. Ratios of CD38 low and high expression in the NANOS3-mCherry-positive cells are indicated. (B) FACS histogram of CD38 low and high populations in TCam-2. (C) FACS analysis of CD38 and TNAP on genital ridges isolated from a week 6 human embryo. (D) Expression analysis by RT-qPCR for FACS-sorted TNAP-positive 4i hESCs (TNAP+ hESC) and CD38 low or high/NANOS3-mCherry day 5 hPGCLCs. Relative expression levels are shown with normalization to beta-ACTIN . Error bars indicate mean +- SD from two independent biological replicates. (E and F) Immunofluorescence analysis for 5hmC (E) and TET1 (F) on day 4 embryoids cryosection. OCT4 or BLIMP1 were used to identify hPGCLCs (highlighted). Scale bars, 50 mum. (G) Quantification of immunofluorescence intensity of various epigenetic marks/modifiers in hPGCLCs and somatic neighbors in day 1-4 embryoids (see also Figures S3 A-S3C). For UHRF1, only KI-67-positive (proliferating) cells were used for quantification. Numbers below each box denotes number of cells analyzed. Black central line represents the median, boxes and whiskers represent the 25 th and 75 th , and 2.5 th and 97.5 th percentiles, respectively. Wilcoxon signed-rank test was used to test for statistical significance. #p < 0.05; * p < 0
- Submitted by
- Invitrogen Antibodies (provider)
- Main image
- Experimental details
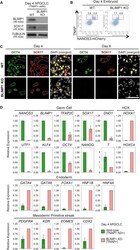
- Figure 5 Role of BLIMP1 in hPGCLC Specification (A) Western blot analysis of BLIMP1 and SOX17 in TNAP-positive (TNAP+) cells sorted from wild-type (WT) and BLIMP1 knockout (BLIMP1 KO) day 4 embryoids after hPGCLC induction. TUBULIN was used as loading control. (B) FACS analysis of TNAP and NANOS3-mCherry on WT and BLIMP1 knockout (BLIMP1 KO) day 4 embryoids. (C) Immunofluorscence for OCT4 and SOX17 in cryosections of WT and BLIMP1 KO day 4 and 8 embryoids. OCT4-positive cells are highlighted. Scale bar, 50 mum. (D) Expression analysis by RT-qPCR for WT TNAP/NANOS3-mCherry double-positive cells (WT; TNAP+N3+) and BLIMP1 KO TNAP single-positive cells (BLIMP1 KO; TNAP+) sorted from day 4 embryoids. Relative expression levels are shown with normalization to beta-ACTIN . Error bars indicate mean +- SD from two independent biological replicates.

- Submitted by
- Invitrogen Antibodies (provider)
- Main image
- Experimental details
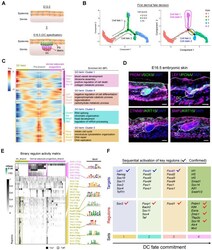
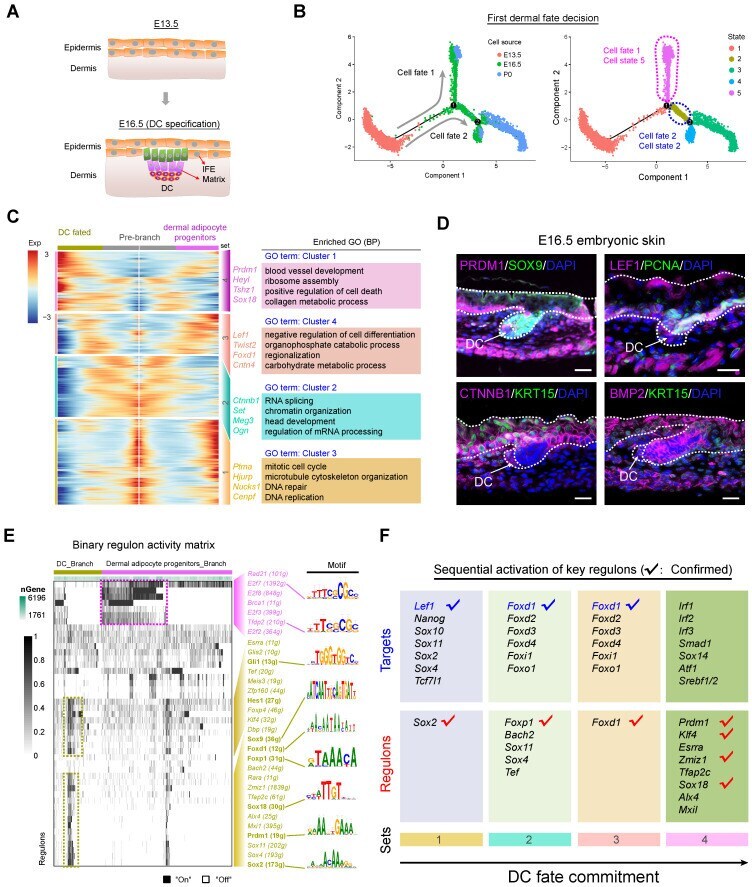
- Figure 2 Recapitulating dermal cell fate decision towards DC fate. (A) Diagram deciphering dermal lineage and epidermal lineage differentiation at E13.5 to E16.5. (B) Pseudotime ordering of all dermal cell lineage cells. Each dot represents one cell and each branch represents one cell state. The left plot was labeled with developmental time and the right plot was labeled with cell states. (C) Heatmap illustrating the (differentially expressed genes, DEGs) dynamics towards DC and fibroblast fate along pseudotime. The DEGs were clustered into 4 gene sets according to k -means and the expression curve was illustrated in the middle. GO terms enriched for each gene set were labeled in the right panel. DC fated represents cell fate 2 in Figure 2 B, while dermal adipocyte progenitors represent cell fate 1 in Figure 2 B. (D) Immunofluorescence analysis of PRDM1, SOX9, LEF1, PCNA, CTNNB1, KRT15 and BMP2 expression in the E16.5 dorsal skin. Scale bars, 50 mum. (E) SCENIC binary regulon activity heatmap depicting DC and fibroblast enriched regulons. The column depicts a single cell while the row depicts regulons. For the regulons of particular interest, their representative binding motif was visualized in the right panel. ""On"" depicts active, while ""Off"" represents inactive. (F) Sequential visualization of enriched regulon activity in each gene set corresponding to Figure 2 C. Their representative target genes were also provided and the red ticks depict confirmed markers in DC fate
- Submitted by
- Invitrogen Antibodies (provider)
- Main image
- Experimental details
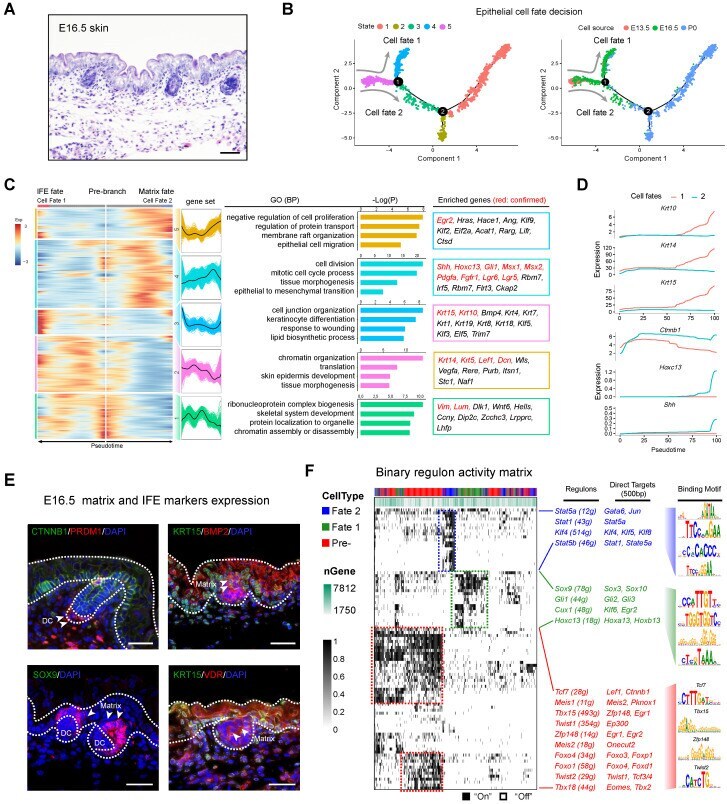
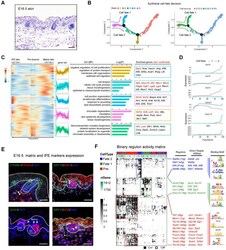
- Figure 4 Dissecting molecular signature underlying matrix and IFE precursor fate commitment. (A) Histology analysis of E16.5 embryonic skin. Scale bar, 50 um. (B) Pseudotime ordering of all epithelium cell populations from three developmental time stages. Each dot represents one cell. The left plot was color-coded with stage information, while the right plot was color-coded with developmental stages. (C) Heatmap displaying branch specific DEGs expression in branch point 1 in Figure 4 B. Cell fate 1 indicates matrix fate and cell fate 2 indicates IFE fate. The corresponding expression curve and enriched GO terms for each gene set were visualized in the middle panel. The representative DEGs for each gene set were shown in the rectangular box (right panel) with red depicting confirmed signature genes. (D) Expression dynamics of representative branch specific marker genes along pseudotime. (E) Immunofluorescence analysis of CTNNB1, PRDM1, KRT15, BMP2, SOX9 and VDR expression in E16.5 skin tissues. Scale bar, 50 um. (F) Binary regulon activity heatmap illustrating the branch-specific enrichment of key regulons. The representative regulons and their corresponding targets (500 bp upstream of TSS) were listed in the middle panel. The binding motif was listed in the right panel.