 Explore
 Validate
 Learn
Learn25-1529-42
antibody from Invitrogen Antibodies
Targeting: CTLA4
CD, CD152, CELIAC3, CTLA-4, GSE, IDDM12
 Flow cytometry
Antibody data
- Antibody Data
- Antigen structure
- References [8]
- Comments [0]
- Validations
- Flow cytometry [1]
- Other assay [8]
Submit
Validation data
Reference
Comment
Report error
- Product number
- 25-1529-42 - Provider product page

- Provider
- Invitrogen Antibodies
- Product name
- CD152 (CTLA-4) Monoclonal Antibody (14D3), PE-Cyanine7, eBioscience™
- Antibody type
- Monoclonal
- Antigen
- Other
- Description
- Description: The 14D3 monoclonal antibody reacts with human CD152, also known as cytotoxic T lymphocyte antigen-4 (CTLA-4). CTLA-4, a protein with structural similarities to CD28, is expressed on activated T cells (activated B cells may also express CTLA-4) and binds the B7 family members, CD80 (B7-1) and CD86 (B7-2), with higher affinity than CD28 does. CTLA-4 and CD28 appear to deliver opposing signals to T cells: while CD28 is a potent costimulator, CTLA-4 restricts the progression of T cells to an activated state by inhibiting IL-2 secretion and cellular proliferation. The cytoplasmic portion of CTLA-4 contains ER retention motifs, resulting in intracellular localization of a large proportion of newly synthesized CTLA-4 in response to TCR signaling. The 14D3 antibody also recognizes rhesus monkey and has inhibitor activity. Applications Reported: This 14D3 antibody has been reported for use in intracellular staining followed by flow cytometric analysis. Applications Tested: This 14D3 antibody has been tested by intracellular staining and flow cytometric analysis of stimulated human peripheral blood cells using the Intracellular Fixation & Permeabilization Buffer Set (Product # 88-8824-00) and protocol. Please refer to Best Protocols: Protocol A: Two step protocol for (cytoplasmic) intracellular proteins located under the Resources Tab online. Furthermore, due to the intracellular localization of a large portion of CTLA-4, for complete detection it may be necessary to assess intracellular expression, in addition to surface expression of CTLA-4. Light sensitivity: This tandem dye is sensitive to photo-induced oxidation. Please protect this vial and stained samples from light. Fixation: Samples can be stored in IC Fixation Buffer (Product # 00-8222) (100 µL of cell sample + 100 µL of IC Fixation Buffer) or 1-step Fix/Lyse Solution (Product # 00-5333) for up to 3 days in the dark at 4°C with minimal impact on brightness and FRET efficiency/compensation. Some generalizations regarding fluorophore performance after fixation can be made, but clone specific performance should be determined empirically. Excitation: 488-561 nm; Emission: 775 nm; Laser: Blue Laser, Green Laser, Yellow-Green Laser. Filtration: 0.2 µm post-manufacturing filtered.
- Reactivity
- Human
- Host
- Mouse
- Isotype
- IgG
- Antibody clone number
- 14D3
- Vial size
- 100 Tests
- Concentration
- 5 µL/Test
- Storage
- 4° C, store in dark, DO NOT FREEZE!
Submitted references Cancer stem-like cells evade CD8(+)CD103(+) tumor-resident memory T (T(RM)) lymphocytes by initiating an epithelial-to-mesenchymal transition program in a human lung tumor model.
Engineering advanced logic and distributed computing in human CAR immune cells.
Methylome-based cell-of-origin modeling (Methyl-COOM) identifies aberrant expression of immune regulatory molecules in CLL.
Accumulation of TNFR2-expressing regulatory T cells in malignant pleural effusion of lung cancer patients is associated with poor prognosis.
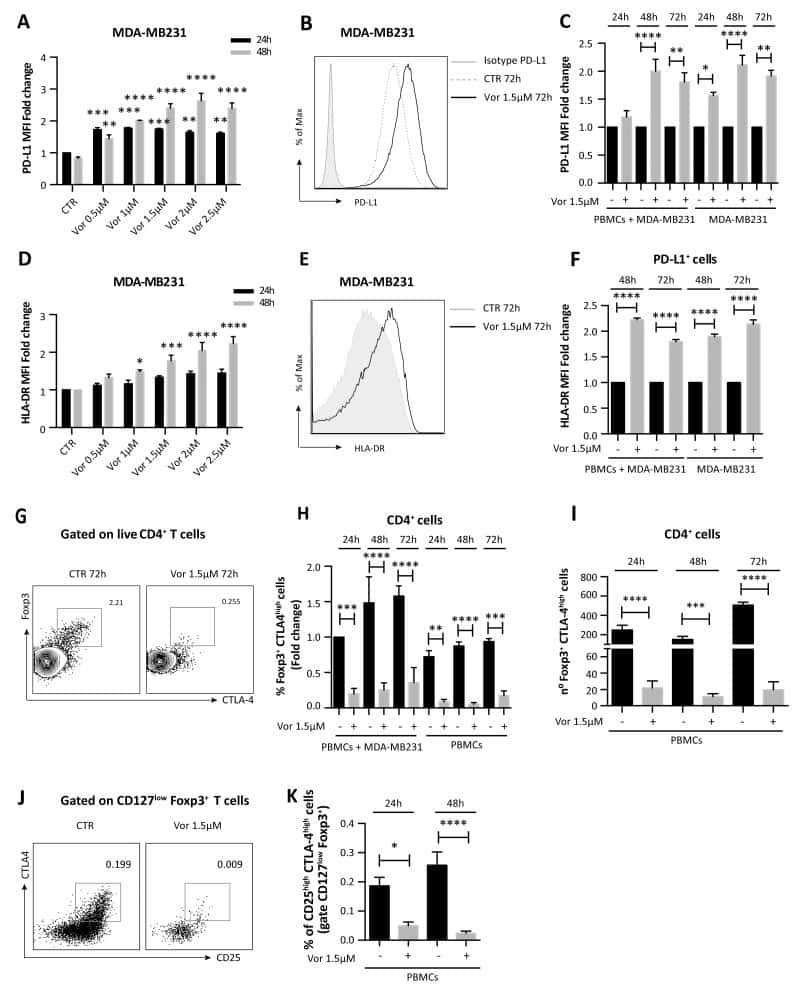
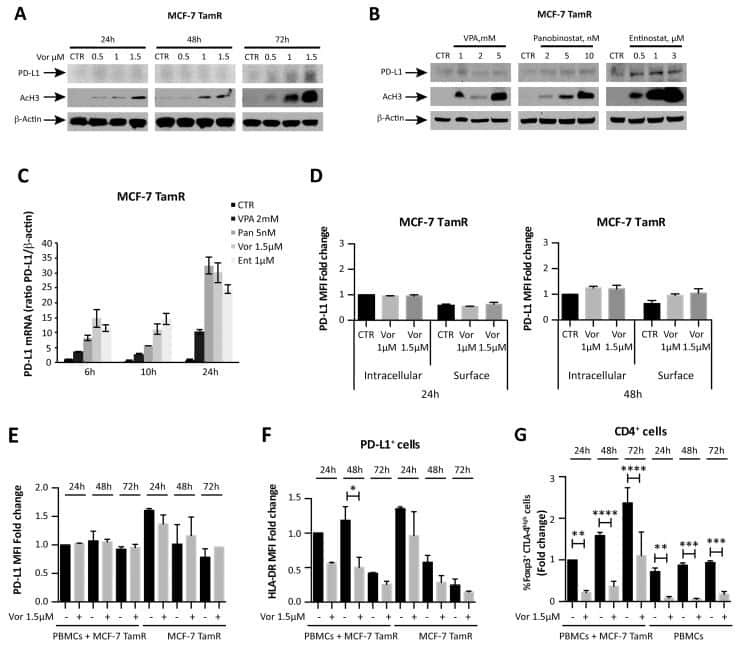
HDAC inhibition potentiates immunotherapy in triple negative breast cancer.
Immunodominant Dengue Virus-Specific CD8+ T Cell Responses Are Associated with a Memory PD-1+ Phenotype.
Follicular regulatory T cells impair follicular T helper cells in HIV and SIV infection.
Soluble CTLA-4 in autoimmune thyroid diseases: relationship with clinical status and possible role in the immune response dysregulation.
Corgnac S, Damei I, Gros G, Caidi A, Terry S, Chouaib S, Deloger M, Mami-Chouaib F
Journal for immunotherapy of cancer 2022 Apr;10(4)
Journal for immunotherapy of cancer 2022 Apr;10(4)
Engineering advanced logic and distributed computing in human CAR immune cells.
Cho JH, Okuma A, Sofjan K, Lee S, Collins JJ, Wong WW
Nature communications 2021 Feb 4;12(1):792
Nature communications 2021 Feb 4;12(1):792
Methylome-based cell-of-origin modeling (Methyl-COOM) identifies aberrant expression of immune regulatory molecules in CLL.
Wierzbinska JA, Toth R, Ishaque N, Rippe K, Mallm JP, Klett LC, Mertens D, Zenz T, Hielscher T, Seifert M, Küppers R, Assenov Y, Lutsik P, Stilgenbauer S, Roessner PM, Seiffert M, Byrd J, Oakes CC, Plass C, Lipka DB
Genome medicine 2020 Mar 18;12(1):29
Genome medicine 2020 Mar 18;12(1):29
Accumulation of TNFR2-expressing regulatory T cells in malignant pleural effusion of lung cancer patients is associated with poor prognosis.
Ye LL, Peng WB, Niu YR, Xiang X, Wei XS, Wang ZH, Wang X, Zhang SY, Chen X, Zhou Q
Annals of translational medicine 2020 Dec;8(24):1647
Annals of translational medicine 2020 Dec;8(24):1647
HDAC inhibition potentiates immunotherapy in triple negative breast cancer.
Terranova-Barberio M, Thomas S, Ali N, Pawlowska N, Park J, Krings G, Rosenblum MD, Budillon A, Munster PN
Oncotarget 2017 Dec 26;8(69):114156-114172
Oncotarget 2017 Dec 26;8(69):114156-114172
Immunodominant Dengue Virus-Specific CD8+ T Cell Responses Are Associated with a Memory PD-1+ Phenotype.
de Alwis R, Bangs DJ, Angelo MA, Cerpas C, Fernando A, Sidney J, Peters B, Gresh L, Balmaseda A, de Silva AD, Harris E, Sette A, Weiskopf D
Journal of virology 2016 May;90(9):4771-4779
Journal of virology 2016 May;90(9):4771-4779
Follicular regulatory T cells impair follicular T helper cells in HIV and SIV infection.
Miles B, Miller SM, Folkvord JM, Kimball A, Chamanian M, Meditz AL, Arends T, McCarter MD, Levy DN, Rakasz EG, Skinner PJ, Connick E
Nature communications 2015 Oct 20;6:8608
Nature communications 2015 Oct 20;6:8608
Soluble CTLA-4 in autoimmune thyroid diseases: relationship with clinical status and possible role in the immune response dysregulation.
Saverino D, Brizzolara R, Simone R, Chiappori A, Milintenda-Floriani F, Pesce G, Bagnasco M
Clinical immunology (Orlando, Fla.) 2007 May;123(2):190-8
Clinical immunology (Orlando, Fla.) 2007 May;123(2):190-8
No comments: Submit comment
Supportive validation
- Submitted by
- Invitrogen Antibodies (provider)
- Main image
- Experimental details
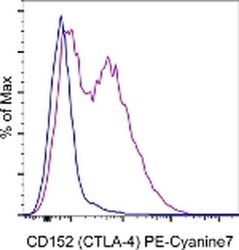
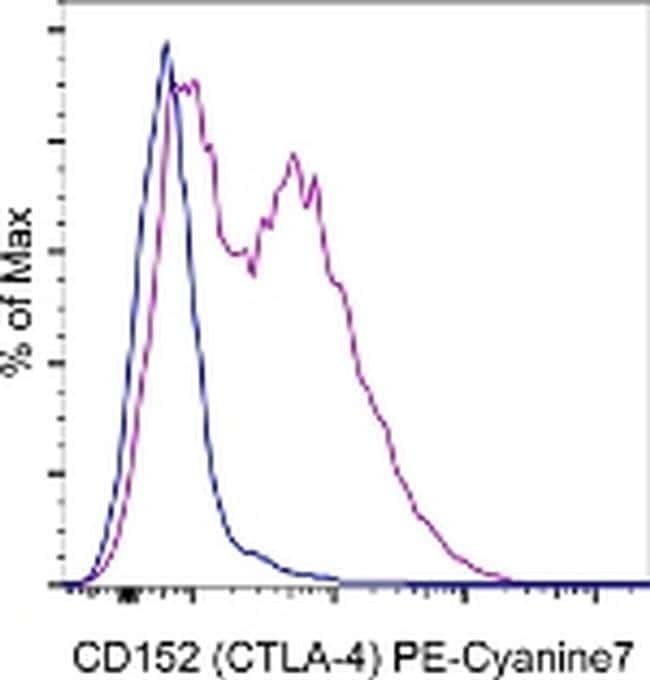
- Unstimulated (blue histogram) or 3-day PHA-stimulated normal human peripheral blood cells (purple histogram) were intracellularly stained with Anti-Human CD152 (CTLA-4) PE-Cyanine7 using the Intracellular Fixation & Permeabilization Buffer Set (Product # 88-8824-00) and protocol. Viable cells in the lymphocyte gate, as determined by Fixable Viability Dye eFluor® 450 (Product # 65-0863-14), were used for analysis.
Supportive validation
- Submitted by
- Invitrogen Antibodies (provider)
- Main image

- Experimental details
- NULL
- Submitted by
- Invitrogen Antibodies (provider)
- Main image

- Experimental details
- NULL
- Submitted by
- Invitrogen Antibodies (provider)
- Main image

- Experimental details
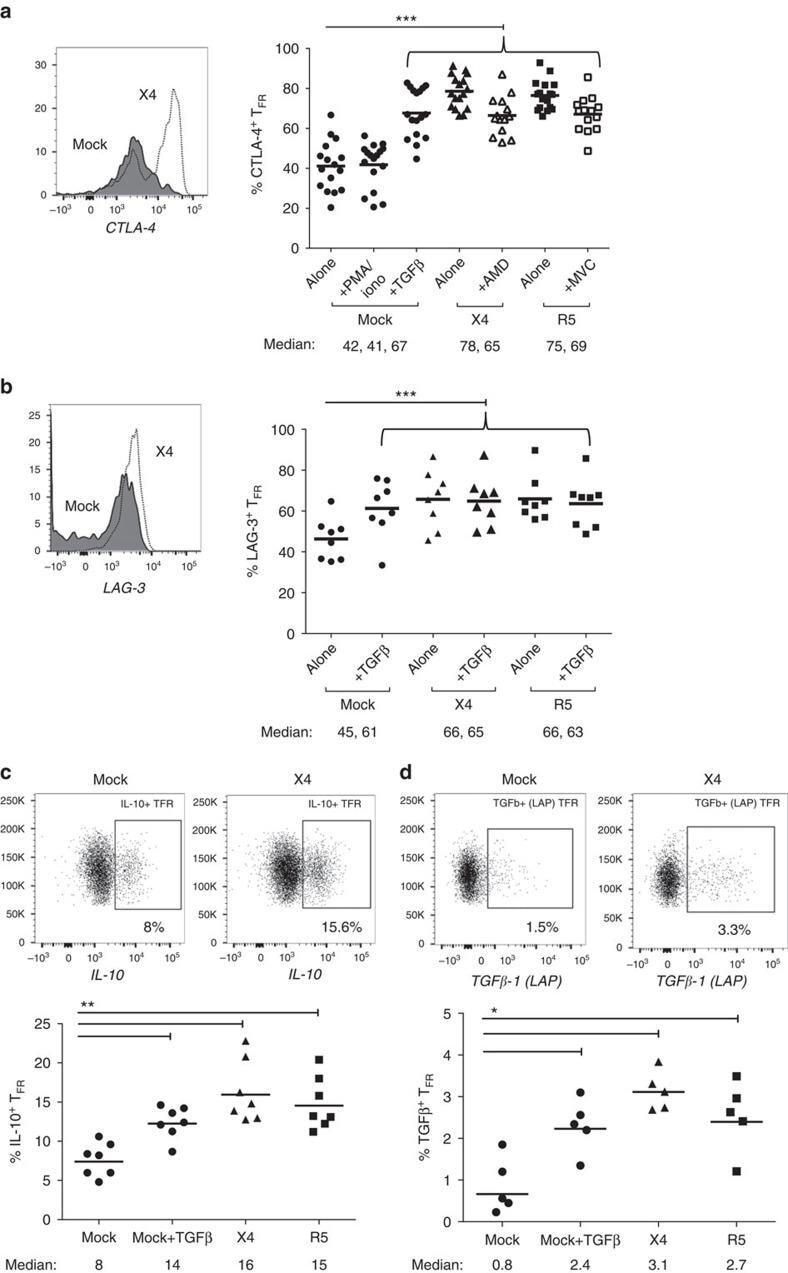
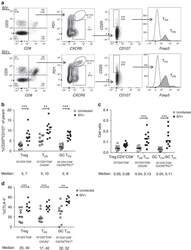
- Figure 6 T FR exhibit an enhanced regulatory phenotype in ex vivo HIV infection. Tonsil cells were mock-, X4-, or R5-spinoculated and cultured under experimental conditions as indicated. T FR were then analysed for expression of regulatory receptors and cytokine production by intracellular cytokine staining. ( a ) Percentage of total (surface and intracellular) T FR CTLA-4 expression ( n =15). ( b ) Percentage of surface T FR LAG-3 expression ( n =8). ( c ) Production of IL-10 by T FR ( n =7). ( d ) Production of TGF-beta-1 (measured as LAP) by T FR ( n =5). The horizontal bars of each graph indicate the median value and are listed where appropriate for clarity. Statistical analyses were performed by Friedman ( a , b ) or Mann-Whitney tests ( c , d ) and significance is denoted by asterisks where * P
- Submitted by
- Invitrogen Antibodies (provider)
- Main image
- Experimental details
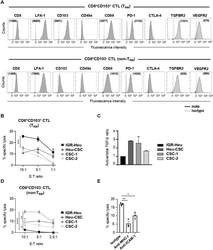
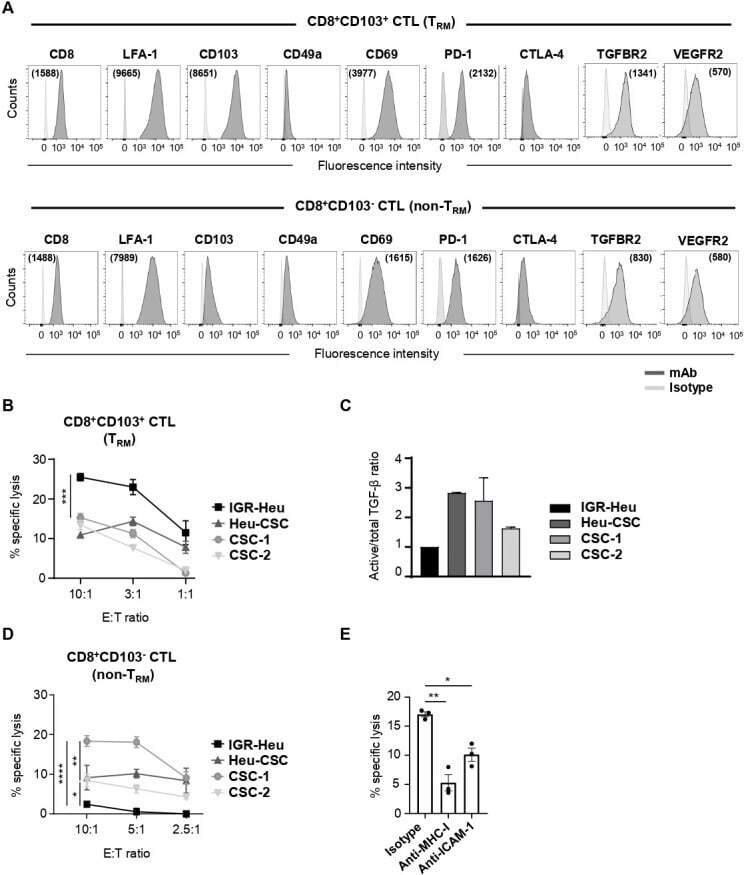
- Resident memory T (T RM ) and non-T RM phenotypic profiles and susceptibility of cancer stem cell (CSC) to cytotoxic T lymphocyte (CTL)-mediated killing. (A) Flow cytometry analyses of CD8, LFA-1, CD103, CD49a, CD69, PD-1, CTLA-4, TGFBR2 and VEGFR2 on CD8 + CD103 + T RM (Heu171) and CD8 + CD103 - non-T RM (H32-22) clones. Mean immunofluorescence intensity (MFI) are in parentheses. (B) Cytotoxic activity of the T RM clone (Heu171) towards autologous IGR-Heu, Heu-CSC, CSC-1 and CSC-2 target cells. Percent of specific lysis are shown at indicated effector to target (E:T) ratios. (C) Quantification of transforming growth factor (TGF)-beta in conditioned media from IGR-Heu, Heu-CSC, CSC-1 and CSC-2 by multi-analyte flow assay. Ratios of active/total TGF-beta normalized to IGR-Heu are included. Results are presented as mean+-SEM of duplicates. (D) Cytotoxicity of the non-T RM clone (H32-22) towards autologous IGR-Heu, Heu-CSC, CSC-1 and CSC-2 target cells. (E) Inhibition of T RM -cell-mediated killing. CSC-1 cells are preincubated in the presence of isotype control, anti-major histocompatibility complex class I (MHC-I) or anti-intercellular adhesion molecule 1 (ICAM-1) neutralizing monoclonal antibody (mAb) and then CTL were added at 5:1 E:T ratio. Symbols represent replicates and horizontal bars represent means+-SEM (n=3). P value was determined by two-way analysis of variance test. *p
- Submitted by
- Invitrogen Antibodies (provider)
- Main image

- Experimental details
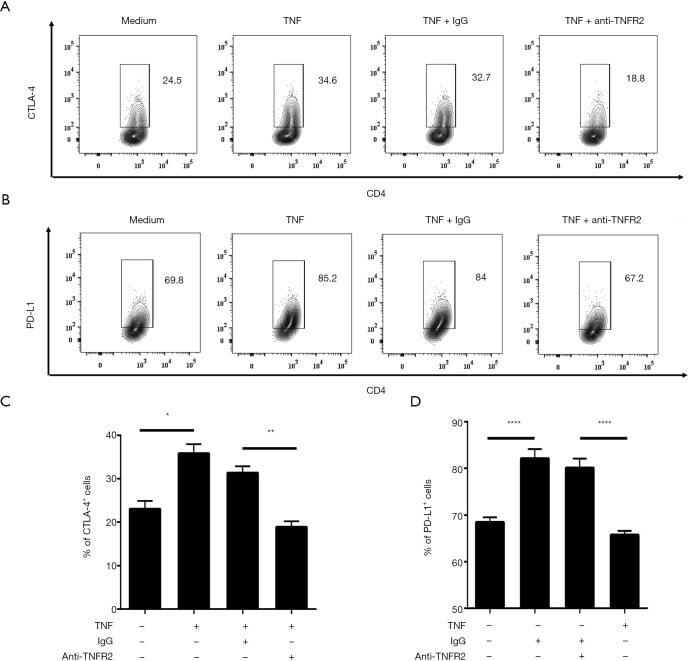
- Effects of TNF on the suppressive function of TNFR2 + Tregs. Purified CD4 + T cells were cultured in medium alone, TNF (50 ng/mL), TNF combined with anti-TNFR2 mAbs (10 ug/mL), or isotype IgG, as indicated, for 72 hours. The representative FACS analysis of (A) CTLA-4 + cells and (B) PD-L1 + cells in TNFR2 + Tregs as indicated, gated on live CD4 + Foxp3 + cells. Summary of the proportions of (C) CTLA-4 + cells (n=3) and (D) PD-L1 + cells (n=3) in Tregs within each condition. Data are expressed as means +- SEM. *, P
- Submitted by
- Invitrogen Antibodies (provider)
- Main image
- Experimental details
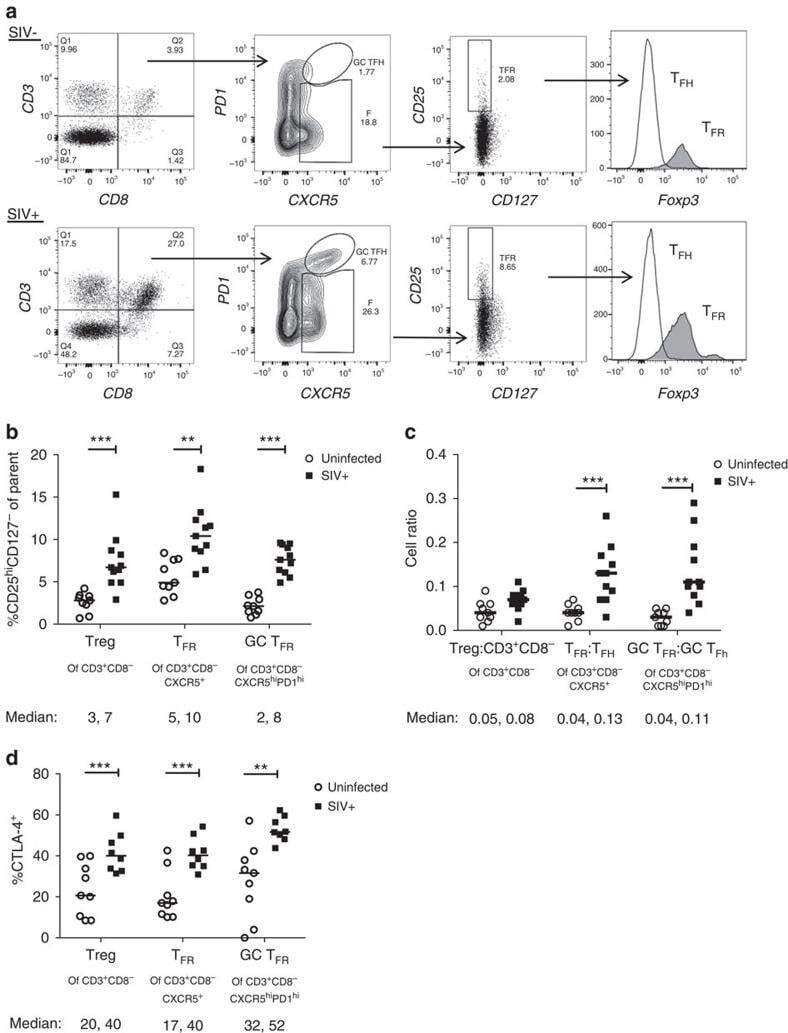
- Figure 2 T FR expansion in lymphoid tissues during chronic SIV infection. ( a ) Disaggregated lymph node and spleen cells from SIV uninfected ( n =9) or chronically SIV-infected rhesus macaques ( n =11) were analysed by flow cytometry. Representative examples of flow cytometry gating are shown. Of viable CD3 + CD8 - cells, follicular subsets were defined as CXCR5 + cells (F) and germinal centre subsets were defined as CXCR5 hi PD-1 hi cells (GC). Of these subsets, regulatory cells were defined as CD25 hi CD127 - . T FR (CXCR5 + CD25 hi CD127 - ) were Foxp3 + , whereas T FH (CXCR5 + CD25 lo/- ) were Foxp3 - . ( b ) The percentages of each rhesus macaque regulatory subset, as analysed in a are shown. ( c ) The ratios of each regulatory cell population to its non-regulatory cell counterpart are shown. ( d ) The percentage of total CTLA-4 expression is shown in SIV-uninfected ( n =9) and chronically SIV-infected ( n =8) rhesus macaques. The horizontal bars of each graph indicate the median value and are listed where appropriate for clarity. Statistical analyses were performed by Mann-Whitney (Wilcoxon) tests to compare unpaired, nonparametric values and significance is denoted by asterisks where * P
- Submitted by
- Invitrogen Antibodies (provider)
- Main image
- Experimental details
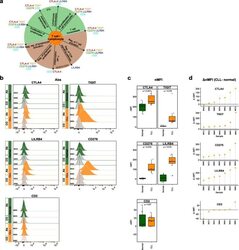
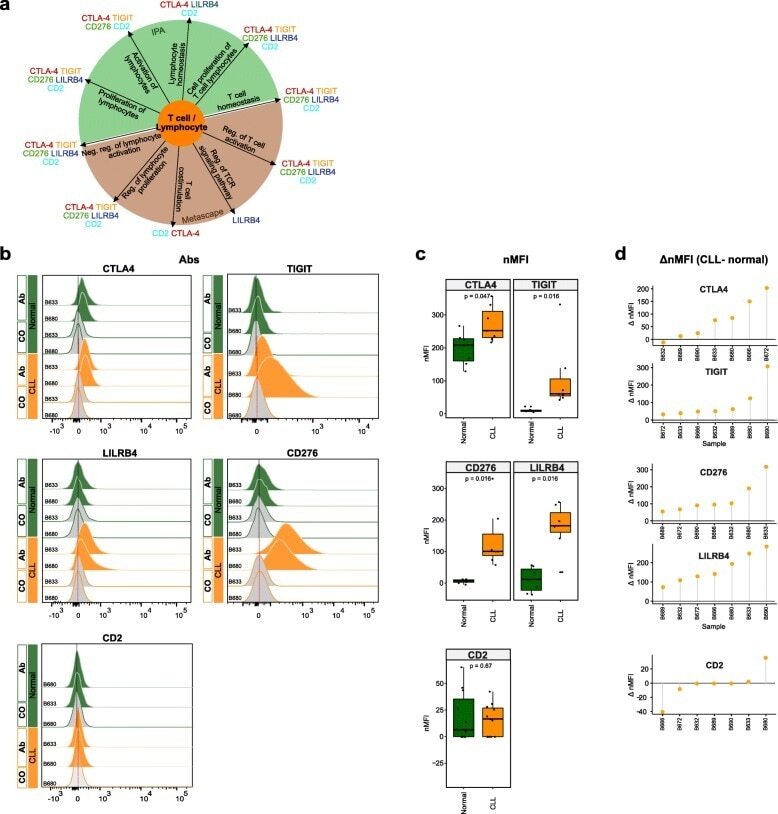
- Fig. 6 Flow cytometry analysis of T cell-/lymphocyte-specific markers on normal and malignant B cells from CLL patients. a Summary scheme representing functional implications of CLL-specific candidate genes selected for flow cytometric analysis. b Flow cytometric analysis of expression of CTLA-4, TIGIT, CD276, LILRB4, and CD2 on peripheral blood B cells of CLL patients. The expression was determined for non-malignant B cells (""Normal""; CD19 + CD5 - B cells, represented in green) and neoplastic B cells (""CLL"", CD19 + CD5 + B cells, represented in orange) detected in the same samples. ""Co,"" no antibody staining control; ""Ab,"" staining with the antibody of interest as indicated. c Normalized median fluorescence intensities (target MFI - MFI of negative control [Co]; nMFI). d Delta normalized median fluorescence intensities between CLL cells and normal B cells (DeltanMFI (CLL-normal)) for each patient tested
- Submitted by
- Invitrogen Antibodies (provider)
- Main image
- Experimental details
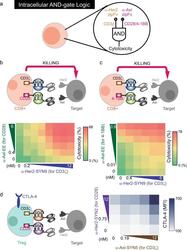
- Fig. 3 The intracellular AND logic with different signaling domains. a Diagram of intracellular AND logic. b Primary human CD8+ T cells were transduced with FOS zipCAR-containing CD3zeta domain and RR zipCAR-containing CD28 domain. Cytotoxicity against Her2- and Axl-expressing Nalm6 was measured 24 h after adding alpha-Her2-SYN9 and/or alpha-Axl-EE zipFvs. The heatmap indicates cytotoxicity at varying zipFv concentrations ( n = 3, data are represented as mean). c Cytotoxicity of CD8+ T cells transduced with FOS zipCAR-containing CD3zeta domain and RR zipCAR-containing 4-1BB domain. The heatmap indicates cytotoxicity at varying zipFv concentrations ( n = 3, data are represented as mean). d (Left) Isolated Treg cells were transduced with two zipCAR constructs: SYN6-CD3zeta-P2A-FOXP3 and SYN1-CD28-P2A-puro. After puromycin selection (2 mug/mL), Treg cells were co-cultured with Her2- and Axl-expressing Nalm6 target cells (Right) The heatmap shows surface CTLA-4 expression detected after 48 h by flow cytometry at varying zipFv concentrations (alpha-Axl-SYN5 and alpha-Her2-SYN2) ( n = 3, data are represented as mean).
