Explore
 Validate
 Learn
Learn Western blot
 ELISA
ELISA Immunocytochemistry
Antibody data
- Antibody Data
- Antigen structure
- References [4]
- Comments [0]
- Validations
- Immunocytochemistry [2]
- Other assay [3]
Submit
Validation data
Reference
Comment
Report error
- Product number
- MA5-15722 - Provider product page

- Provider
- Invitrogen Antibodies
- Product name
- SETDB1 Monoclonal Antibody (5H6A12)
- Antibody type
- Monoclonal
- Antigen
- Purifed from natural sources
- Description
- MA5-15722 targets SETDB1 in indirect ELISA, IF and WB applications and shows reactivity with Human, mouse, and Non-human primate samples. The MA5-15722 immunogen is purified recombinant fragment of human SETDB1 expressed in E. Coli. MA5-15722 detects SETDB1 which has a predicted molecular weight of approximately 180kDa.
- Reactivity
- Human, Mouse
- Host
- Mouse
- Isotype
- IgG
- Antibody clone number
- 5H6A12
- Vial size
- 100 μL
- Concentration
- Conc. Not Determined
- Storage
- Store at 4°C short term. For long term storage, store at -20°C, avoiding freeze/thaw cycles.
Submitted references Complete loss of H3K9 methylation dissolves mouse heterochromatin organization.
Foxd3 controls heterochromatin-mediated repression of repeat elements and 2-cell state transcription.
TRIM28 is an Epigenetic Barrier to Induced Pluripotent Stem Cell Reprogramming.
The methyltransferase SETDB1 regulates a large neuron-specific topological chromatin domain.
Montavon T, Shukeir N, Erikson G, Engist B, Onishi-Seebacher M, Ryan D, Musa Y, Mittler G, Meyer AG, Genoud C, Jenuwein T
Nature communications 2021 Jul 16;12(1):4359
Nature communications 2021 Jul 16;12(1):4359
Foxd3 controls heterochromatin-mediated repression of repeat elements and 2-cell state transcription.
Puri D, Koschorz B, Engist B, Onishi-Seebacher M, Ryan D, Soujanya M, Montavon T
EMBO reports 2021 Dec 6;22(12):e53180
EMBO reports 2021 Dec 6;22(12):e53180
TRIM28 is an Epigenetic Barrier to Induced Pluripotent Stem Cell Reprogramming.
Miles DC, de Vries NA, Gisler S, Lieftink C, Akhtar W, Gogola E, Pawlitzky I, Hulsman D, Tanger E, Koppens M, Beijersbergen RL, van Lohuizen M
Stem cells (Dayton, Ohio) 2017 Jan;35(1):147-157
Stem cells (Dayton, Ohio) 2017 Jan;35(1):147-157
The methyltransferase SETDB1 regulates a large neuron-specific topological chromatin domain.
Jiang Y, Loh YE, Rajarajan P, Hirayama T, Liao W, Kassim BS, Javidfar B, Hartley BJ, Kleofas L, Park RB, Labonte B, Ho SM, Chandrasekaran S, Do C, Ramirez BR, Peter CJ, C W JT, Safaie BM, Morishita H, Roussos P, Nestler EJ, Schaefer A, Tycko B, Brennand KJ, Yagi T, Shen L, Akbarian S
Nature genetics 2017 Aug;49(8):1239-1250
Nature genetics 2017 Aug;49(8):1239-1250
No comments: Submit comment
Supportive validation
- Submitted by
- Invitrogen Antibodies (provider)
- Main image

- Experimental details
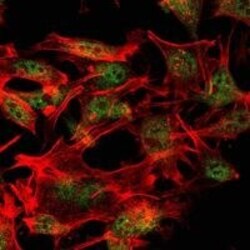
- Immunofluorescence analysis of LOVO cells using SETDB1 monoclonal antibody (Product # MA5-15722) (Green). Red: actin filaments have been labeled with phalloidin.

- Submitted by
- Invitrogen Antibodies (provider)
- Main image
- Experimental details
- Immunofluorescence analysis of LOVO cells using SETDB1 monoclonal antibody (Product # MA5-15722) (Green). Red: actin filaments have been labeled with phalloidin.

Supportive validation
- Submitted by
- Invitrogen Antibodies (provider)
- Main image
- Experimental details
- NULL
- Submitted by
- Invitrogen Antibodies (provider)
- Main image

- Experimental details
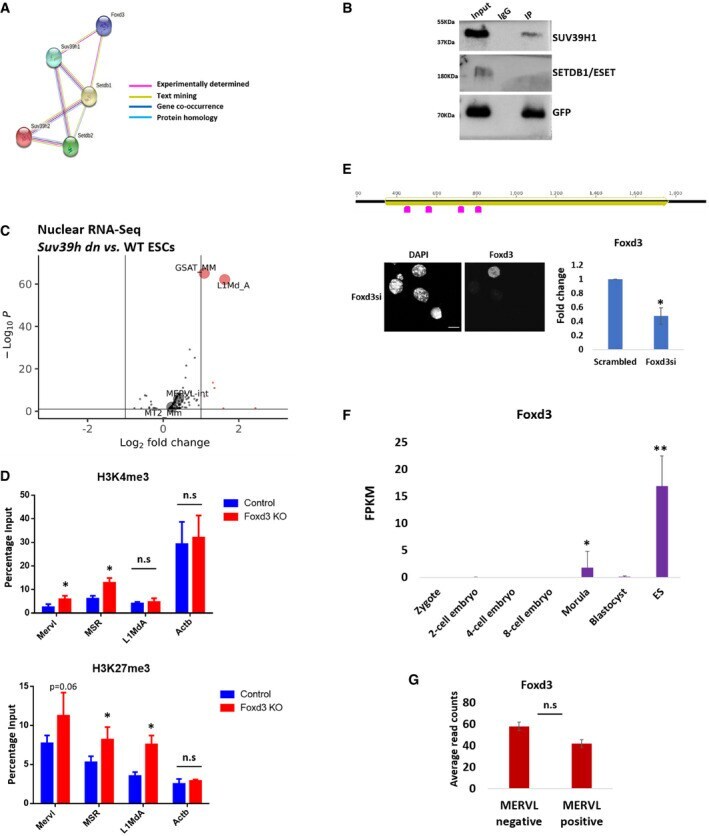
- EV5 Figure Role of FOXD3 in SUV39H1-mediated regulation of MSR and MERVL STRING analysis to predict putative interaction between FOXD3, SUV39H1, SUV39H2, SETDB1 and SETDB2. FOXD3 was significantly predicted to interact with SUV39H1 and SETDB1 ( P -value < 0.01). The criteria used for predicting interaction are depicted. GFP immunoprecipitation analysis using Foxd3 cKO mESCs expressing GFP-FOXD3. Immunoblot results using antibodies against SUV39H1, SETDB1 and GFP are depicted. The experiment was repeated three times using biological replicates. Volcano plot depicting significantly upregulated and downregulated repeats in Suv39h dn ES cells compared with wild-type ES cells determined by RNA-Seq analysis of nuclear RNA. MSR (GSAT_MM), MERVL-int, L1MdA and MT2_Mm are labelled. ChIP-qPCR depicting enrichment of H3K4me3 (top panel) and H3K27me3 (bottom panel) over MERVL, MSR and L1MdA in control and Foxd3 KO cells. Actb promoter is used as negative control. Data are represented as average percentage input of 3 biological replicates. Error bars represent SEM (* P < 0.05 paired t -test). Schematic depicting the location of Foxd3 siRNAs (pink) along the Foxd3 locus (upper panel). Immunofluorescence detected by FOXD3 antibody in Foxd3i cells. Nuclei are stained with DAPI. Scale bar = 10 mum (lower left). RT-qPCR analysis of Foxd3 expression in control and Foxd3i cells. Data are represented as fold change compared with control (scrambled) after normalisation to Gapdh . N = 3 biological

- Submitted by
- Invitrogen Antibodies (provider)
- Main image

- Experimental details
- Figure EV5 Role of FOXD3 in SUV39H1-mediated regulation of MSR and MERVL STRING analysis to predict putative interaction between FOXD3, SUV39H1, SUV39H2, SETDB1 and SETDB2. FOXD3 was significantly predicted to interact with SUV39H1 and SETDB1 ( P -value < 0.01). The criteria used for predicting interaction are depicted. GFP immunoprecipitation analysis using Foxd3 cKO mESCs expressing GFP-FOXD3. Immunoblot results using antibodies against SUV39H1, SETDB1 and GFP are depicted. The experiment was repeated three times using biological replicates. Volcano plot depicting significantly upregulated and downregulated repeats in Suv39h dn ES cells compared with wild-type ES cells determined by RNA-Seq analysis of nuclear RNA. MSR (GSAT_MM), MERVL-int, L1MdA and MT2_Mm are labelled. ChIP-qPCR depicting enrichment of H3K4me3 (top panel) and H3K27me3 (bottom panel) over MERVL, MSR and L1MdA in control and Foxd3 KO cells. Actb promoter is used as negative control. Data are represented as average percentage input of 3 biological replicates. Error bars represent SEM (* P < 0.05 paired t -test). Schematic depicting the location of Foxd3 siRNAs (pink) along the Foxd3 locus (upper panel). Immunofluorescence detected by FOXD3 antibody in Foxd3i cells. Nuclei are stained with DAPI. Scale bar = 10 mum (lower left). RT-qPCR analysis of Foxd3 expression in control and Foxd3i cells. Data are represented as fold change compared with control (scrambled) after normalisation to Gapdh . N = 3 biological