Explore
 Validate
 Learn
Learn Western blot
Antibody data
- Antibody Data
- Antigen structure
- References [2]
- Comments [0]
- Validations
- Western blot [2]
- Immunohistochemistry [1]
- Flow cytometry [1]
- Other assay [2]
Submit
Validation data
Reference
Comment
Report error
- Product number
- PA5-72554 - Provider product page

- Provider
- Invitrogen Antibodies
- Product name
- ATF6 Polyclonal Antibody
- Antibody type
- Polyclonal
- Antigen
- Synthetic peptide
- Reactivity
- Human
- Host
- Rabbit
- Isotype
- IgG
- Vial size
- 400 µL
- Concentration
- 0.4 mg/mL
- Storage
- Store at 4°C short term. For long term storage, store at -20°C, avoiding freeze/thaw cycles.
Submitted references SDF4 Is a Prognostic Factor for 28-Days Mortality in Patients With Sepsis via Negatively Regulating ER Stress.
Enhancing calmodulin binding to ryanodine receptor is crucial to limit neuronal cell loss in Alzheimer disease.
Zhu T, Su Q, Wang C, Shen L, Chen H, Feng S, Peng X, Chen S, Wang Y, Jiang H, Chen J
Frontiers in immunology 2021;12:659193
Frontiers in immunology 2021;12:659193
Enhancing calmodulin binding to ryanodine receptor is crucial to limit neuronal cell loss in Alzheimer disease.
Nakamura Y, Yamamoto T, Xu X, Kobayashi S, Tanaka S, Tamitani M, Saito T, Saido TC, Yano M
Scientific reports 2021 Mar 31;11(1):7289
Scientific reports 2021 Mar 31;11(1):7289
No comments: Submit comment
Supportive validation
- Submitted by
- Invitrogen Antibodies (provider)
- Main image

- Experimental details
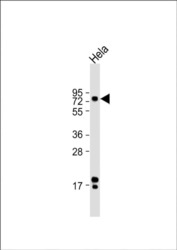
- Western blot analysis of ATF6 in A2058 cell lysate using 35 µg of protein per lane. Samples were incubated with ATF6 polyclonal antibody (Product # PA5-72554).

- Submitted by
- Invitrogen Antibodies (provider)
- Main image
- Experimental details
- Western blot analysis of ATF6 in A2058 cell lysate using 35 µg of protein per lane. Samples were incubated with ATF6 polyclonal antibody (Product # PA5-72554).

Supportive validation
- Submitted by
- Invitrogen Antibodies (provider)
- Main image

- Experimental details
- Immunohistochemical analysis of ATF6 in paraffin-embedded human brain tissue. Samples were incubated with ATF6 polyclonal antibody (Product # PA5-72554) followed by a peroxidase-conjugate secondary antibody and DAB staining.

Supportive validation
- Submitted by
- Invitrogen Antibodies (provider)
- Main image
- Experimental details
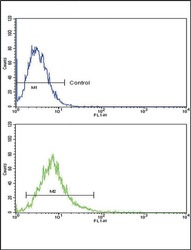
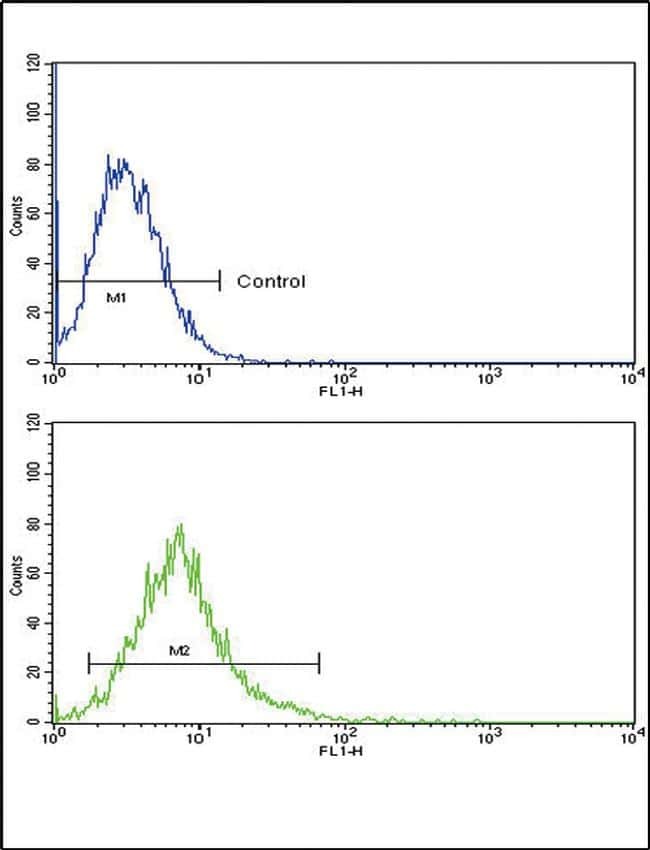
- Flow cytometry analysis of ATF6 in k562 cells (bottom histogram) compared to a negative control cell (top histogram). Samples were incubated with ATF6 polyclonal antibody (Product # PA5-72554) followed by a FITC conjugated goat anti-rabbit secondary antibody.
Supportive validation
- Submitted by
- Invitrogen Antibodies (provider)
- Main image

- Experimental details
- Figure 5 (A) Kyoto Encyclopedia of Genes and Genomes (KEGG) enrichment analysis of DEGs (p < 0.05). (B) Representative TEM picture in survival and death. (C) Representative photomicrographs showing SDF4 (green), DAPI (blue) and their merged images (original magnification x400). Scale bar, 100um. (D) GRP78 expression in survival (n=68) compared with death (n=21) in cohort. (E) Pearson correlation analysis between the expression level of GRP78 and SDF4 in cohort. (F) Pearson correlation analysis between the expression level of ATF6 and SDF4 in cohort. (G) Representative histograms of CHOP expression among survival and death in flow cytometry. (H) Mean fluorescence intensity of CHOP in survival (n=54) and death (n=19). (I) Representative histograms of ATF6 expression among survival and death in flow cytometry. (J) Mean fluorescence intensity of ATF6 in survival and death. (K) Representative histograms of GRP78 expression among survival and death in flow cytometry. (L) Mean fluorescence intensity of GRP78 in survival and death. (M) Representative photomicrographs showing CHOP (red), DAPI (blue) and their merged images (original magnification x400). Scale bar, 100um. (N) Representative photomicrographs showing ATF6 (green), DAPI (blue) and their merged images (original magnification x400). (O) Representative photomicrographs showing GRP78 (red), DAPI (blue) and their merged images (original magnification x400). ***p < 0.001, **p < 0.01, *p < 0.05.

- Submitted by
- Invitrogen Antibodies (provider)
- Main image
- Experimental details
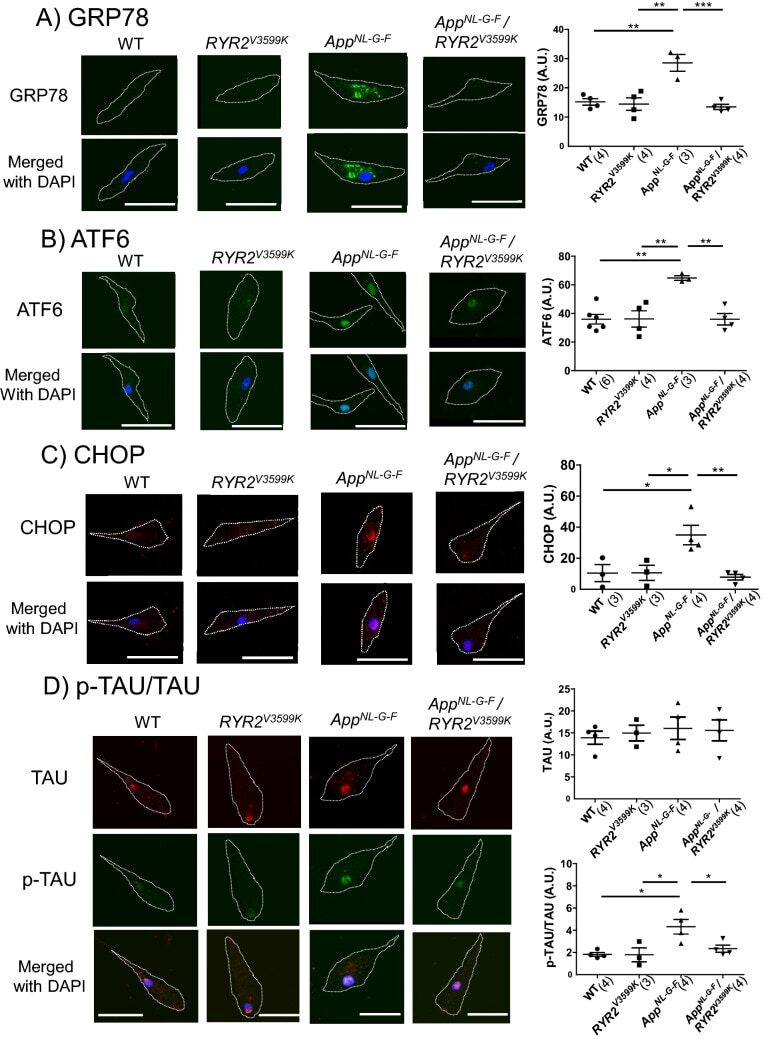
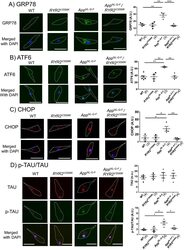
- Figure 2 Protein expression of ER stress markers, TAU and p-TAU in WT, App NL-G-F , RYR2 V3599K , and App NL-G-F / RYR2 V3599K incubated neuronal cells. Representative images of ( A ) GRP78, ( B ) ATF6, ( C ) CHOP, ( D ) TAU/p-TAU obtained from single cells, and the summarized data. Merged images with DAPI staining are also shown. p-TAU was expressed as the ratio to total TAU. Cell shapes are indicated by dotted lines. Values for individual mice are plotted together with mean +- SEM. Scale bars: 30 mum. N = 20-33 cells from 3 to 6 mice. Parentheses indicate the number of mice. * p < 0.05, ** p < 0.01, *** p < 0.001 (one-way ANOVA with post-hoc Tukey's multiple comparison test).