Explore
 Validate
 Learn
Learn Western blot
 Immunocytochemistry
Antibody data
- Antibody Data
- Antigen structure
- References [1]
- Comments [0]
- Validations
- Immunocytochemistry [5]
- Immunohistochemistry [2]
- Other assay [2]
Submit
Validation data
Reference
Comment
Report error
- Product number
- PA5-78290 - Provider product page

- Provider
- Invitrogen Antibodies
- Product name
- ROCK2 Polyclonal Antibody
- Antibody type
- Polyclonal
- Antigen
- Recombinant full-length protein
- Description
- Positive Control: 293T, A431, HeLa, HepG2, Rat2, Neuro 2A, GL261, C8D30, NIH-3T3, BCL-1, Raw264.7, C2C12, A549, H1299, HCT116 Predicted Reactivity: Xenopus laevis (80%), Rhesus Monkey (100%), Bovine (97%) Store product as a concentrated solution. Centrifuge briefly prior to opening the vial.
- Reactivity
- Human, Mouse, Rat
- Host
- Rabbit
- Isotype
- IgG
- Vial size
- 100 μL
- Concentration
- 0.4 mg/mL
- Storage
- Store at 4°C short term. For long term storage, store at -20°C, avoiding freeze/thaw cycles.
Submitted references Lamin A and the LINC complex act as potential tumor suppressors in Ewing Sarcoma.
Chiarini F, Paganelli F, Balestra T, Capanni C, Fazio A, Manara MC, Landuzzi L, Petrini S, Evangelisti C, Lollini PL, Martelli AM, Lattanzi G, Scotlandi K
Cell death & disease 2022 Apr 14;13(4):346
Cell death & disease 2022 Apr 14;13(4):346
No comments: Submit comment
Supportive validation
- Submitted by
- Invitrogen Antibodies (provider)
- Main image
- Experimental details
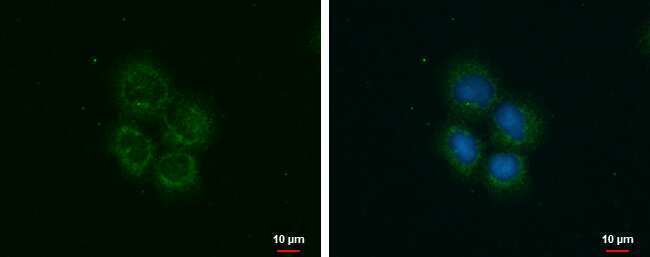
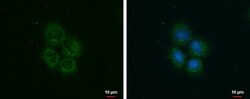
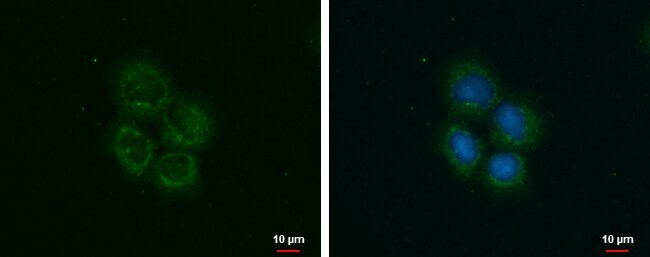
- ROCK2 Polyclonal Antibody detects ROCK2 protein at cytoplasm by immunofluorescent analysis. Sample: A431 cells were fixed in ice-cold MeOH for 5 min. Green: ROCK2 protein stained by ROCK2 Polyclonal Antibody (Product # PA5-78290) diluted at 1:500. Blue: Hoechst 33342 staining.
- Submitted by
- Invitrogen Antibodies (provider)
- Main image
- Experimental details
- ROCK2 Polyclonal Antibody detects ROCK2 protein at cytoplasm by immunofluorescent analysis. Sample: A431 cells were fixed in ice-cold MeOH for 5 min. Green: ROCK2 protein stained by ROCK2 Polyclonal Antibody (Product # PA5-78290) diluted at 1:500. Blue: Hoechst 33342 staining.
- Submitted by
- Invitrogen Antibodies (provider)
- Main image

- Experimental details
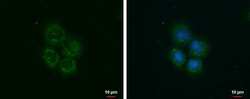
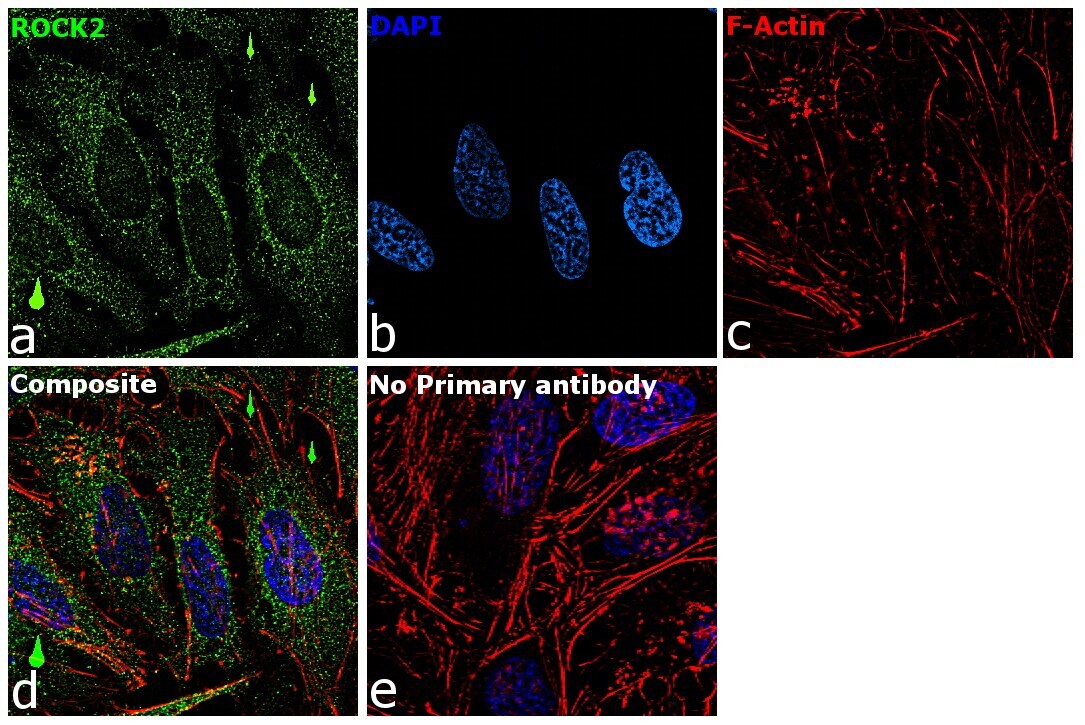
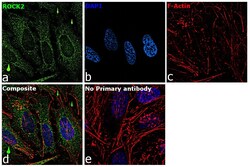
- Immunofluorescence analysis of ROCK2 was performed using 70% confluent log phase HeLa cells. The cells were fixed with 4% paraformaldehyde for 10 minutes, permeabilized with 0.1% Triton™ X-100 for 15 minutes, and blocked with 2% BSA for 1 hour at room temperature. The cells were labeled with ROCK2 Rabbit Polyclonal Antibody (Product # PA5-78290) at 5 µg/mL in 0.1% BSA, incubated at 4 degree Celsius overnight and then with Goat anti-Rabbit IgG (H+L) Highly Cross-Adsorbed Secondary Antibody, Alexa Fluor Plus 488 (Product # A32731) at a dilution of 1:2000 for 45 minutes at room temperature (Panel a: green). Nuclei (Panel b: blue) were stained with ProLong™ Diamond Antifade Mountant with DAPI (Product # P36962). F-actin (Panel c: red) was stained with Rhodamine Phalloidin (Product # R415, 1:300). Panel d represents the merged image showing cytoplasmic localization. Panel e represents control cells with no primary antibody to assess background. The images were captured at 60X magnification.
- Submitted by
- Invitrogen Antibodies (provider)
- Main image

- Experimental details
- ROCK2 Polyclonal Antibody detects ROCK2 protein at cytoplasm by immunofluorescent analysis. Sample: A431 cells were fixed in ice-cold MeOH for 5 min. Green: ROCK2 protein stained by ROCK2 Polyclonal Antibody (Product # PA5-78290) diluted at 1:500. Blue: Hoechst 33342 staining.

- Submitted by
- Invitrogen Antibodies (provider)
- Main image
- Experimental details
- Immunofluorescence analysis of ROCK2 was performed using 70% confluent log phase HeLa cells. The cells were fixed with 4% paraformaldehyde for 10 minutes, permeabilized with 0.1% Triton™ X-100 for 15 minutes, and blocked with 2% BSA for 1 hour at room temperature. The cells were labeled with ROCK2 Rabbit Polyclonal Antibody (Product # PA5-78290) at 5 µg/mL in 0.1% BSA, incubated at 4 degree Celsius overnight and then with Goat anti-Rabbit IgG (H+L) Highly Cross-Adsorbed Secondary Antibody, Alexa Fluor Plus 488 (Product # A32731) at a dilution of 1:2000 for 45 minutes at room temperature (Panel a: green). Nuclei (Panel b: blue) were stained with ProLong™ Diamond Antifade Mountant with DAPI (Product # P36962). F-actin (Panel c: red) was stained with Rhodamine Phalloidin (Product # R415, 1:300). Panel d represents the merged image showing cytoplasmic localization. Panel e represents control cells with no primary antibody to assess background. The images were captured at 60X magnification.

Supportive validation
- Submitted by
- Invitrogen Antibodies (provider)
- Main image
- Experimental details
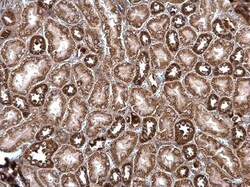
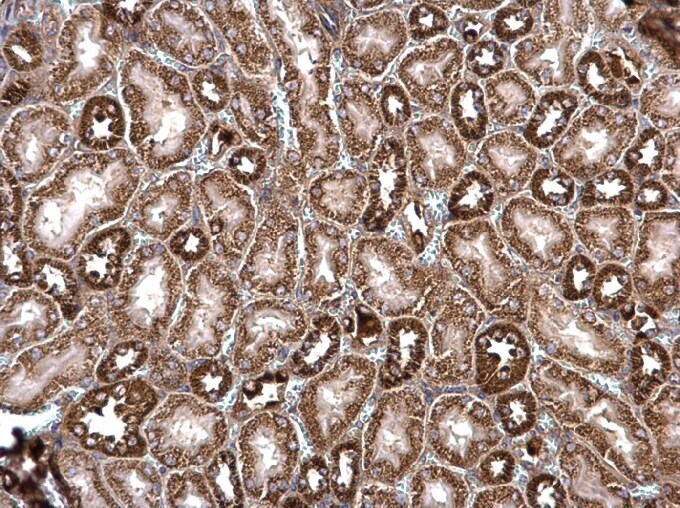
- ROCK2 Polyclonal Antibody detects ROCK2 protein at cytosol on mouse kidney by immunohistochemical analysis. Sample: Paraffin-embedded mouse kidney. ROCK2 Polyclonal Antibody (Product # PA5-78290) dilution: 1:500. Antigen Retrieval: EDTA based buffer, pH 8.0, 15 min.
- Submitted by
- Invitrogen Antibodies (provider)
- Main image
- Experimental details
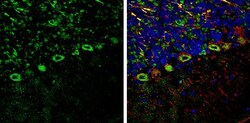
- ROCK2 Polyclonal Antibody detects ROCK2 protein expression by immunohistochemical analysis. Sample: Frozen-sectioned adult mouse cerebellum. Green: ROCK2 protein stained by ROCK2 Polyclonal Antibody (Product # PA5-78290) diluted at 1:250. Red: NF-H, stained by NF-H antibody [GT114] diluted at 1:500. Blue: Fluoroshield with DAPI . Antigen Retrieval: Citrate buffer, pH 6.0, 10 min.
Supportive validation
- Submitted by
- Invitrogen Antibodies (provider)
- Main image
- Experimental details
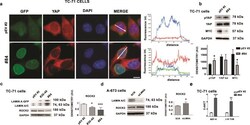
- The expression of lamin A affects YAP and ROCK2 activity and stimulates neural differentiation in EWS cells. a Lamin A-GFP (green) and YAP (red) localization in Empty-GFP clone (pEV #2) and lamin A-GFP #84 (#84). DNA was counterstained with DAPI (DAPI). Merge of fluorescence signals are shown (MERGE). Graphs indicate the fluorescence intensity profile along the white arrows. Representative graphs of at least 30 nuclei analyzed for each sample were shown; magnification 100x, scale bar 10 mum; b Western blotting analysis of YAP, p(Ser127) YAP and MYC protein expression in Empty-GFP clone (pEV #2) and lamin A-GFP #84 (#84). GAPDH was used as loading control. Densitometric analysis is shown as mean values +- SD of three different experiments. Asterisks indicate statistically significant differences with respect to Empty-GFP clone; two-tailed unpaired Student's t-test, * p < 0.05; c Western blotting analyses of lamin A/C and ROCK2 protein expression in Empty-GFP clone (pEV #2), lamin A-GFP #30-40 (#30-40) and lamin A-GFP #84 (#84). GAPDH was used as loading control. Densitometric analysis is shown as mean values +- SD of three different experiments. Asterisks indicate statistically significant differences with respect to Empty-GFP clone; one-way ANOVA test, * p < 0.05, *** p < 0.001; d Western blotting analysis of lamin A/C and ROCK2 protein expression in siRNA scramble cells (SCR) and siLMNA A-673 ( siLMNA ). GAPDH was used as loading control. Densitometric analysis is shown as m

- Submitted by
- Invitrogen Antibodies (provider)
- Main image

- Experimental details
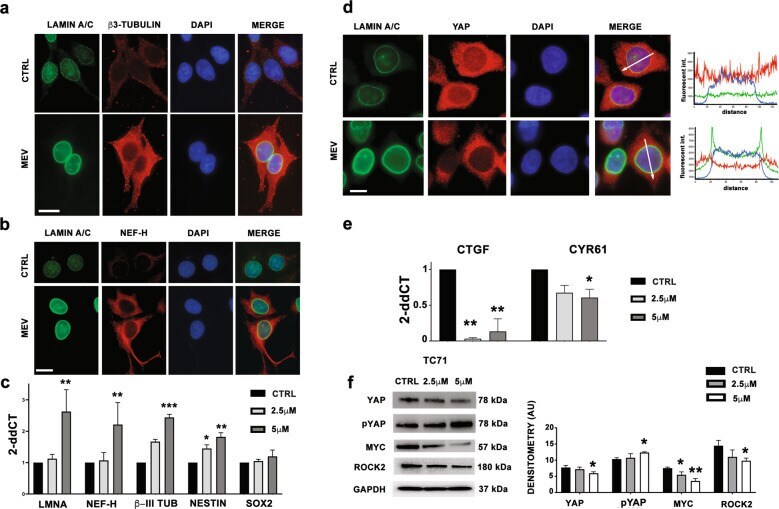
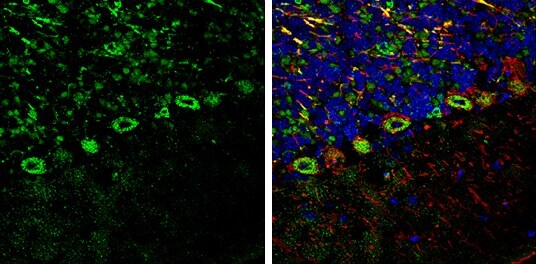
- Mevinolin induces neural differentiation and rescues YAP and ROCK2 dynamics in EWS cells. a Lamin A/C (green) and beta3-tubulin (red) localization in non-treated TC-71 cells (CTRL) and in mevinolin treated (5 muM) EWS cells (MEV). DNA was counterstained with DAPI (DAPI). Merge of fluorescence signals are shown (MERGE); magnification 100x, scale bar 10 mum; b Lamin A/C (green) and neurofilament-H (NEF-H) (red) localization in non-treated TC-71 cells (CTRL) and in mevinolin treated (5 muM) EWS cells (MEV). DNA was counterstained with DAPI (DAPI). Merge of fluorescence signals are shown (MERGE); magnification 100x, scale bar 10 mum; c qRT-PCR analysis of LMNA , NEF-H , beta3-tubulin, nestin and SOX2 genes in untreated TC-71 cells (CTRL) and in mevinolin treated EWS cells (2.5 muM or 5muM MEV). Data are shown as 2- DeltaDelta Ct . GAPDH was used as a housekeeping gene. Data are shown as mean values +- SD of three different experiments. Asterisks indicate statistically significant differences with respect to CTRL cells; one-way ANOVA test, * p < 0.05, ** p < 0.01, *** p < 0.001; d Lamin A/C (green) and YAP (red) localization in non-treated TC-71 cells (CTRL) and in mevinolin treated (5 muM) EWS cells (MEV). DNA was counterstained with DAPI (DAPI). Merge of fluorescence signals are shown (MERGE). Graphs indicate the fluorescence intensity profile along the white arrows. Representative graphs of at least 30 nuclei analyzed for each sample were shown; magnification 100x, scale bar 10