Explore
 Validate
 Learn
Learn17-5983-41
antibody from Invitrogen Antibodies
Targeting: CD274
B7-H, B7-H1, B7H1, PD-L1, PDCD1LG1, PDL1
 Flow cytometry
Antibody data
- Antibody Data
- Antigen structure
- References [46]
- Comments [0]
- Validations
- Flow cytometry [2]
- Other assay [37]
Submit
Validation data
Reference
Comment
Report error
- Product number
- 17-5983-41 - Provider product page

- Provider
- Invitrogen Antibodies
- Product name
- CD274 (PD-L1, B7-H1) Monoclonal Antibody (MIH1), APC, eBioscience™
- Antibody type
- Monoclonal
- Antigen
- Other
- Description
- Description: The MIH1 monoclonal antibody reacts with human B7-H1, also known as PD-L1. B7-H1, a member of the B7 family, has a predicted molecular weight of approximately 40 kDa and belongs to the Ig superfamily. B7-H1 is expressed on a majority of leukocytes. B7-H1 is a ligand for PD-1. Interaction of PD-1 with either PD-L1 (B7-H1) or PD-L2 (B7-DC) results in inhibition of T and B cell responses. MIH1 is reported to be a blocking antibody. Applications Reported: This MIH1 antibody has been reported for use in flow cytometric analysis. Applications Tested: This MIH1 antibody has been pre-titrated and tested by flow cytometric analysis of normal human peripheral blood cells. This can be used at 5 µL (0.5 µg) per test. A test is defined as the amount (µg) of antibody that will stain a cell sample in a final volume of 100 µL. Cell number should be determined empirically but can range from 10^5 to 10^8 cells/test. Excitation: 633-647 nm; Emission: 660 nm; Laser: Red Laser. Filtration: 0.2 µm post-manufacturing filtered.
- Reactivity
- Human
- Host
- Mouse
- Isotype
- IgG
- Antibody clone number
- MIH1
- Vial size
- 25 Tests
- Concentration
- 5 µL/Test
- Storage
- 4°C, store in dark, DO NOT FREEZE!
Submitted references A secondary role for hypoxia and HIF1 in the regulation of (IFNγ-induced) PD-L1 expression in melanoma.
Bispecific T-Cell Engaging Antibodies Against MUC16 Demonstrate Efficacy Against Ovarian Cancer in Monotherapy and in Combination With PD-1 and VEGF Inhibition.
T cells drive negative feedback mechanisms in cancer associated fibroblasts, promoting expression of co-inhibitory ligands, CD73 and IL-27 in non-small cell lung cancer.
CRISPR Screening of CAR T Cells and Cancer Stem Cells Reveals Critical Dependencies for Cell-Based Therapies.
LSD1 silencing contributes to enhanced efficacy of anti-CD47/PD-L1 immunotherapy in cervical cancer.
The Immunostimulative Effect and Mechanisms of a Novel Mouse Anti-Human PD-1 Monoclonal Antibody on Jurkat Lymphocytic Cells Cocultured with Hepatoma Cells.
Activate: Randomized Clinical Trial of BCG Vaccination against Infection in the Elderly.
HGF-Induced PD-L1 Expression in Head and Neck Cancer: Preclinical and Clinical Findings.
Multidimensional analyses of proinsulin peptide-specific regulatory T cells induced by tolerogenic dendritic cells.
CD44 Promotes PD-L1 Expression and Its Tumor-Intrinsic Function in Breast and Lung Cancers.
Synergistic inhibition of pancreatic cancer with anti-PD-L1 and c-Myc inhibitor JQ1.
CA-170 - A Potent Small-Molecule PD-L1 Inhibitor or Not?
Disruption of PD-1 Enhanced the Anti-tumor Activity of Chimeric Antigen Receptor T Cells Against Hepatocellular Carcinoma.
Generation of Tumor-Reactive T Cells by Co-culture of Peripheral Blood Lymphocytes and Tumor Organoids.
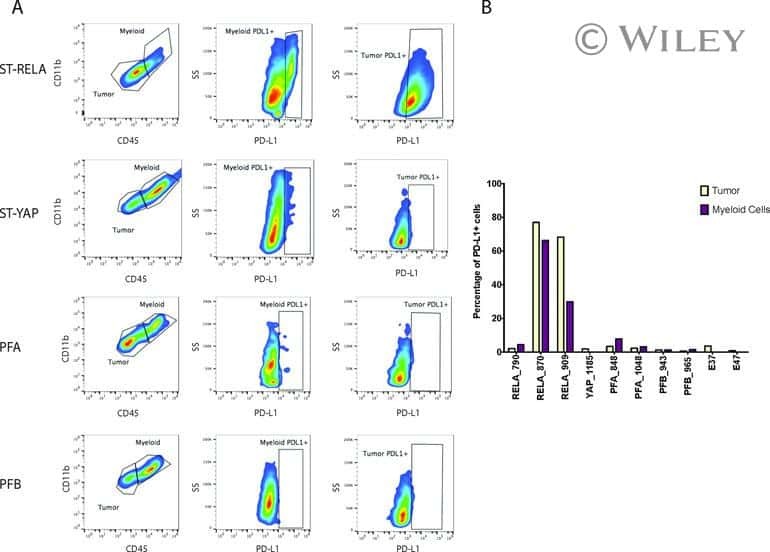
Specific expression of PD-L1 in RELA-fusion supratentorial ependymoma: Implications for PD-1-targeted therapy.
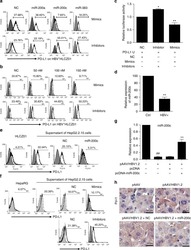
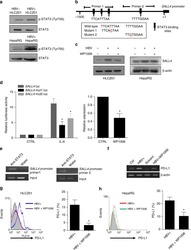
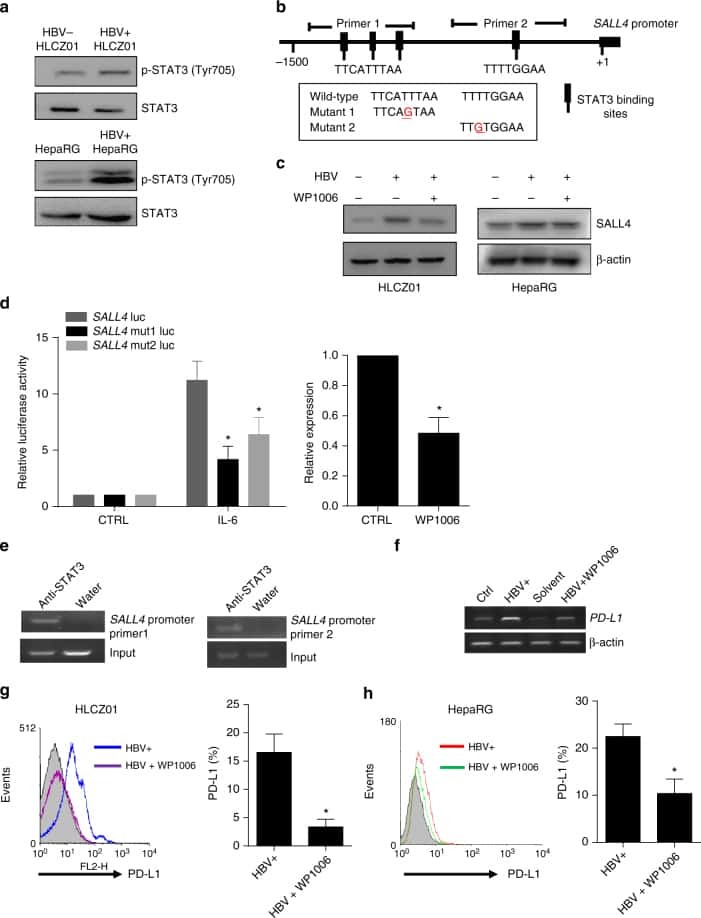
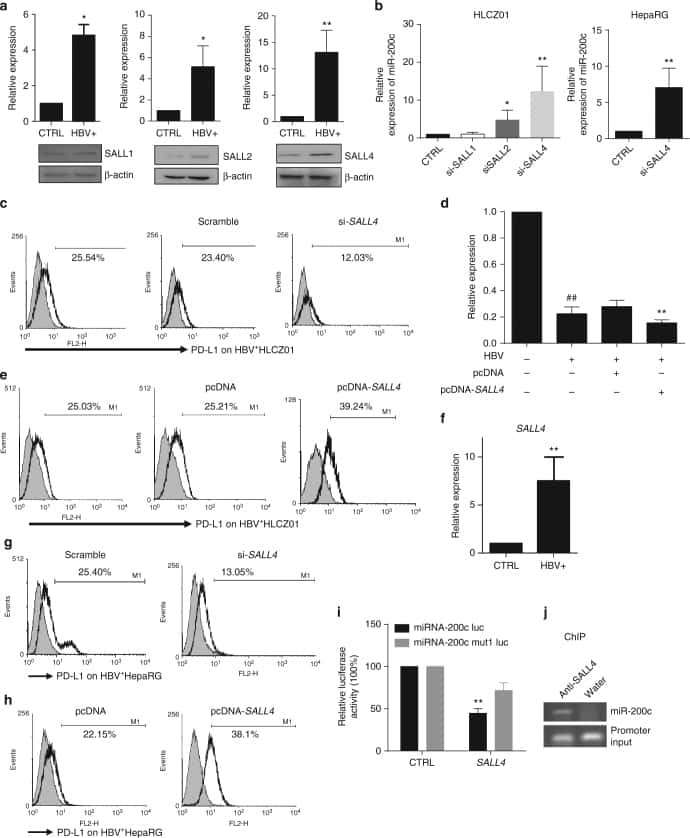
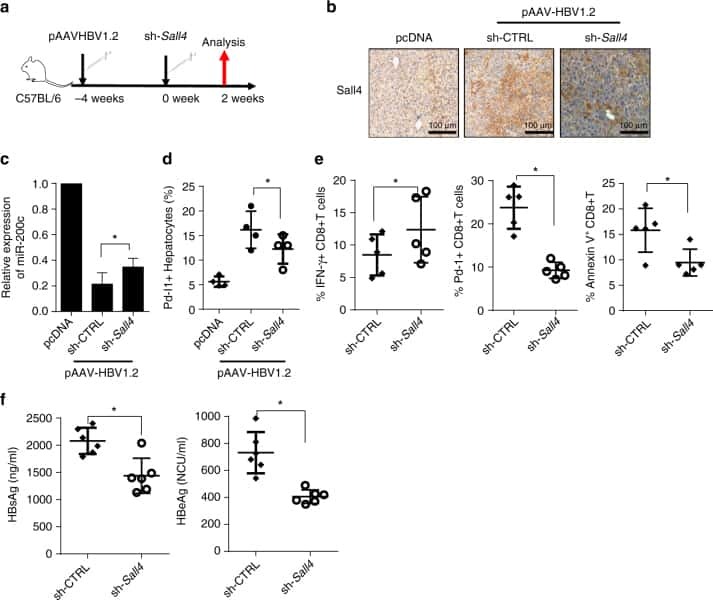
Oncofetal gene SALL4 reactivation by hepatitis B virus counteracts miR-200c in PD-L1-induced T cell exhaustion.
Antigen-Presenting Cell-Intrinsic PD-1 Neutralizes PD-L1 in cis to Attenuate PD-1 Signaling in T Cells.
PD-1 axis expression in musculoskeletal tumors and antitumor effect of nivolumab in osteosarcoma model of humanized mouse.
Similarities and differences between helminth parasites and cancer cell lines in shaping human monocytes: Insights into parallel mechanisms of immune evasion.
PD-L1 expression in medulloblastoma: an evaluation by subgroup.
Amplification of N-Myc is associated with a T-cell-poor microenvironment in metastatic neuroblastoma restraining interferon pathway activity and chemokine expression.
Mesenchymal Stromal Cell Secretion of Programmed Death-1 Ligands Regulates T Cell Mediated Immunosuppression.
Retroviral Replicating Vector Delivery of miR-PDL1 Inhibits Immune Checkpoint PDL1 and Enhances Immune Responses In Vitro.
Oncolytic Adenovirus and Tumor-Targeting Immune Modulatory Therapy Improve Autologous Cancer Vaccination.
Oncogenic RAS Signaling Promotes Tumor Immunoresistance by Stabilizing PD-L1 mRNA.
PD-L1/PD-1 expression and tumor-infiltrating lymphocytes in conjunctival melanoma.
Correlation of PD-L1 Surface Expression on Leukemia Cells with the Ratio of PD-L1 mRNA Variants and with Electrophoretic Mobility.
Expression of programmed death 1 ligand 1 on periodontal tissue cells as a possible protective feedback mechanism against periodontal tissue destruction.
CD28 family of receptors on T cells in chronic HBV infection: Expression characteristics, clinical significance and correlations with PD-1 blockade.
Human CAR T cells with cell-intrinsic PD-1 checkpoint blockade resist tumor-mediated inhibition.
Vitamin D regulates cytokine patterns secreted by dendritic cells to promote differentiation of IL-22-producing T cells.
Impact of Diverse Immune Evasion Mechanisms of Cancer Cells on T Cells Engaged by EpCAM/CD3-Bispecific Antibody Construct AMG 110.
PDL1 Expression on Plasma and Dendritic Cells in Myeloma Bone Marrow Suggests Benefit of Targeted anti PD1-PDL1 Therapy.
Interleukin-25 Mediates Transcriptional Control of PD-L1 via STAT3 in Multipotent Human Mesenchymal Stromal Cells (hMSCs) to Suppress Th17 Responses.
High and interrelated rates of PD-L1+CD14+ antigen-presenting cells and regulatory T cells mark the microenvironment of metastatic lymph nodes from patients with cervical cancer.
Paucity of PD-L1 expression in prostate cancer: innate and adaptive immune resistance.
IL-27 induces the expression of IDO and PD-L1 in human cancer cells.
HIV-1 Tat protein induces PD-L1 (B7-H1) expression on dendritic cells through tumor necrosis factor alpha- and toll-like receptor 4-mediated mechanisms.
Upregulation of programmed death-1 on T cells and programmed death ligand-1 on monocytes in septic shock patients.
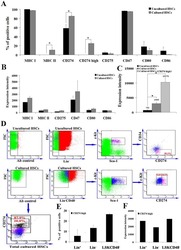
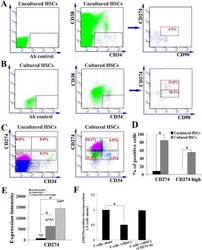
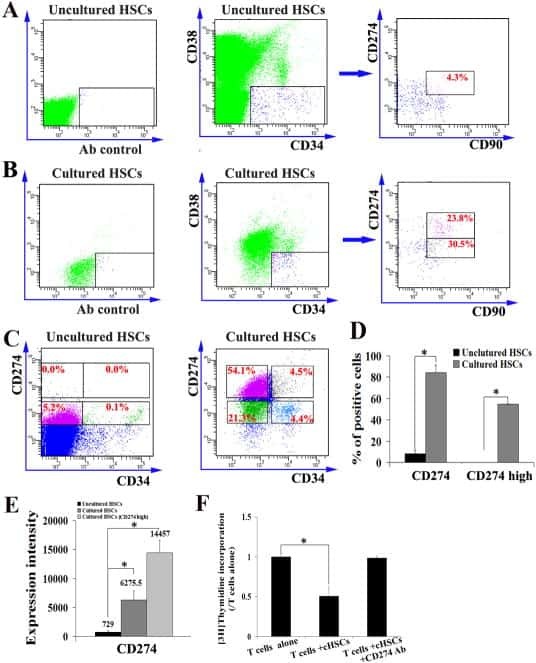
Ex vivo expanded hematopoietic stem cells overcome the MHC barrier in allogeneic transplantation.
The PD-1/PD-L1 axis modulates the natural killer cell versus multiple myeloma effect: a therapeutic target for CT-011, a novel monoclonal anti-PD-1 antibody.
Major depletion of plasmacytoid dendritic cells in HIV-2 infection, an attenuated form of HIV disease.
Regulatory T cell (Treg) subsets return in patients with refractory lupus following stem cell transplantation, and TGF-beta-producing CD8+ Treg cells are associated with immunological remission of lupus.
PD-1 is a regulator of NY-ESO-1-specific CD8+ T cell expansion in melanoma patients.
Expression of B7-H1 in inflammatory renal tubular epithelial cells.
Clinical significance of programmed death-1 ligand-1 and programmed death-1 ligand-2 expression in human esophageal cancer.
van Duijn A, Willemsen KJ, van Uden NOP, Hoyng L, Erades S, Koster J, Luiten RM, Bakker WJ
Cancer immunology, immunotherapy : CII 2022 Mar;71(3):529-540
Cancer immunology, immunotherapy : CII 2022 Mar;71(3):529-540
Bispecific T-Cell Engaging Antibodies Against MUC16 Demonstrate Efficacy Against Ovarian Cancer in Monotherapy and in Combination With PD-1 and VEGF Inhibition.
Yeku OO, Rao TD, Laster I, Kononenko A, Purdon TJ, Wang P, Cui Z, Liu H, Brentjens RJ, Spriggs D
Frontiers in immunology 2021;12:663379
Frontiers in immunology 2021;12:663379
T cells drive negative feedback mechanisms in cancer associated fibroblasts, promoting expression of co-inhibitory ligands, CD73 and IL-27 in non-small cell lung cancer.
O'Connor RA, Chauhan V, Mathieson L, Titmarsh H, Koppensteiner L, Young I, Tagliavini G, Dorward DA, Prost S, Dhaliwal K, Wallace WA, Akram AR
Oncoimmunology 2021;10(1):1940675
Oncoimmunology 2021;10(1):1940675
CRISPR Screening of CAR T Cells and Cancer Stem Cells Reveals Critical Dependencies for Cell-Based Therapies.
Wang D, Prager BC, Gimple RC, Aguilar B, Alizadeh D, Tang H, Lv D, Starr R, Brito A, Wu Q, Kim LJY, Qiu Z, Lin P, Lorenzini MH, Badie B, Forman SJ, Xie Q, Brown CE, Rich JN
Cancer discovery 2021 May;11(5):1192-1211
Cancer discovery 2021 May;11(5):1192-1211
LSD1 silencing contributes to enhanced efficacy of anti-CD47/PD-L1 immunotherapy in cervical cancer.
Xu S, Wang X, Yang Y, Li Y, Wu S
Cell death & disease 2021 Mar 17;12(4):282
Cell death & disease 2021 Mar 17;12(4):282
The Immunostimulative Effect and Mechanisms of a Novel Mouse Anti-Human PD-1 Monoclonal Antibody on Jurkat Lymphocytic Cells Cocultured with Hepatoma Cells.
Li Z, Li B, Li L, Wang G, Li Y, Fu R, Ming Y, Ni R, Wang J, Ye G, Chen J
OncoTargets and therapy 2020;13:12225-12241
OncoTargets and therapy 2020;13:12225-12241
Activate: Randomized Clinical Trial of BCG Vaccination against Infection in the Elderly.
Giamarellos-Bourboulis EJ, Tsilika M, Moorlag S, Antonakos N, Kotsaki A, Domínguez-Andrés J, Kyriazopoulou E, Gkavogianni T, Adami ME, Damoraki G, Koufargyris P, Karageorgos A, Bolanou A, Koenen H, van Crevel R, Droggiti DI, Renieris G, Papadopoulos A, Netea MG
Cell 2020 Oct 15;183(2):315-323.e9
Cell 2020 Oct 15;183(2):315-323.e9
HGF-Induced PD-L1 Expression in Head and Neck Cancer: Preclinical and Clinical Findings.
Boschert V, Teusch J, Aljasem A, Schmucker P, Klenk N, Straub A, Bittrich M, Seher A, Linz C, Müller-Richter UDA, Hartmann S
International journal of molecular sciences 2020 Nov 20;21(22)
International journal of molecular sciences 2020 Nov 20;21(22)
Multidimensional analyses of proinsulin peptide-specific regulatory T cells induced by tolerogenic dendritic cells.
Suwandi JS, Laban S, Vass K, Joosten A, van Unen V, Lelieveldt BPF, Höllt T, Zwaginga JJ, Nikolic T, Roep BO
Journal of autoimmunity 2020 Feb;107:102361
Journal of autoimmunity 2020 Feb;107:102361
CD44 Promotes PD-L1 Expression and Its Tumor-Intrinsic Function in Breast and Lung Cancers.
Kong T, Ahn R, Yang K, Zhu X, Fu Z, Morin G, Bramley R, Cliffe NC, Xue Y, Kuasne H, Li Q, Jung S, Gonzalez AV, Camilleri-Broet S, Guiot MC, Park M, Ursini-Siegel J, Huang S
Cancer research 2020 Feb 1;80(3):444-457
Cancer research 2020 Feb 1;80(3):444-457
Synergistic inhibition of pancreatic cancer with anti-PD-L1 and c-Myc inhibitor JQ1.
Pan Y, Fei Q, Xiong P, Yang J, Zhang Z, Lin X, Pan M, Lu F, Huang H
Oncoimmunology 2019;8(5):e1581529
Oncoimmunology 2019;8(5):e1581529
CA-170 - A Potent Small-Molecule PD-L1 Inhibitor or Not?
Musielak B, Kocik J, Skalniak L, Magiera-Mularz K, Sala D, Czub M, Stec M, Siedlar M, Holak TA, Plewka J
Molecules (Basel, Switzerland) 2019 Aug 1;24(15)
Molecules (Basel, Switzerland) 2019 Aug 1;24(15)
Disruption of PD-1 Enhanced the Anti-tumor Activity of Chimeric Antigen Receptor T Cells Against Hepatocellular Carcinoma.
Guo X, Jiang H, Shi B, Zhou M, Zhang H, Shi Z, Du G, Luo H, Wu X, Wang Y, Sun R, Li Z
Frontiers in pharmacology 2018;9:1118
Frontiers in pharmacology 2018;9:1118
Generation of Tumor-Reactive T Cells by Co-culture of Peripheral Blood Lymphocytes and Tumor Organoids.
Dijkstra KK, Cattaneo CM, Weeber F, Chalabi M, van de Haar J, Fanchi LF, Slagter M, van der Velden DL, Kaing S, Kelderman S, van Rooij N, van Leerdam ME, Depla A, Smit EF, Hartemink KJ, de Groot R, Wolkers MC, Sachs N, Snaebjornsson P, Monkhorst K, Haanen J, Clevers H, Schumacher TN, Voest EE
Cell 2018 Sep 6;174(6):1586-1598.e12
Cell 2018 Sep 6;174(6):1586-1598.e12
Specific expression of PD-L1 in RELA-fusion supratentorial ependymoma: Implications for PD-1-targeted therapy.
Witt DA, Donson AM, Amani V, Moreira DC, Sanford B, Hoffman LM, Handler MH, Levy JMM, Jones KL, Nellan A, Foreman NK, Griesinger AM
Pediatric blood & cancer 2018 May;65(5):e26960
Pediatric blood & cancer 2018 May;65(5):e26960
Oncofetal gene SALL4 reactivation by hepatitis B virus counteracts miR-200c in PD-L1-induced T cell exhaustion.
Sun C, Lan P, Han Q, Huang M, Zhang Z, Xu G, Song J, Wang J, Wei H, Zhang J, Sun R, Zhang C, Tian Z
Nature communications 2018 Mar 28;9(1):1241
Nature communications 2018 Mar 28;9(1):1241
Antigen-Presenting Cell-Intrinsic PD-1 Neutralizes PD-L1 in cis to Attenuate PD-1 Signaling in T Cells.
Zhao Y, Harrison DL, Song Y, Ji J, Huang J, Hui E
Cell reports 2018 Jul 10;24(2):379-390.e6
Cell reports 2018 Jul 10;24(2):379-390.e6
PD-1 axis expression in musculoskeletal tumors and antitumor effect of nivolumab in osteosarcoma model of humanized mouse.
Zheng B, Ren T, Huang Y, Sun K, Wang S, Bao X, Liu K, Guo W
Journal of hematology & oncology 2018 Feb 6;11(1):16
Journal of hematology & oncology 2018 Feb 6;11(1):16
Similarities and differences between helminth parasites and cancer cell lines in shaping human monocytes: Insights into parallel mechanisms of immune evasion.
Narasimhan PB, Akabas L, Tariq S, Huda N, Bennuru S, Sabzevari H, Hofmeister R, Nutman TB, Tolouei Semnani R
PLoS neglected tropical diseases 2018 Apr;12(4):e0006404
PLoS neglected tropical diseases 2018 Apr;12(4):e0006404
PD-L1 expression in medulloblastoma: an evaluation by subgroup.
Martin AM, Nirschl CJ, Polanczyk MJ, Bell WR, Nirschl TR, Harris-Bookman S, Phallen J, Hicks J, Martinez D, Ogurtsova A, Xu H, Sullivan LM, Meeker AK, Raabe EH, Cohen KJ, Eberhart CG, Burger PC, Santi M, Taube JM, Pardoll DM, Drake CG, Lim M
Oncotarget 2018 Apr 10;9(27):19177-19191
Oncotarget 2018 Apr 10;9(27):19177-19191
Amplification of N-Myc is associated with a T-cell-poor microenvironment in metastatic neuroblastoma restraining interferon pathway activity and chemokine expression.
Layer JP, Kronmüller MT, Quast T, van den Boorn-Konijnenberg D, Effern M, Hinze D, Althoff K, Schramm A, Westermann F, Peifer M, Hartmann G, Tüting T, Kolanus W, Fischer M, Schulte J, Hölzel M
Oncoimmunology 2017;6(6):e1320626
Oncoimmunology 2017;6(6):e1320626
Mesenchymal Stromal Cell Secretion of Programmed Death-1 Ligands Regulates T Cell Mediated Immunosuppression.
Davies LC, Heldring N, Kadri N, Le Blanc K
Stem cells (Dayton, Ohio) 2017 Mar;35(3):766-776
Stem cells (Dayton, Ohio) 2017 Mar;35(3):766-776
Retroviral Replicating Vector Delivery of miR-PDL1 Inhibits Immune Checkpoint PDL1 and Enhances Immune Responses In Vitro.
Lin AH, Twitty CG, Burnett R, Hofacre A, Mitchell LA, Espinoza FL, Gruber HE, Jolly DJ
Molecular therapy. Nucleic acids 2017 Mar 17;6:221-232
Molecular therapy. Nucleic acids 2017 Mar 17;6:221-232
Oncolytic Adenovirus and Tumor-Targeting Immune Modulatory Therapy Improve Autologous Cancer Vaccination.
Jiang H, Rivera-Molina Y, Gomez-Manzano C, Clise-Dwyer K, Bover L, Vence LM, Yuan Y, Lang FF, Toniatti C, Hossain MB, Fueyo J
Cancer research 2017 Jul 15;77(14):3894-3907
Cancer research 2017 Jul 15;77(14):3894-3907
Oncogenic RAS Signaling Promotes Tumor Immunoresistance by Stabilizing PD-L1 mRNA.
Coelho MA, de Carné Trécesson S, Rana S, Zecchin D, Moore C, Molina-Arcas M, East P, Spencer-Dene B, Nye E, Barnouin K, Snijders AP, Lai WS, Blackshear PJ, Downward J
Immunity 2017 Dec 19;47(6):1083-1099.e6
Immunity 2017 Dec 19;47(6):1083-1099.e6
PD-L1/PD-1 expression and tumor-infiltrating lymphocytes in conjunctival melanoma.
Cao J, Brouwer NJ, Richards KE, Marinkovic M, van Duinen S, Hurkmans D, Verdegaal EME, Jordanova ES, Jager MJ
Oncotarget 2017 Aug 15;8(33):54722-54734
Oncotarget 2017 Aug 15;8(33):54722-54734
Correlation of PD-L1 Surface Expression on Leukemia Cells with the Ratio of PD-L1 mRNA Variants and with Electrophoretic Mobility.
Brodská B, Otevřelová P, Kuželová K
Cancer immunology research 2016 Oct;4(10):815-819
Cancer immunology research 2016 Oct;4(10):815-819
Expression of programmed death 1 ligand 1 on periodontal tissue cells as a possible protective feedback mechanism against periodontal tissue destruction.
Zhang J, Wang CM, Zhang P, Wang X, Chen J, Yang J, Lu W, Zhou W, Yuan W, Feng Y
Molecular medicine reports 2016 Mar;13(3):2423-30
Molecular medicine reports 2016 Mar;13(3):2423-30
CD28 family of receptors on T cells in chronic HBV infection: Expression characteristics, clinical significance and correlations with PD-1 blockade.
Tang ZS, Hao YH, Zhang EJ, Xu CL, Zhou Y, Zheng X, Yang DL
Molecular medicine reports 2016 Aug;14(2):1107-16
Molecular medicine reports 2016 Aug;14(2):1107-16
Human CAR T cells with cell-intrinsic PD-1 checkpoint blockade resist tumor-mediated inhibition.
Cherkassky L, Morello A, Villena-Vargas J, Feng Y, Dimitrov DS, Jones DR, Sadelain M, Adusumilli PS
The Journal of clinical investigation 2016 Aug 1;126(8):3130-44
The Journal of clinical investigation 2016 Aug 1;126(8):3130-44
Vitamin D regulates cytokine patterns secreted by dendritic cells to promote differentiation of IL-22-producing T cells.
Sommer A, Fabri M
PloS one 2015;10(6):e0130395
PloS one 2015;10(6):e0130395
Impact of Diverse Immune Evasion Mechanisms of Cancer Cells on T Cells Engaged by EpCAM/CD3-Bispecific Antibody Construct AMG 110.
Deisting W, Raum T, Kufer P, Baeuerle PA, Münz M
PloS one 2015;10(10):e0141669
PloS one 2015;10(10):e0141669
PDL1 Expression on Plasma and Dendritic Cells in Myeloma Bone Marrow Suggests Benefit of Targeted anti PD1-PDL1 Therapy.
Sponaas AM, Moharrami NN, Feyzi E, Standal T, Holth Rustad E, Waage A, Sundan A
PloS one 2015;10(10):e0139867
PloS one 2015;10(10):e0139867
Interleukin-25 Mediates Transcriptional Control of PD-L1 via STAT3 in Multipotent Human Mesenchymal Stromal Cells (hMSCs) to Suppress Th17 Responses.
Wang WB, Yen ML, Liu KJ, Hsu PJ, Lin MH, Chen PM, Sudhir PR, Chen CH, Chen CH, Sytwu HK, Yen BL
Stem cell reports 2015 Sep 8;5(3):392-404
Stem cell reports 2015 Sep 8;5(3):392-404
High and interrelated rates of PD-L1+CD14+ antigen-presenting cells and regulatory T cells mark the microenvironment of metastatic lymph nodes from patients with cervical cancer.
Heeren AM, Koster BD, Samuels S, Ferns DM, Chondronasiou D, Kenter GG, Jordanova ES, de Gruijl TD
Cancer immunology research 2015 Jan;3(1):48-58
Cancer immunology research 2015 Jan;3(1):48-58
Paucity of PD-L1 expression in prostate cancer: innate and adaptive immune resistance.
Martin AM, Nirschl TR, Nirschl CJ, Francica BJ, Kochel CM, van Bokhoven A, Meeker AK, Lucia MS, Anders RA, DeMarzo AM, Drake CG
Prostate cancer and prostatic diseases 2015 Dec;18(4):325-32
Prostate cancer and prostatic diseases 2015 Dec;18(4):325-32
IL-27 induces the expression of IDO and PD-L1 in human cancer cells.
Carbotti G, Barisione G, Airoldi I, Mezzanzanica D, Bagnoli M, Ferrero S, Petretto A, Fabbi M, Ferrini S
Oncotarget 2015 Dec 22;6(41):43267-80
Oncotarget 2015 Dec 22;6(41):43267-80
HIV-1 Tat protein induces PD-L1 (B7-H1) expression on dendritic cells through tumor necrosis factor alpha- and toll-like receptor 4-mediated mechanisms.
Planès R, BenMohamed L, Leghmari K, Delobel P, Izopet J, Bahraoui E
Journal of virology 2014 Jun;88(12):6672-89
Journal of virology 2014 Jun;88(12):6672-89
Upregulation of programmed death-1 on T cells and programmed death ligand-1 on monocytes in septic shock patients.
Zhang Y, Li J, Lou J, Zhou Y, Bo L, Zhu J, Zhu K, Wan X, Cai Z, Deng X
Critical care (London, England) 2011;15(1):R70
Critical care (London, England) 2011;15(1):R70
Ex vivo expanded hematopoietic stem cells overcome the MHC barrier in allogeneic transplantation.
Zheng J, Umikawa M, Zhang S, Huynh H, Silvany R, Chen BP, Chen L, Zhang CC
Cell stem cell 2011 Aug 5;9(2):119-30
Cell stem cell 2011 Aug 5;9(2):119-30
The PD-1/PD-L1 axis modulates the natural killer cell versus multiple myeloma effect: a therapeutic target for CT-011, a novel monoclonal anti-PD-1 antibody.
Benson DM Jr, Bakan CE, Mishra A, Hofmeister CC, Efebera Y, Becknell B, Baiocchi RA, Zhang J, Yu J, Smith MK, Greenfield CN, Porcu P, Devine SM, Rotem-Yehudar R, Lozanski G, Byrd JC, Caligiuri MA
Blood 2010 Sep 30;116(13):2286-94
Blood 2010 Sep 30;116(13):2286-94
Major depletion of plasmacytoid dendritic cells in HIV-2 infection, an attenuated form of HIV disease.
Cavaleiro R, Baptista AP, Soares RS, Tendeiro R, Foxall RB, Gomes P, Victorino RM, Sousa AE
PLoS pathogens 2009 Nov;5(11):e1000667
PLoS pathogens 2009 Nov;5(11):e1000667
Regulatory T cell (Treg) subsets return in patients with refractory lupus following stem cell transplantation, and TGF-beta-producing CD8+ Treg cells are associated with immunological remission of lupus.
Zhang L, Bertucci AM, Ramsey-Goldman R, Burt RK, Datta SK
Journal of immunology (Baltimore, Md. : 1950) 2009 Nov 15;183(10):6346-58
Journal of immunology (Baltimore, Md. : 1950) 2009 Nov 15;183(10):6346-58
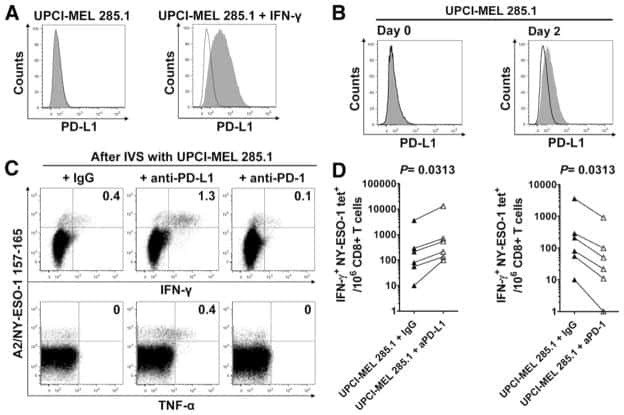
PD-1 is a regulator of NY-ESO-1-specific CD8+ T cell expansion in melanoma patients.
Fourcade J, Kudela P, Sun Z, Shen H, Land SR, Lenzner D, Guillaume P, Luescher IF, Sander C, Ferrone S, Kirkwood JM, Zarour HM
Journal of immunology (Baltimore, Md. : 1950) 2009 May 1;182(9):5240-9
Journal of immunology (Baltimore, Md. : 1950) 2009 May 1;182(9):5240-9
Expression of B7-H1 in inflammatory renal tubular epithelial cells.
Chen Y, Zhang J, Li J, Zou L, Zhao T, Tang Y, Wu Y
Nephron. Experimental nephrology 2006;102(3-4):e81-92
Nephron. Experimental nephrology 2006;102(3-4):e81-92
Clinical significance of programmed death-1 ligand-1 and programmed death-1 ligand-2 expression in human esophageal cancer.
Ohigashi Y, Sho M, Yamada Y, Tsurui Y, Hamada K, Ikeda N, Mizuno T, Yoriki R, Kashizuka H, Yane K, Tsushima F, Otsuki N, Yagita H, Azuma M, Nakajima Y
Clinical cancer research : an official journal of the American Association for Cancer Research 2005 Apr 15;11(8):2947-53
Clinical cancer research : an official journal of the American Association for Cancer Research 2005 Apr 15;11(8):2947-53
No comments: Submit comment
Supportive validation
- Submitted by
- Invitrogen Antibodies (provider)
- Main image
- Experimental details
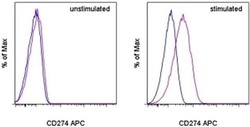
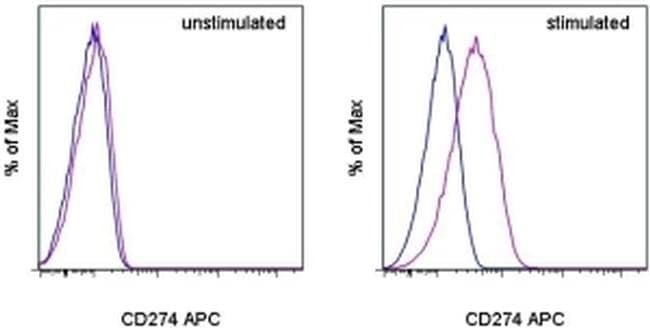
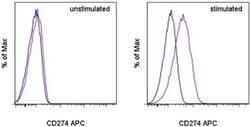
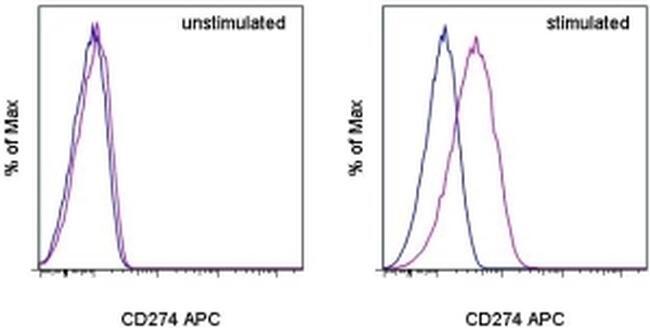
- Staining of unstimulated (left) or PHA-stimulated (right) normal human peripheral blood cells with Mouse IgG1 K Isotype Control APC (Product # 17-4714-81) (blue histogram) or Anti-Human CD274 (B7-H1) APC (purple histogram). Viable cells in the lymphocyte gate, as determined by Fixable Viability Dye eFluor® 520 (Product # 65-0867-14), were used for analysis.
- Submitted by
- Invitrogen Antibodies (provider)
- Main image
- Experimental details
- Staining of unstimulated (left) or PHA-stimulated (right) normal human peripheral blood cells with Mouse IgG1 K Isotype Control APC (Product # 17-4714-81) (blue histogram) or Anti-Human CD274 (B7-H1) APC (purple histogram). Viable cells in the lymphocyte gate, as determined by Fixable Viability Dye eFluor® 520 (Product # 65-0867-14), were used for analysis.
Supportive validation
- Submitted by
- Invitrogen Antibodies (provider)
- Main image

- Experimental details
- NULL

- Submitted by
- Invitrogen Antibodies (provider)
- Main image
- Experimental details
- NULL

- Submitted by
- Invitrogen Antibodies (provider)
- Main image

- Experimental details
- NULL
- Submitted by
- Invitrogen Antibodies (provider)
- Main image

- Experimental details
- NULL
- Submitted by
- Invitrogen Antibodies (provider)
- Main image

- Experimental details
- NULL
- Submitted by
- Invitrogen Antibodies (provider)
- Main image
- Experimental details
- NULL
- Submitted by
- Invitrogen Antibodies (provider)
- Main image
- Experimental details
- NULL

- Submitted by
- Invitrogen Antibodies (provider)
- Main image

- Experimental details
- NULL
- Submitted by
- Invitrogen Antibodies (provider)
- Main image
- Experimental details
- NULL

- Submitted by
- Invitrogen Antibodies (provider)
- Main image

- Experimental details
- NULL
- Submitted by
- Invitrogen Antibodies (provider)
- Main image
- Experimental details
- NULL
- Submitted by
- Invitrogen Antibodies (provider)
- Main image
- Experimental details
- NULL

- Submitted by
- Invitrogen Antibodies (provider)
- Main image
- Experimental details
- NULL
- Submitted by
- Invitrogen Antibodies (provider)
- Main image
- Experimental details
- NULL

- Submitted by
- Invitrogen Antibodies (provider)
- Main image
- Experimental details
- NULL
- Submitted by
- Invitrogen Antibodies (provider)
- Main image

- Experimental details
- NULL
- Submitted by
- Invitrogen Antibodies (provider)
- Main image

- Experimental details
- NULL
- Submitted by
- Invitrogen Antibodies (provider)
- Main image

- Experimental details
- NULL
- Submitted by
- Invitrogen Antibodies (provider)
- Main image
- Experimental details
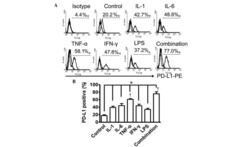
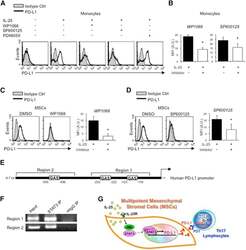
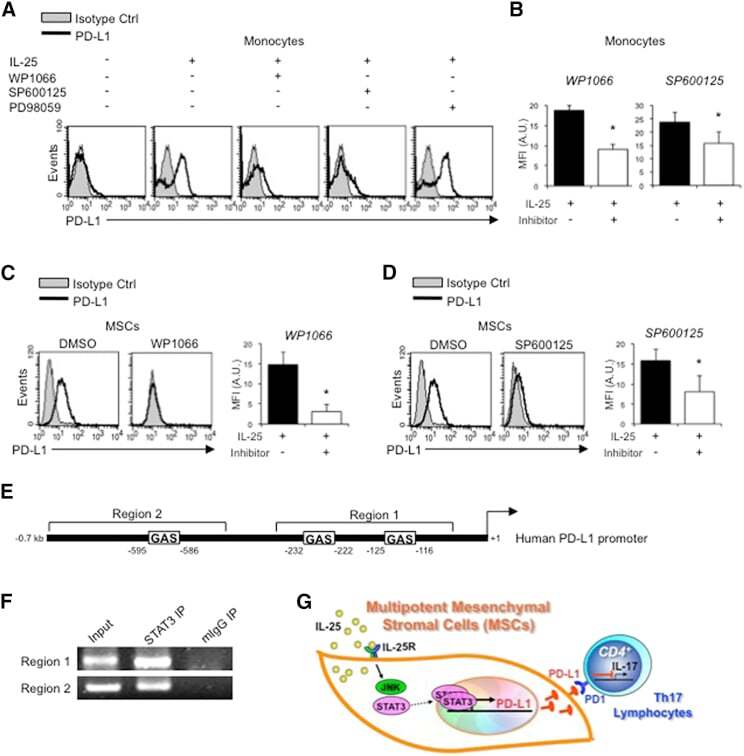
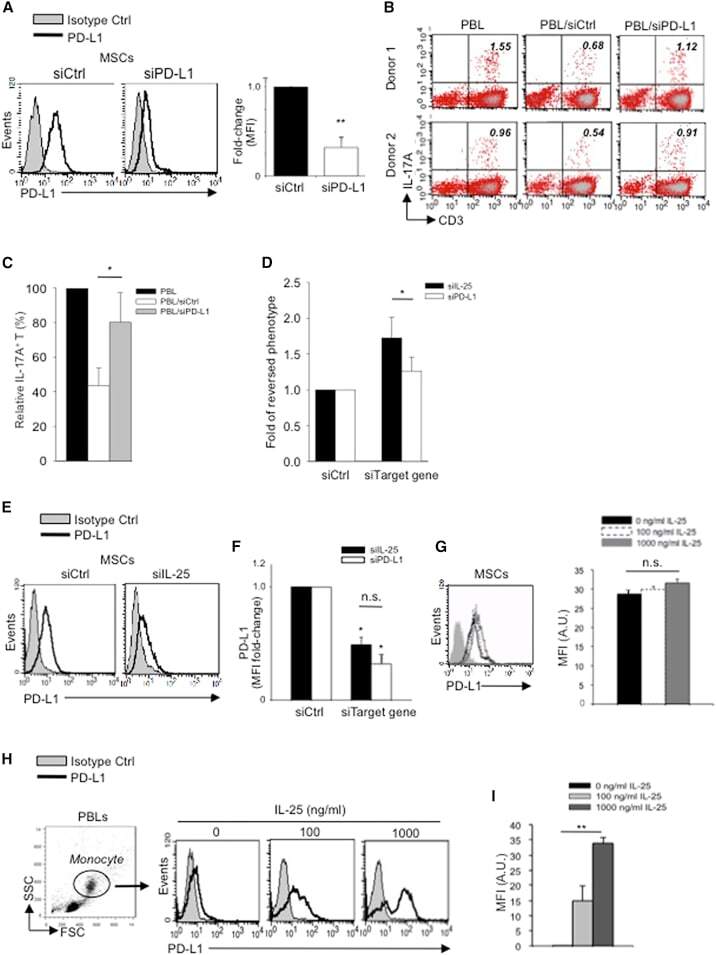
- Figure 6 IL-25-Mediated PD-L1 Expression in Human Monocytes and hMSCs Is Mediated through JNK and STAT3, with STAT3 Involved in Transcriptional Control of PD-L1 (A) Human PBLs were pretreated with inhibitors of STAT3 (WP1066; 2.5 muM), JNK (SP600125; 25 muM), or MEK1 (PD98059; 20 muM) prior to 100 ng/ml rhIL-25 for 18 hr, with subsequent flow cytometric analysis for PD-L1 surface expression on monocytes, gated using FSC and SSC. Filled histograms represent isotype control; unfilled histograms represent PD-L1 antibody staining. (B-D) Pooled data (three donors) are shown (B) with bars representing MFI. hMSCs were treated with inhibitors of STAT3 (C; WP1066, 2.5 muM) and JNK (D; SP600125, 25 muM) for 6 hr, and subsequently assessed by flow cytometric analysis for PD-L1 surface expression. Pooled data (all three donors) for each respective inhibitor are provided (left charts) with bars representing MFI. (E) Putative GAS elements (STAT-binding sites) in the proximal promoter region of human PD-L1 gene (700 bp region upstream from the transcription start site), as determined with TFSearch web-based software. (F) Binding of STAT3 or IgG (negative control) in hMSCs was analyzed by chromatin immunoprecipitation (ChIP) with promoter-specific primers for region 1 and region 2. The input samples (positive control) represent 1% starting chromatin. (G) Schematic shows a model of hMSC-mediated suppression of Th17 responses involving the IL-25/STAT3/PD-L1 axis.
- Submitted by
- Invitrogen Antibodies (provider)
- Main image
- Experimental details
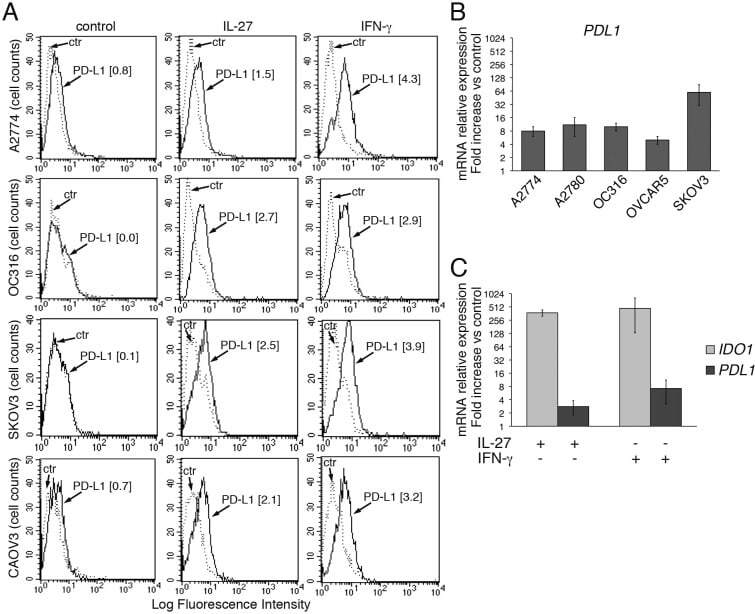
- Figure 2 IL-27 increases PD-L1 surface protein and mRNA expression in EOC cells in vitro A. FACS analysis of surface PD-L1 expression in four EOC cell lines, cultured in the presence of medium (control), IL-27 or IFN-gamma. Dotted lines are isotype-matched unrelated Ig staining controls. Numbers in brackets are Median Fluorescence Intensity (MFI) values calculated as median PD-L1 minus median Ig control. Data are representative of two independent experiments showing similar results. B. QRT-PCR analysis of PDL1 mRNA expression in five IL-27-stimulated EOC cells relative to untreated cells. Data are the mean (+-SD) of three independent experiments. C. Comparative analysis of IDO1 and PDL1 mRNA up-regulation by IL-27 or IFN-gamma in a representative EOC cell line (CAOV3). Data are the mean of two independent replicates and are expressed as DeltaDeltaCT-fold change. Error bars represent the minimum and maximum.
- Submitted by
- Invitrogen Antibodies (provider)
- Main image
- Experimental details
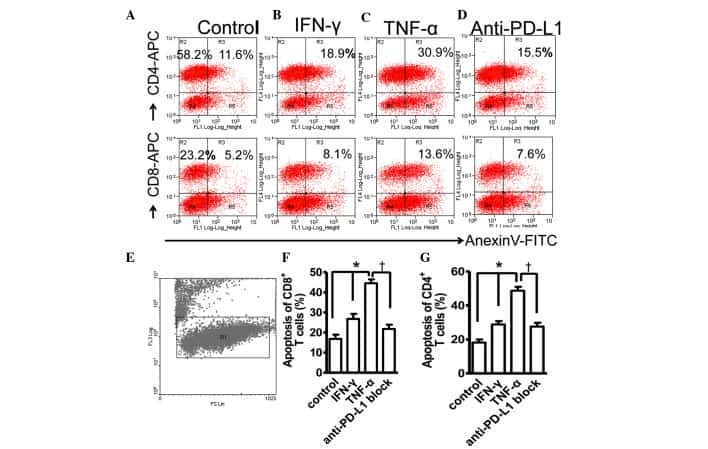
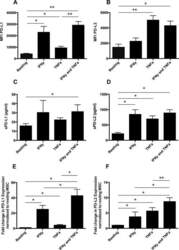
- Figure 1 Mesenchymal stromal cell (MSC) cell surface expression and secretion of PD-L1 and PD-L2 are potentiated by pro-inflammatory cytokines, IFNgamma and TNFalpha. MSCs ( n = 4) were exposed to 100 U/ml IFNgamma and 10 ng/ml TNFalpha for 3 days in culture. Cell surface expression (MFI) of (A) PD-L1 and (B) PD-L2 was assessed by flow cytometry. Secretion of (C) soluble (s)PD-L1 and (D) sPD-L2 within the conditioned media of stimulated cells was assessed by ELISA. Bar charts indicate mean +- SEM. Transcriptional regulation of (E) PD-L1 and (F) PD-L2 were assessed by qRT-PCR. mRNA data are expressed as fold change compared to unstimulated, resting MSCs +- SEM. *, p < .05; **, p < .01. Abbreviations: IFNgamma, Interferon gamma; MFI, mean fluorescence intensity; PD-L1 and PD-L2, programmed death 1 ligands 1 and 2; TNFalpha, tumor necrosis factor alpha.

- Submitted by
- Invitrogen Antibodies (provider)
- Main image
- Experimental details
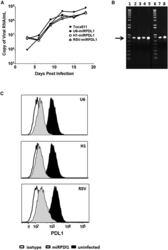
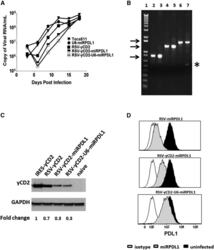
- Figure 4 RRV-RSV-miRPDL1 and RRV-H1-miRPDL1 Exhibit Comparable PDL1 Downregulation Activity as RRV-miRPDL1 (A) Replication kinetics of RRV-RSV-miRPDL1 and RRV-H1-miRPDL1. The viral genome in the supernatants of infected LN-18 cells (MOI of 0.1) at indicated time points were quantified by qRT-PCR using primer set targeted to the env region ( Figure 1 ). RRV-yCD2 and RRV-miRPDL1 (indicated as U6-miRPDL1 in the graph) were included as positive controls. (B) Vector stability of RRV-RSV-miRPDL1 and RRV-H1-miRPDL1 in LN-18 cells was analyzed by endpoint PCR at 14 and 30 days post infection. Lanes 1 and 6: DNA molecular marker (1 Kb Plus marker, Invitrogen); lanes 2, 4, and 7 are positive controls using the corresponding plasmid DNA as the templates; lane 3: RRV-H1-miRPDL1; lane 5: RRV-RSV-miRPDL1; and lane 8: RRV-miRPDL1. The arrow indicates the expected size of the PCR products. (C) LN-18 cells infected with RRV-miRPDL1 (U6), RRV-H1-miRPDL1 (H1), and RRV-RSV-miRPDL1 (RSV) were stained for PDL1 cell surface expression with PDL1 antibody and analyzed by flow cytometry.

- Submitted by
- Invitrogen Antibodies (provider)
- Main image
- Experimental details
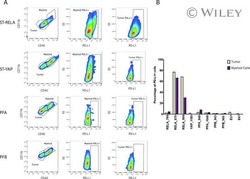
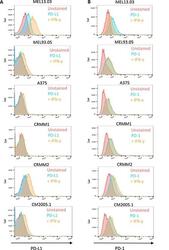
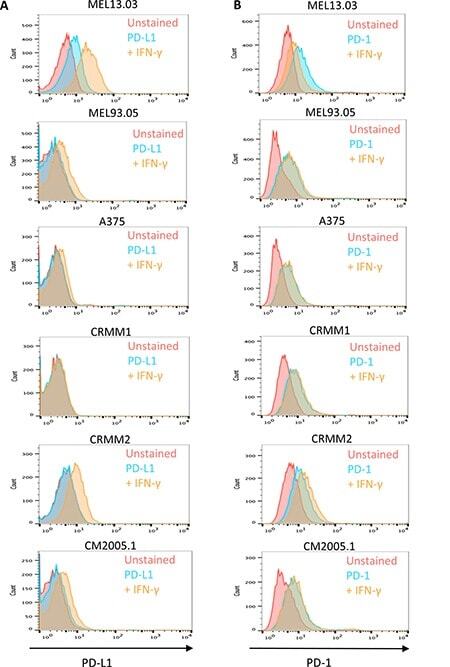
- Figure 6 Cutaneous (MEL13.03, MEL93.05 and A375) and conjunctival melanoma (CRMM1, CRMM2 and CM2005.1) cell lines express various levels of PD-L1 and PD-1 MEL13.03 is the positive control cell line for both PD-L1 and PD-1. Representative histograms show ( A ) PD-L1 and PD-1 ( B ) expression in cell lines with or without IFN-gamma (100 IU/ml) exposure for 48 h. Pink, blue and brown shaded histograms represent unstained, PD-L1 (PD-1) staining, and the effect of IFN-gamma stimulation on PD-L1 and PD-1, respectively.
- Submitted by
- Invitrogen Antibodies (provider)
- Main image

- Experimental details
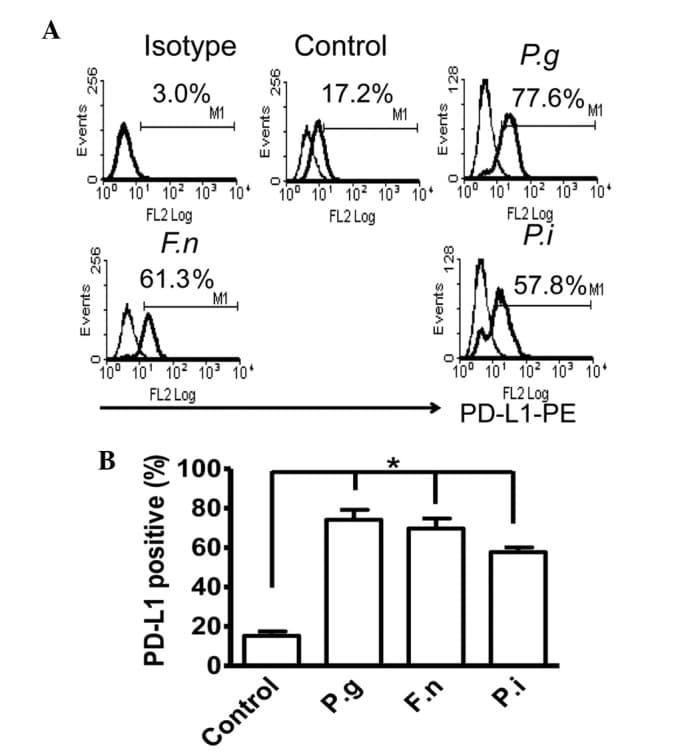
- Figure 2 Common periodontal pathogens induce the expression of PD-L1 on PDLCs. (A) Flow cytometry histogram overlays of PDLCs co-cultured with P.g , F.n and P.i . (B) Comparison of expression levels of PD-L1 induced by P.g, F.n and P.i. Data are expressed as the mean +- standard error of the mean of three independent experiments. All three strains significantly increased the expression of PD-L1 on the PDLCs, * P
- Submitted by
- Invitrogen Antibodies (provider)
- Main image
- Experimental details
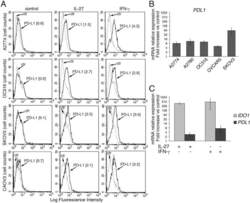
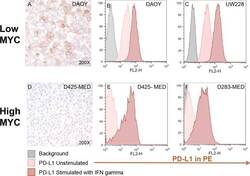
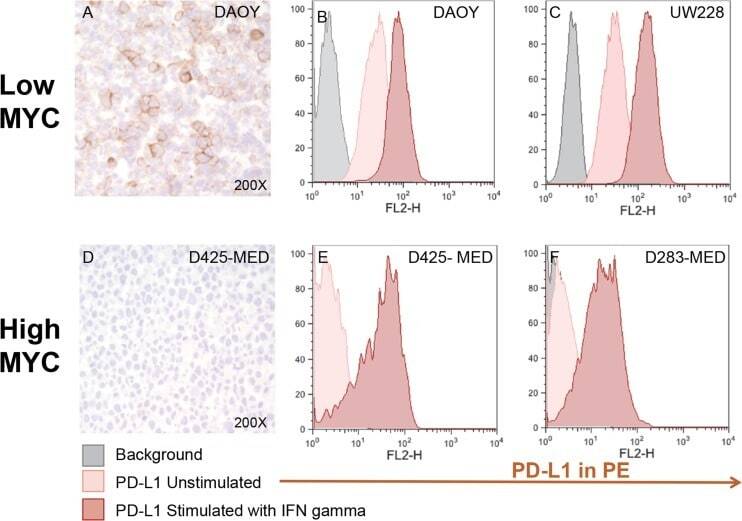
- Figure 4 Medulloblastoma cell lines express PD-L1 in a subgroup dependent manner PD-L1 expression in low and high MYC MB cell lines. Paraffin embedded cell line pellets stained for PD-L1 in DAOY ( A ) and D425-MED ( D ). Histograms of PD-L1 expression by flow cytometry using phycoerythrin (PE) conjugated MIH1 clone of PD-L1 (EBioscience) with and without IFN-gamma stimulation in DAOY ( B ), UW228 ( C ), D425-MED ( E ), and D283-MED ( F ).
- Submitted by
- Invitrogen Antibodies (provider)
- Main image
- Experimental details
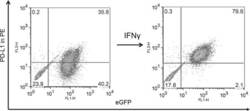
- Figure 5 MYC overexpression in DAOY (YM21) does not alter PD-L1 expression Dot Plots of PD-L1 expression by flow cytometry using PE-conjugated MIH1 clone of PD-L1 (EBioscience) in YM21 construct made by overexpressing MYC in DAOY via stable lentiviral transfection.

- Submitted by
- Invitrogen Antibodies (provider)
- Main image
- Experimental details
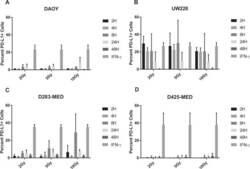
- Figure 6 Radiation induces PD-L1 in most medulloblastoma cell lines Bar graph depicts percent PD-L1 positive cells above baseline as determined by flow cytometry using PE-conjugated MIH1 clone of PD-L1 (EBioscience) in DAOY ( A ), UW228 ( B ), D283-MED ( C ), and D425-MED ( D ) after irradiation with 2, 5, or 10 Gy at 2, 4, 8, 24, and 48 hours. IFN-gamma values were obtained without radiation. Each bar graph depicts findings from 2 different experiments where all data points were repeated. Error bars represent standard deviation of the mean. Levels of PD-L1 that were comparable to those induced by IFN-gamma included UW228 hours 2-24 at 2, 5 and 10 Gy and D283-MED at hour 8, 10 Gy. All other values were significantly less than those induced by IFN-gamma as determined by 2-way ANOVA corrected for multiple comparisons. Full statistical analysis available in Supplementary Table 1-1-1-4 .

- Submitted by
- Invitrogen Antibodies (provider)
- Main image
- Experimental details
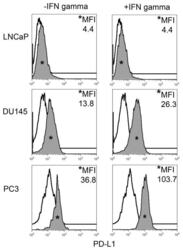
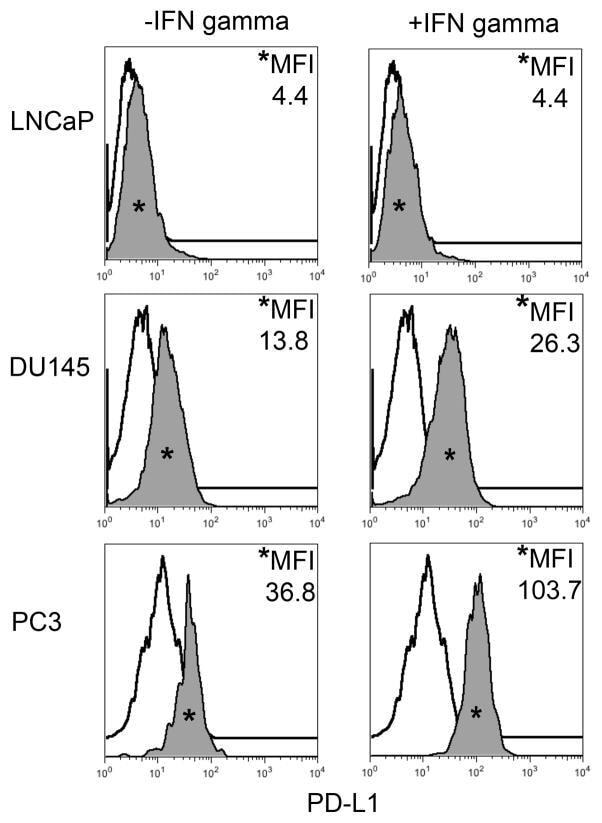
- FIGURE 1 Human Prostate Cancer Cell Lines Display Varying Expression of PD-L1 in Response to IFN-gamma Histograms representing PD-L1 surface expression as detected by flow cytometry in human prostate cancer cell lines with and without exposure to IFN-gamma. Open histograms represent cells stained with an isotype IgG1 antibody tagged with a matching PE fluorochrome. Shaded histograms represent PD-L1. Quantitative measurements reflect mean fluorescence index. LNCaP does not express PD-L1 at rest or in response to IFN-gamma. DU145 expresses PD-L1 at rest and has little response to IFN-gamma indicating an innate immune resistance phenotype. PC3 expresses PD-L1 at rest but robustly up-regulates this expression in response to IFN-gamma displaying a more classic adaptive immune resistance phenotype.
- Submitted by
- Invitrogen Antibodies (provider)
- Main image
- Experimental details
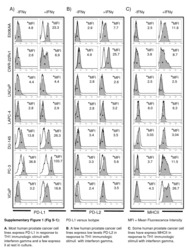
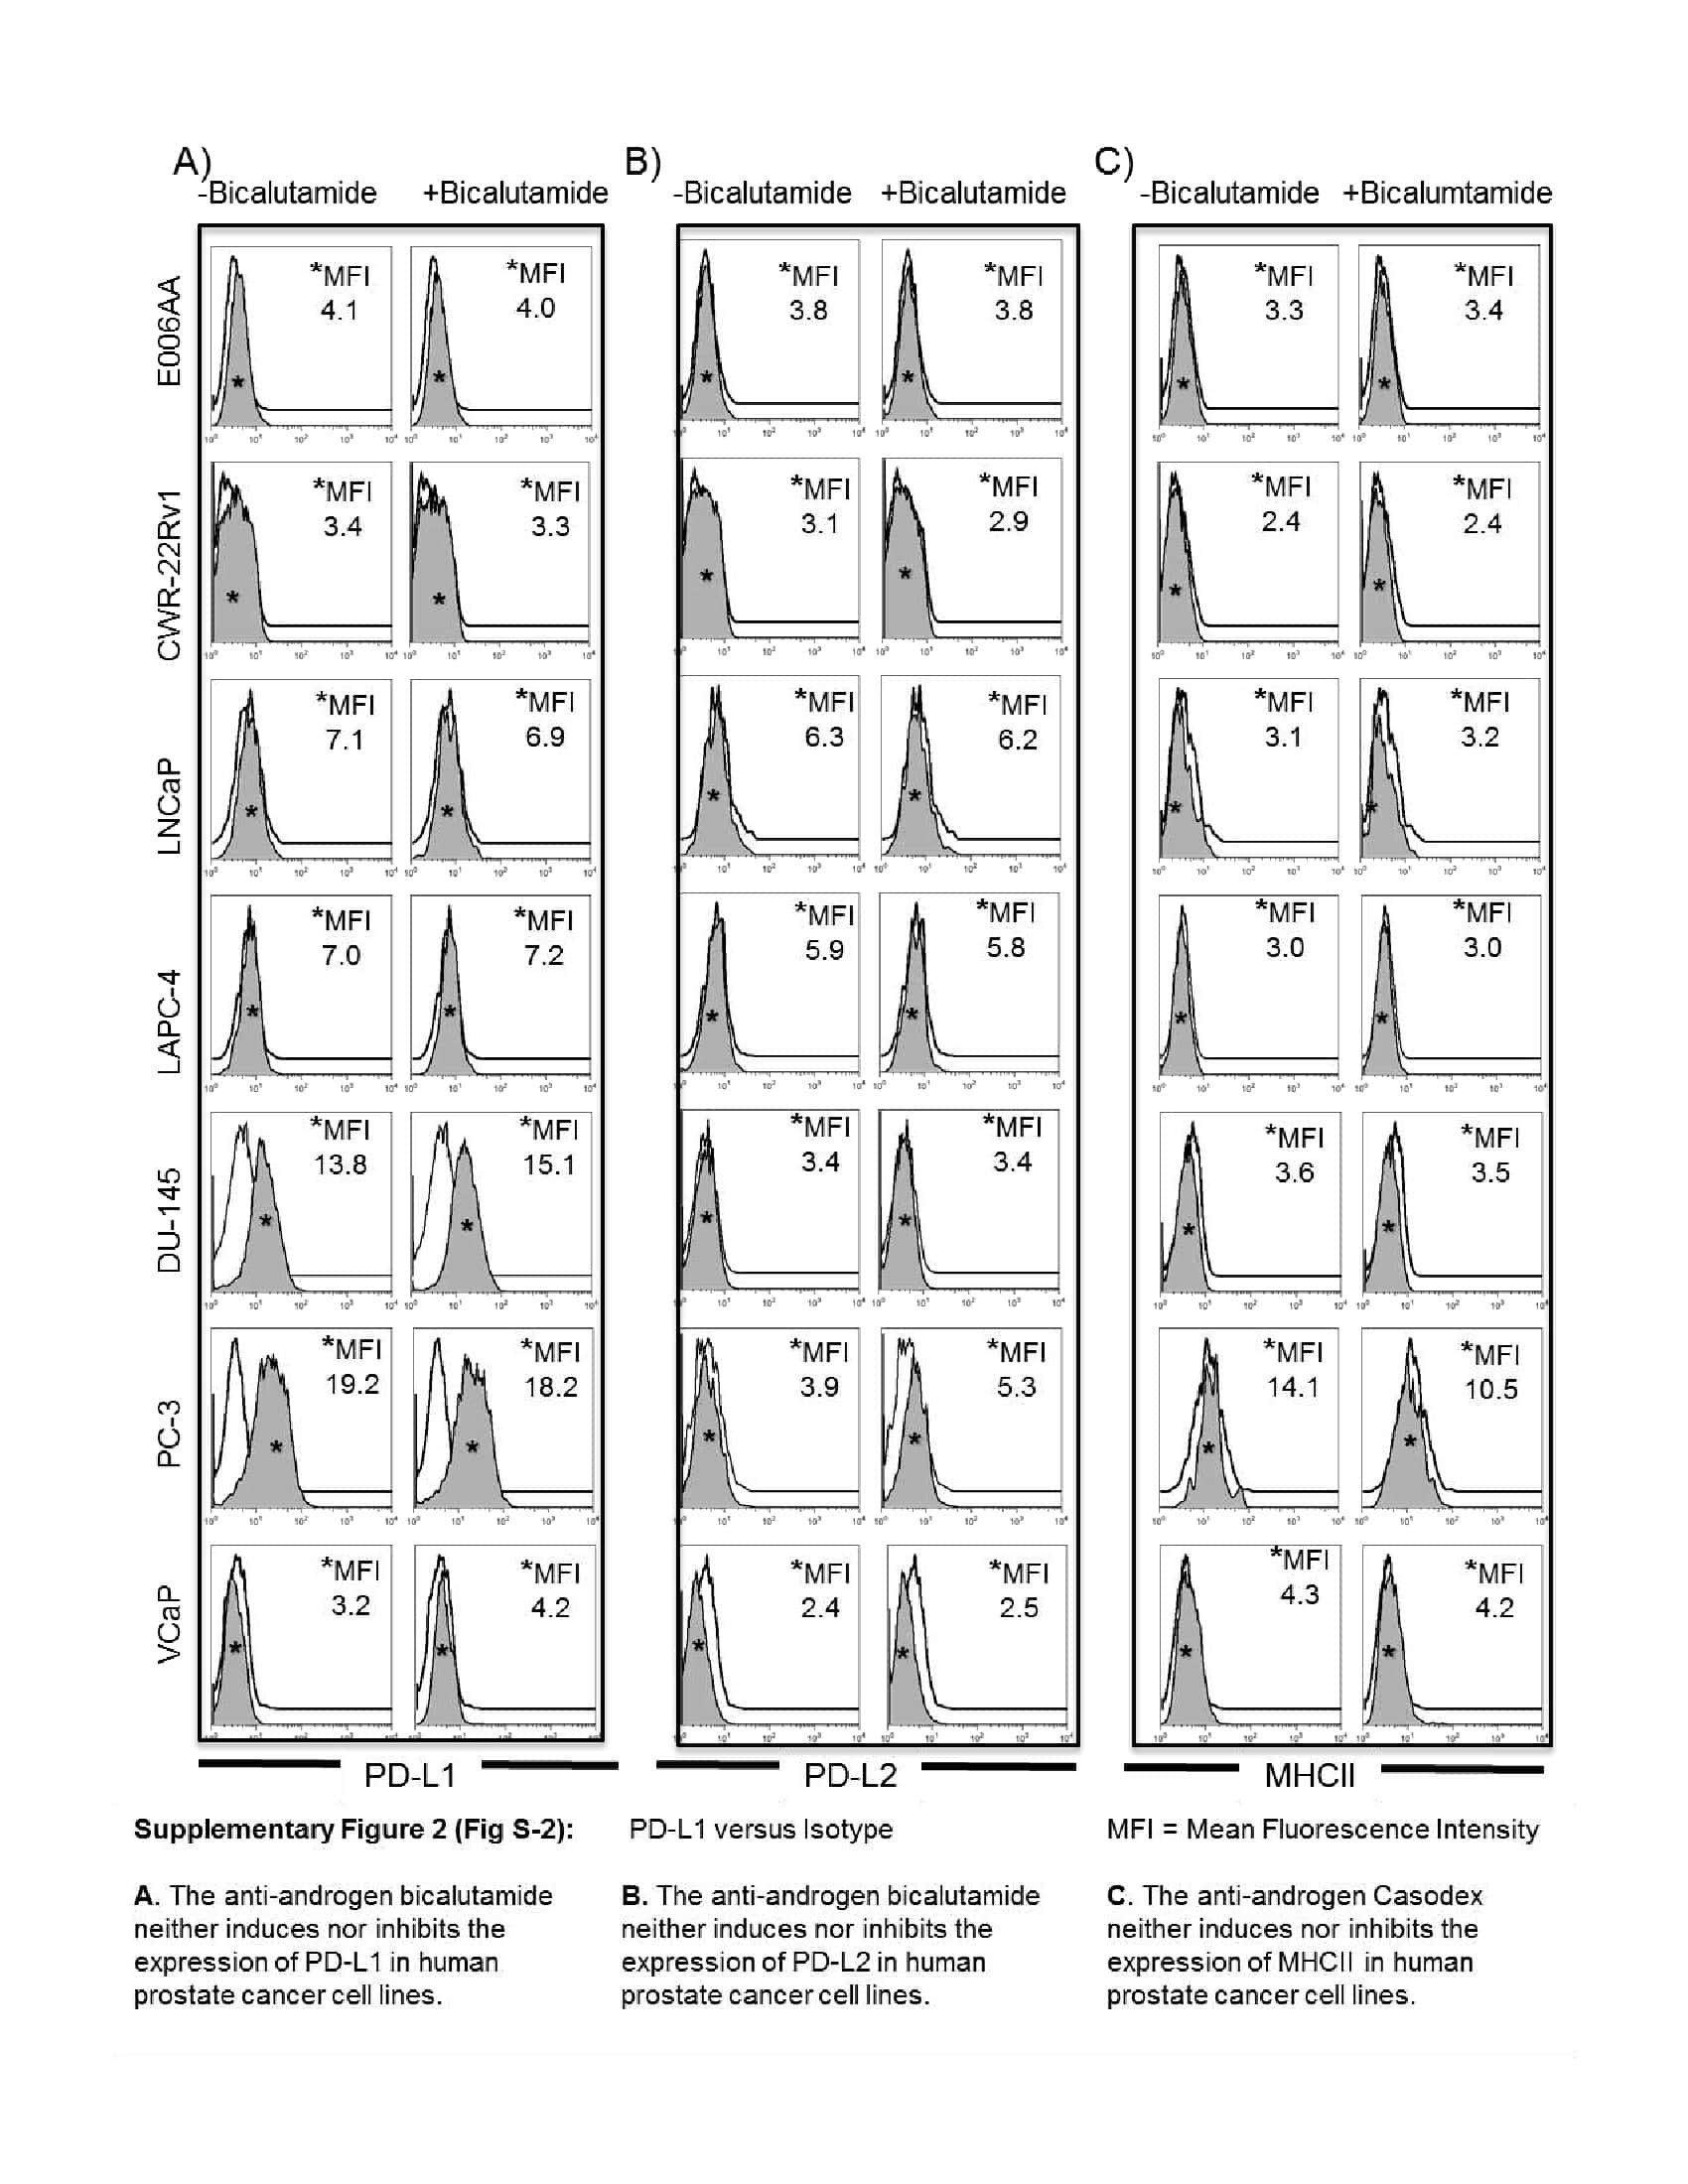
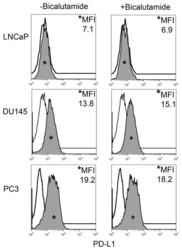
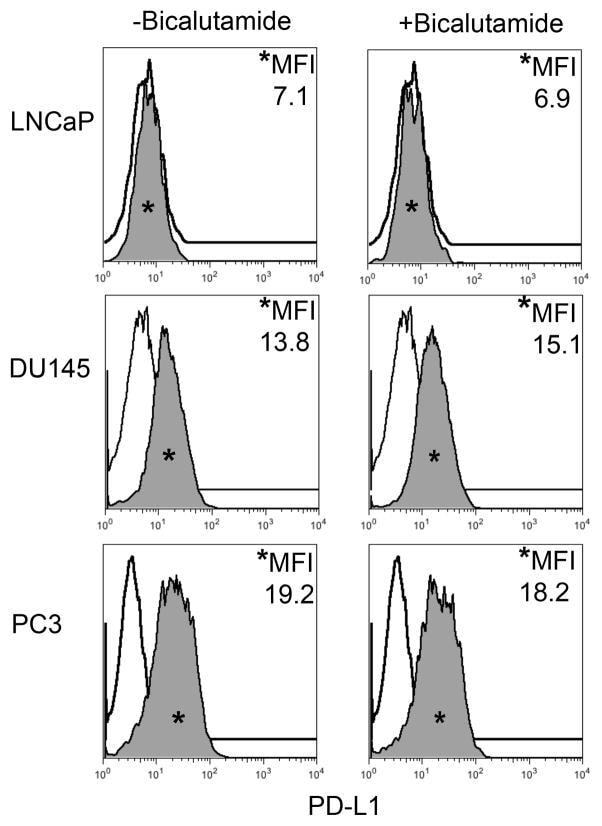
- FIGURE 2 Human Prostate Cancer Cell Lines Display No Change in PD-L1 Expression in Response to Bicalutamide Histograms representing PD-L1 surface expression as detected by flow cytometry in human prostate cancer cell lines with and without exposure to bicalutamide. Open histograms represent cells stained with an isotype IgG1 antibody tagged with a matching PE fluorochrome. Shaded histograms represent PD-L1. Quantitative measurements reflect mean fluorescence index. LNCaP, DU145, and PC3 displayed no changes in PD-L1 expression upon exposure to bicalutamide.
- Submitted by
- Invitrogen Antibodies (provider)
- Main image

- Experimental details
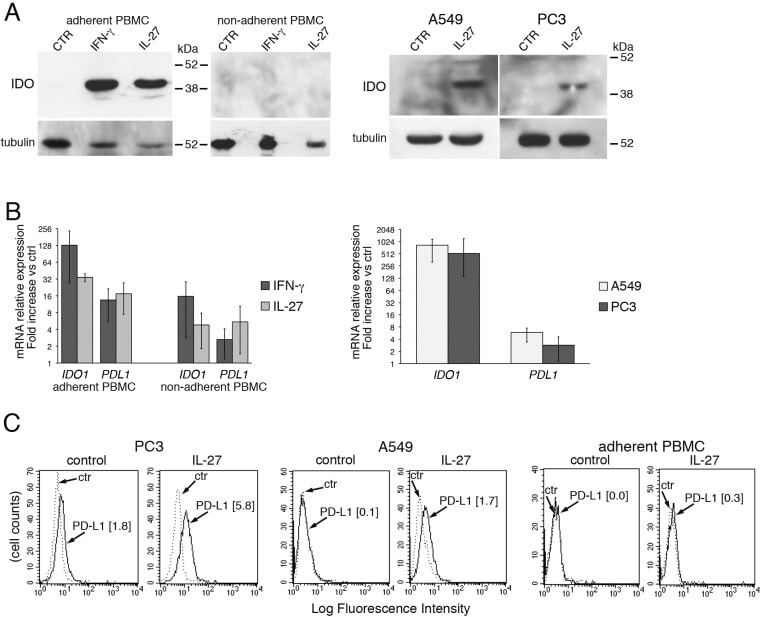
- Figure 7 IL-27 induces PD-L1 and/or IDO expression in human PC3 prostate and A549 lung cancer cells and adherent PBMC A. Western blot analysis of IDO expression in human adherent PBMC, non-adherent PBMC and in PC3 and A549 cells treated with the indicated cytokines or medium only for 48 hours. alpha-tubulin is used as loading control. Similar results were observed in two additional experiments. B. QRT-PCR analysis of IDO1 and PDL1 mRNA expression in cytokine-stimulated adherent or non-adherent PBMC, PC3 and A549 cells relative to untreated cells. Data are expressed as DeltaDeltaCT-fold change. Mean values of three independent experiments. Error bars represent SD. C. FACS analysis of surface PD-L1 in IL-27-treated or untreated PC3 and A549 cell lines and adherent PBMC. Dotted lines are isotype-matched unrelated Ig staining controls. Similar results were obtained in five different experiments (PC3: MFI 5.5 +- 2.7 vs 1.5 +- 0.6, mean +- SD in IL-27-treated vs un-stimulated cells, P = 0.03 by paired Student's t test; A549: MFI 2 +- 1 vs 0.43 +- 0.4, P = 0.01).
- Submitted by
- Invitrogen Antibodies (provider)
- Main image
- Experimental details
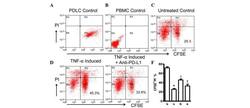
- Figure 4 Expression of PD-L1 on PDLCs improves survival of PDLCs. Flow cytometry histrograms of (A) PDLCs, (B) PHA-activated PBMCs, (C) PDLCs co-cultured with activated PBMCs, (D) PDLCs pretreated with TNF-alpha and co-cultured with activated PBMCs, and (E) PDLCs pretreated with TNF-alpha, and incubated with activated PBMCs and anti-PD-L1 antibodies. (F) Comparison of PDLC survival, according to the percentages of CFSE + /PI - cells. a, c, d and e represent the PDLC control, untreated control, TNF-alpha induced and TNF-alpha induced+anti-PD-L1 groups, respectively. Data are expressed as the mean +- standard error of the mean of three independent experiments. Co-culturing the activated PMBCs with untreated PDLCs resulted in a significant decrease in viable PDLCs ( * P

- Submitted by
- Invitrogen Antibodies (provider)
- Main image
- Experimental details
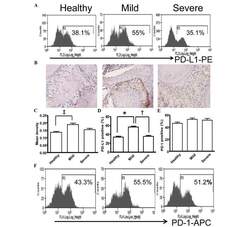
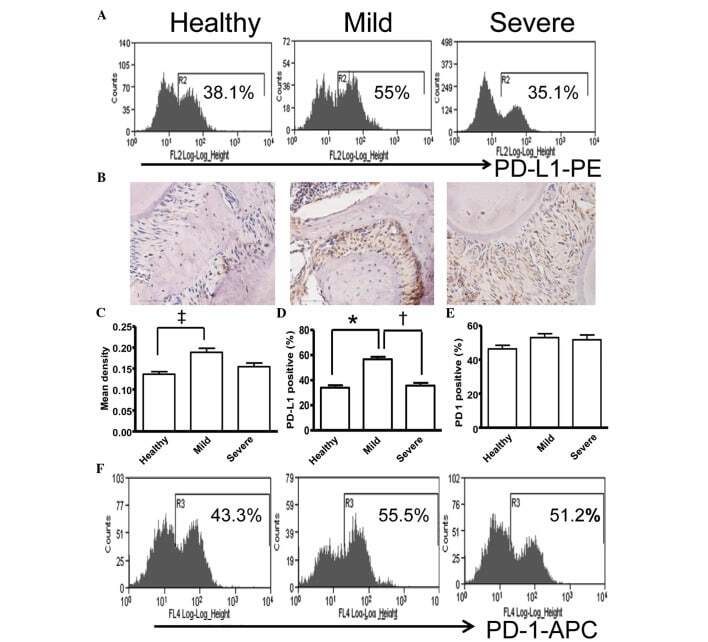
- Figure 5 Expression of PD-L1 is correlated with the severity of periodontitis in the experimental periodontitis model. (A) Flow cytometry histograms of the expression of PD-L1 on the surface of periodontal tissue cells from healthy mice, and mice with mild periodontitis and severe periodontitis. (B) Expression of PD-L1 in periodontal tissues from the three groups, detected by immunohistochemical staining (magnification, x400). (C) Comparison of the expression of PDL-1 in periodontal tissues between the three groups ( ++ P
- Submitted by
- Invitrogen Antibodies (provider)
- Main image
- Experimental details
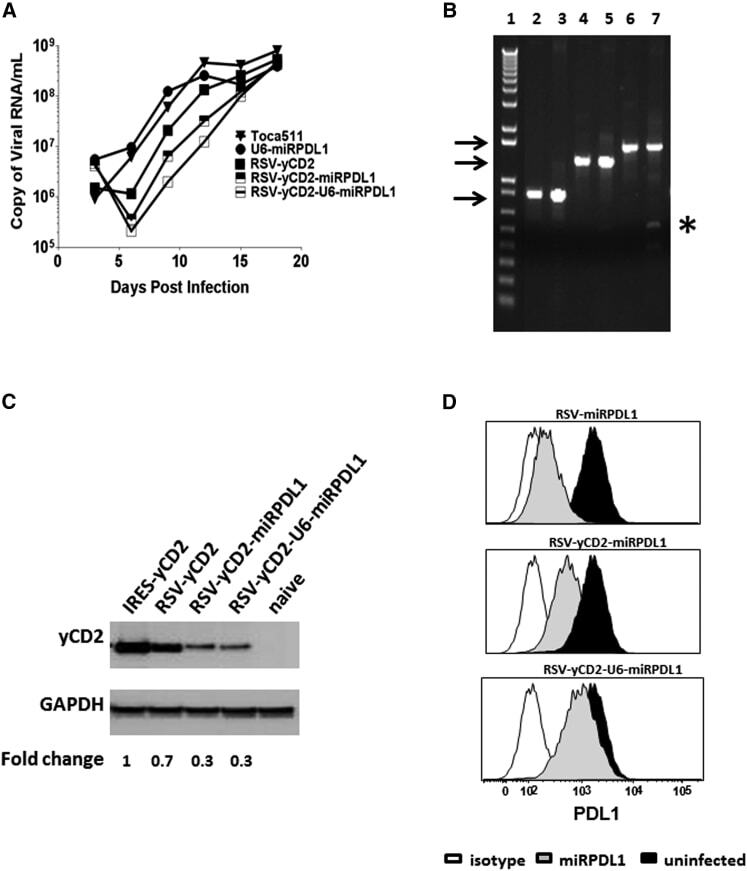
- Figure 5 RRV-RSV-yCD2-miRPDL1 and RRV-RSV-yCD2-U6-miRPDL1 Express yCD2 Protein and Exhibit PDL1 Downregulation Activity (A) Replication kinetics of RRV-RSV-yCD2-miRPDL1 and RRV-RSV-yCD2-U6-miRPDL1. The viral genome in the supernatants of infected LN-18 cells (MOI of 0.1) at indicated time points were quantified by qRT-PCR using primer set targeted to the env region ( Figure 1 ). A paired t test was performed and showed no statistically significant difference in replication kinetics between RRV-RSV-yCD2-miRPDL1 versus RRV-RSV-yCD2 (p = 0.0649) and RRV-RSV-yCD2-U6-miRPDL1 (p = 0.0801). RRV-yCD2, RRV-RSV-yCD2, and RRV-miRPDL1 (indicated as U6-miRPDL1 in the graph) were included as positive controls. (B) Vector stability of RRV-RSV-yCD2-miRPDL1 and RRV-RSV-yCD2-U6-miRPDL1 in LN-18 cells was analyzed by endpoint PCR at 14 days post infection. Lane 1: DNA molecular marker (1 Kb Plus marker, Invitrogen); lanes 2, 4, and 6 are positive controls using the corresponding plasmid DNA as the templates; lane 3: RRV-RSV-miRPDL1; lane 5: RRV-RSV-yCD2-miRPDL1; and lane 7: RRV-RSV-yCD2-U6-miRPDL1. The arrows indicate the expected size of the PCR products (844 bp for RRV-RSV-miRPDL1; 1,326 bp for RRV-RSV-yCD2-miRPDL1; and 1,591 bp for RRV-RSV-yCD2-U6-miRPDL1). (C) yCD2 protein expression in LN-18 cell infected with RRV-yCD2, RRV-RSV-yCD2, RRV-RSV-yCD2-miRPDL1, RRV-RSV-yCD2-U6-miRPDL1, and naive cells. GAPDH is included as loading control. The numbers shown on the bottom of the immunoblot indica
- Submitted by
- Invitrogen Antibodies (provider)
- Main image
- Experimental details
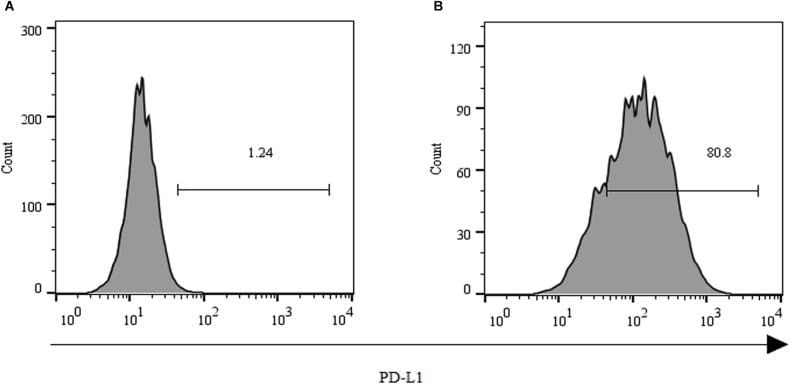
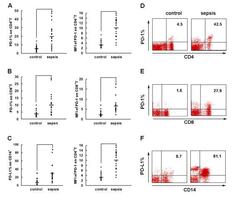
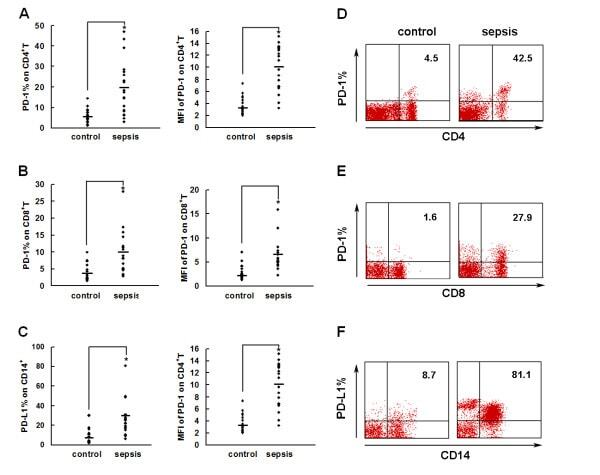
- Figure 2 PD-1 and PD-L1 were upregulated on T cells and monocytes in septic shock patients . Blood samples were obtained from 19 septic shock patients and 22 healthy controls and were stained for programmed death-1 (PD-1) and programmed death ligand-1 (PD-L1) gated on CD4 + T cells, CD8 + T cells, and CD14 + monocytes. (a) to (c) Percentage of PD-1 expression on (a) CD4 + T cells and (b) CD8 + T cells, and (c) percentage of PD-L1 expression on CD14 + monocytes. Each dot represents one individual. Data are mean +- standard error of the mean (SEM) of three independent experiments. ** P < 0.01 compared with healthy controls. (d) to (f) Mean fluorescence intensity (relative fluorescence units) of PD-1 expression on (d) CD4 + T cells, (e) PD-1 expression on CD8 + T cells, and (f) PD-L1 expression on CD14 + monocytes Each dot represents one individual. Data are mean +- SEM of three independent experiments. * P < 0.05 compared with healthy controls. (g) Representative PD-1 expression levels on CD4 + T cells and CD8 + T cells, and PD-L1 expression on CD14 + monocytes. Values in the upper-right quadrant indicate the percentage of cells that express PD-1 or PD-L1.
- Submitted by
- Invitrogen Antibodies (provider)
- Main image

- Experimental details
- Figure 5 IL-25 Induces PD-L1 Surface Expression on hMSCs and Human Monocytes (A) PD-L1 in siCtrl MSCs (left) and siPD-L1 MSCs (right) was analyzed by surface staining. (B) Freshly isolated human PBLs were co-cultured without (left) or with siCtrl MSCs (middle) or siPD-L1 MSCs (right) for 3 days, followed by PMA/ionomycin stimulation for 6 hr. IL-17A production in CD3 + T cells was assessed by intracellular staining. Representative data are shown with numbers in the top right quadrants representing the percentages of IL-17A-producing CD3 + T cells. (C) Pooled data from PBLs (n = 4) and two hMSC donors (donors A and B) are shown. (D) Folds of reversed phenotypes of siIL-25 and siPD-L1 are shown. (E) PD-L1 expression on siCtrl hMSCs (left) and siIL-25 hMSCs (right) was assessed by cell surface staining. Filled histograms represent isotype control; unfilled histograms represent PD-L1 antibody staining. (F) Pooled data of PD-L1 expression (indicated by fold change in MFI) on siIL-25 hMSCs and siPD-L1 hMSCs (all three donors) are shown. PD-L1 expression levels were compared between hMSCs silenced for the target gene (IL-25 or PD-L1) and the respective siCtrl. (G) hMSCs were treated with the indicated doses of rhIL-25 for 18 hr and assessed for cell surface PD-L1 expression by cell surface staining. Pooled data (all three donors) are shown in chart to the right with bars representing MFI. (H) Human PBLs were treated with the indicated doses of rhIL-25 for 18 hr and assessed for cell
- Submitted by
- Invitrogen Antibodies (provider)
- Main image
- Experimental details
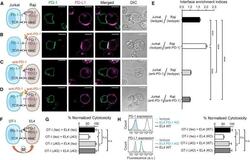
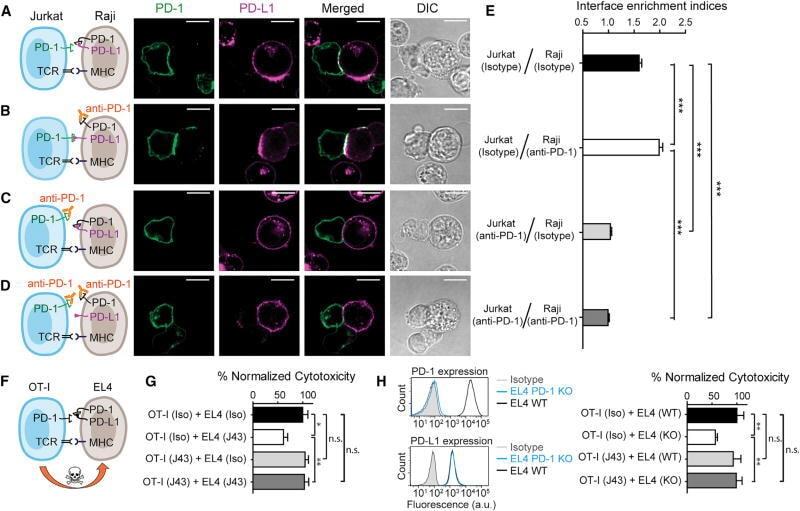
- Figure 7 Blockade of APC-Intrinsic PD-1 Enhances the Synaptic Enrichment of T Cell-Intrinsic PD-1 and Inhibits T Cell-Mediated Cytotoxicity (A) Left: cartoon showing a Jurkat cell expressing PD-1-mGFP (shown as PD-1 in green) conjugated with a Raji cell co-transduced with PD-L1-mCherry and unlabeled PD-1. Right: representative confocal images of the conjugate at the indicated channel acquired 2 min after cell-cell contact. Scale bars, 10 um. (B-D) Same as (A), except that Raji (PD-L1+/PD-1+) cells (B), Jurkat (PD-1-mGFP) cells (C), or both (D) were preincubated with pembrolizumab and washed extensively prior to conjugation. Scale bars, 10 um. (E) Bar graph comparing the interface enrichment indices (calculated as described in STAR Methods) of the four conditions shown in (A)-(D). Data are expressed as mean +- SEM; n = 40 cells from three independent experiments. (F) Cartoon illustrating the cytotoxicity assay, in which EL4 cells were used as the target for OT-I cytotoxic T cells. (G) Bar graph summarizing the OT-I cytotoxicity under indicated conditions, with PD-1 blockade antibody J43 or isotype antibody (Iso) preincubated with neither cell, only EL4, only OT-I, or both cell types. See STAR Methods for details. Cytotoxicity was normalized to the no blockade antibody condition (i.e., EL4 and OT-I preincubated with the isotype control). n.s., not significantly different. Data are presented as mean +- SEM from three independent replicates. (H) Left: FACS histograms showing PD-1
- Submitted by
- Invitrogen Antibodies (provider)
- Main image
- Experimental details
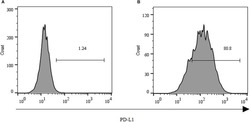
- FIGURE 2 Expression of PD-L1 on human HCC PLC/PRF/5 cells. (A) Human HCC PLC/PRF/5 cells were cultured alone in the absence of GPC3-CAR T cells in RPMI 1640 medium containing 10% FBS. (B) Human HCC PLC/PRF/5 cells were cocultured with GPC3-CAR T cells at an effector:Target ratio of 1:1 for 18 h in RPMI 1640 medium containing 10% FBS. PD-L1 was determined by flow cytometry in the CD3-negative gate, and the fixable, viable stain 780 was used for discriminating live from dead cells.