Explore
 Validate
 Learn
Learn25-5983-41
antibody from Invitrogen Antibodies
Targeting: CD274
B7-H, B7-H1, B7H1, PD-L1, PDCD1LG1, PDL1
 Flow cytometry
Antibody data
- Antibody Data
- Antigen structure
- References [57]
- Comments [0]
- Validations
- Flow cytometry [1]
- Other assay [74]
Submit
Validation data
Reference
Comment
Report error
- Product number
- 25-5983-41 - Provider product page

- Provider
- Invitrogen Antibodies
- Product name
- CD274 (PD-L1, B7-H1) Monoclonal Antibody (MIH1), PE-Cyanine7, eBioscience™
- Antibody type
- Monoclonal
- Antigen
- Other
- Description
- Description: The MIH1 monoclonal antibody reacts with human B7-H1, also known as PD-L1. B7-H1, a member of the B7 family, has a predicted molecular weight of approximately 40 kDa and belongs to the Ig superfamily. B7-H1 is expressed on a majority of leukocytes. B7-H1 is a ligand for PD-1. Interaction of PD-1 with either PD-L1 (B7-H1) or PD-L2 (B7-DC) results in inhibition of T and B cell responses. MIH1 is reported to be a blocking antibody. Applications Reported: This MIH1 antibody has been reported for use in flow cytometric analysis. Applications Tested: This MIH1 antibody has been pre-titrated and tested by flow cytometric analysis of normal human peripheral blood cells. This can be used at 5 µL (0.25 µg) per test. A test is defined as the amount (µg) of antibody that will stain a cell sample in a final volume of 100 µL. Cell number should be determined empirically but can range from 10^5 to 10^8 cells/test. Light sensitivity: This tandem dye is sensitive photo-induced oxidation. Please protect this vial and stained samples from light. Fixation: Samples can be stored in IC Fixation Buffer (Product # 00-822-49) (100 µL cell sample + 100 µL IC Fixation Buffer) or 1-step Fix/Lyse Solution (Product # 00-5333-54) for up to 3 days in the dark at 4°C with minimal impact on brightness and FRET efficiency/compensation. Some generalizations regarding fluorophore performance after fixation can be made, but clone specific performance should be determined empirically. Excitation: 488-561 nm; Emission: 775 nm; Laser: Blue Laser, Green Laser, Yellow-Green Laser. Filtration: 0.2 µm post-manufacturing filtered.
- Reactivity
- Human
- Host
- Mouse
- Isotype
- IgG
- Antibody clone number
- MIH1
- Vial size
- 25 Tests
- Concentration
- 5 µL/Test
- Storage
- 4° C, store in dark, DO NOT FREEZE!
Submitted references PD-L1 CAR effector cells induce self-amplifying cytotoxic effects against target cells.
Different Induction of PD-L1 (CD274) and PD-1 (CD279) Expression in THP-1-Differentiated Types 1 and 2 Macrophages.
Protocol for high-throughput compound screening using flow cytometry in THP-1 cells.
Ruxolitinib reverses checkpoint inhibition by reducing programmed cell death ligand-1 (PD-L1) expression and increases anti-tumour effects of T cells in multiple myeloma.
IL-27 Mediates PD-L1 Expression and Release by Human Mesothelioma Cells.
Lentiviral delivery of combinatorial CAR/CRISPRi circuit into human primary T cells is enhanced by TBK1/IKKɛ complex inhibitor BX795.
Contribution of GATA6 to homeostasis of the human upper pilosebaceous unit and acne pathogenesis.
β-Catenin induces transcriptional expression of PD-L1 to promote glioblastoma immune evasion.
TASL is the SLC15A4-associated adaptor for IRF5 activation by TLR7-9.
Cancer cell-intrinsic expression of MHC II in lung cancer cell lines is actively restricted by MEK/ERK signaling and epigenetic mechanisms.
Protein kinase D3 regulates the expression of the immunosuppressive protein, PD‑L1, through STAT1/STAT3 signaling.
TLR9 Mediated Tumor-Stroma Interactions in Human Papilloma Virus (HPV)-Positive Head and Neck Squamous Cell Carcinoma Up-Regulate PD-L1 and PD-L2.
Phospho‑STAT1 expression as a potential biomarker for anti‑PD‑1/anti‑PD‑L1 immunotherapy for breast cancer.
Quantitative Interactomics in Primary T Cells Provides a Rationale for Concomitant PD-1 and BTLA Coinhibitor Blockade in Cancer Immunotherapy.
High PD-L1 Expression Predicts for Worse Outcome of Leukemia Patients with Concomitant NPM1 and FLT3 Mutations.
PD-L1:CD80 Cis-Heterodimer Triggers the Co-stimulatory Receptor CD28 While Repressing the Inhibitory PD-1 and CTLA-4 Pathways.
CA-170 - A Potent Small-Molecule PD-L1 Inhibitor or Not?
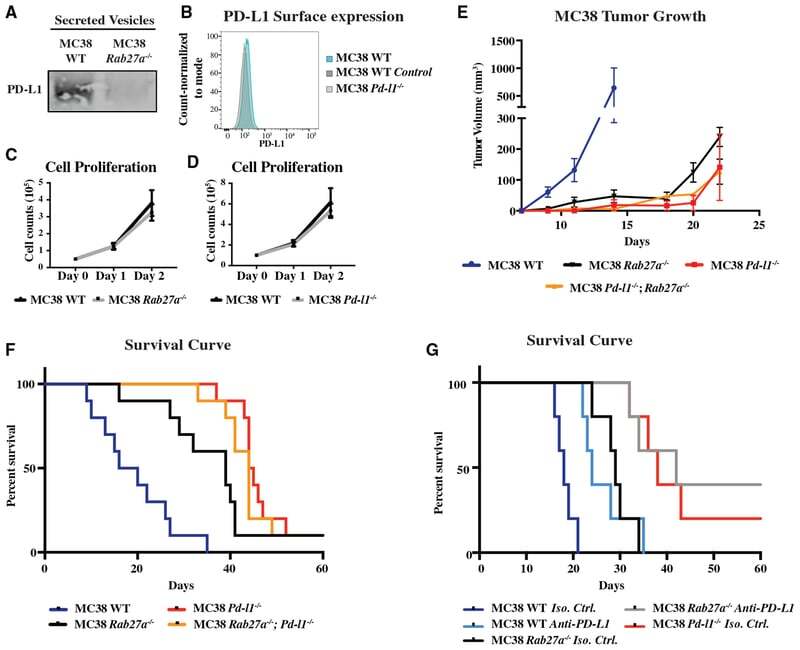
Suppression of Exosomal PD-L1 Induces Systemic Anti-tumor Immunity and Memory.
Disruption of PD-1 Enhanced the Anti-tumor Activity of Chimeric Antigen Receptor T Cells Against Hepatocellular Carcinoma.
Generation of Tumor-Reactive T Cells by Co-culture of Peripheral Blood Lymphocytes and Tumor Organoids.
Apigenin suppresses PD-L1 expression in melanoma and host dendritic cells to elicit synergistic therapeutic effects.
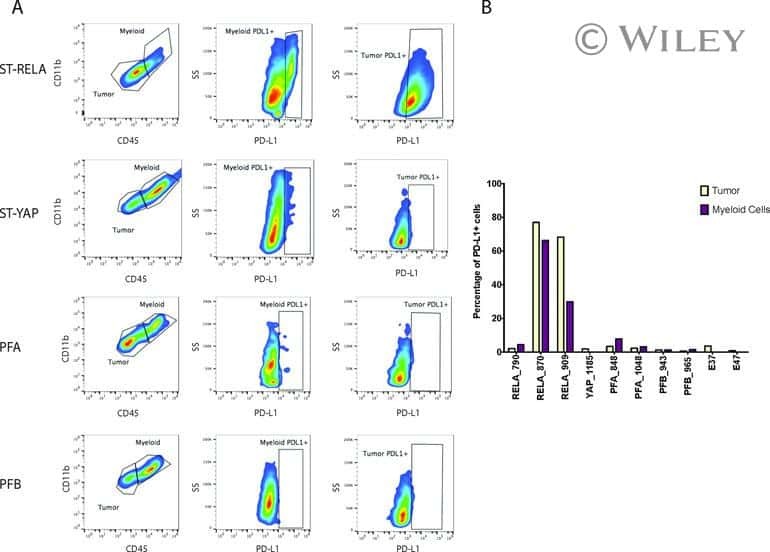
Specific expression of PD-L1 in RELA-fusion supratentorial ependymoma: Implications for PD-1-targeted therapy.
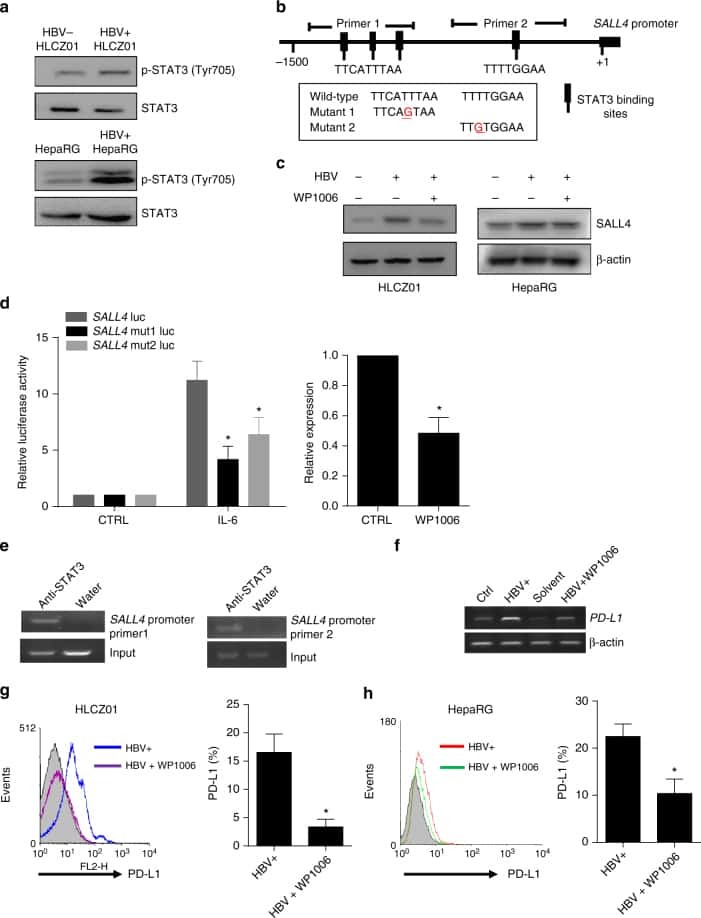
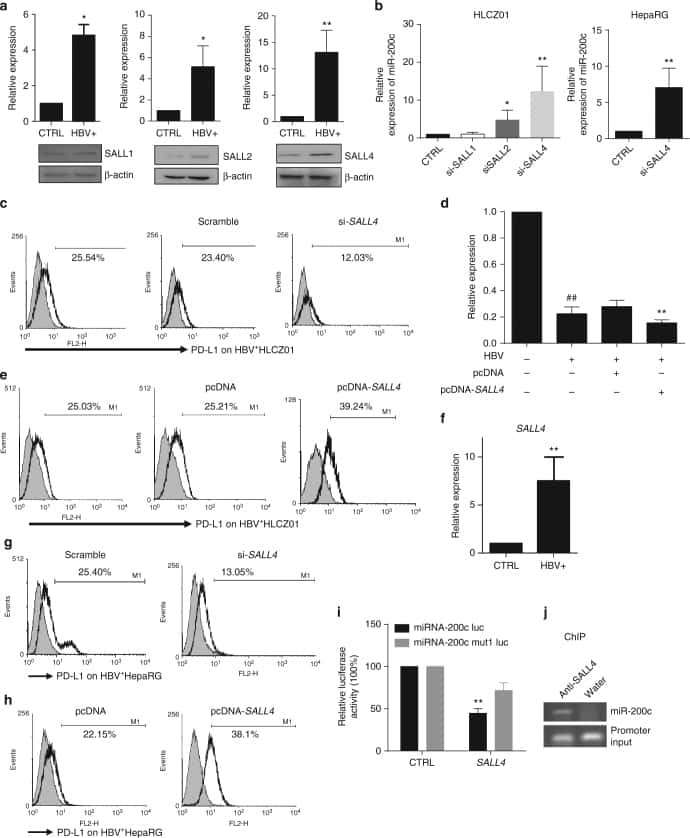
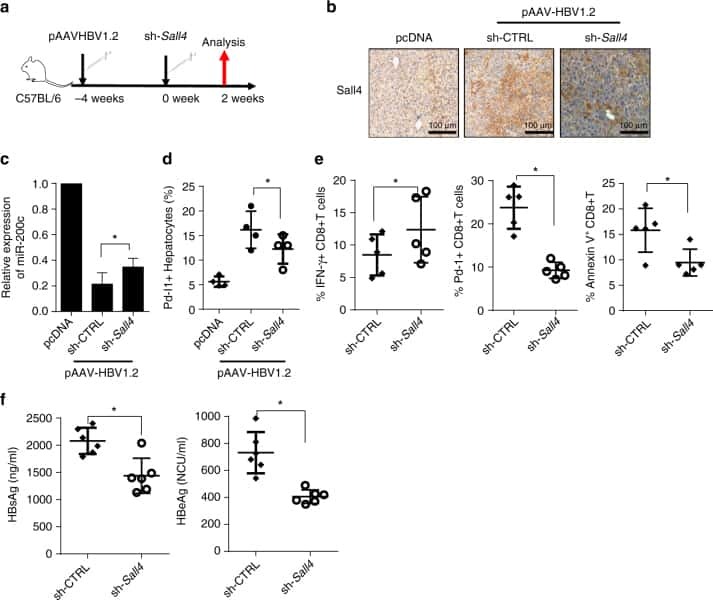
Oncofetal gene SALL4 reactivation by hepatitis B virus counteracts miR-200c in PD-L1-induced T cell exhaustion.
Dominant Role for Regulatory T Cells in Protecting Females Against Pulmonary Hypertension.
Challenging PD-L1 expressing cytotoxic T cells as a predictor for response to immunotherapy in melanoma.
Antigen-Presenting Cell-Intrinsic PD-1 Neutralizes PD-L1 in cis to Attenuate PD-1 Signaling in T Cells.
PD-1 axis expression in musculoskeletal tumors and antitumor effect of nivolumab in osteosarcoma model of humanized mouse.
Spatial and Single-Cell Transcriptional Profiling Identifies Functionally Distinct Human Dermal Fibroblast Subpopulations.
Similarities and differences between helminth parasites and cancer cell lines in shaping human monocytes: Insights into parallel mechanisms of immune evasion.
PD-L1 expression in medulloblastoma: an evaluation by subgroup.
Amplification of N-Myc is associated with a T-cell-poor microenvironment in metastatic neuroblastoma restraining interferon pathway activity and chemokine expression.
Mesenchymal Stromal Cell Secretion of Programmed Death-1 Ligands Regulates T Cell Mediated Immunosuppression.
Retroviral Replicating Vector Delivery of miR-PDL1 Inhibits Immune Checkpoint PDL1 and Enhances Immune Responses In Vitro.
Characterization and Purification of Neoplastic Cells of Nodular Lymphocyte Predominant Hodgkin Lymphoma from Lymph Nodes by Flow Cytometry and Flow Cytometric Cell Sorting.
Oncogenic RAS Signaling Promotes Tumor Immunoresistance by Stabilizing PD-L1 mRNA.
CD3xPDL1 bi-specific T cell engager (BiTE) simultaneously activates T cells and NKT cells, kills PDL1(+) tumor cells, and extends the survival of tumor-bearing humanized mice.
PD-L1/PD-1 expression and tumor-infiltrating lymphocytes in conjunctival melanoma.
Expression of programmed death 1 ligand 1 on periodontal tissue cells as a possible protective feedback mechanism against periodontal tissue destruction.
CD28 family of receptors on T cells in chronic HBV infection: Expression characteristics, clinical significance and correlations with PD-1 blockade.
Helicobacter pylori cag pathogenicity island's role in B7-H1 induction and immune evasion.
Interleukin-25 Mediates Transcriptional Control of PD-L1 via STAT3 in Multipotent Human Mesenchymal Stromal Cells (hMSCs) to Suppress Th17 Responses.
STAT3 signaling contributes to the high effector activities of interleukin-15-derived dendritic cells.
Characterization of the in vivo immune network of IDO, tryptophan metabolism, PD-L1, and CTLA-4 in circulating immune cells in melanoma.
PD-1+Tim-3+ CD8+ T Lymphocytes Display Varied Degrees of Functional Exhaustion in Patients with Regionally Metastatic Differentiated Thyroid Cancer.
T-helper 17 cell polarization in pulmonary arterial hypertension.
Clinical significance of plasmacytoid dendritic cells and myeloid-derived suppressor cells in melanoma.
Paucity of PD-L1 expression in prostate cancer: innate and adaptive immune resistance.
IL-27 induces the expression of IDO and PD-L1 in human cancer cells.
Inhibitory Receptor Expression Depends More Dominantly on Differentiation and Activation than "Exhaustion" of Human CD8 T Cells.
Alterations of immune response of Non-Small Cell Lung Cancer with Azacytidine.
Upregulation of programmed death-1 on T cells and programmed death ligand-1 on monocytes in septic shock patients.
Phagocytosis, a potential mechanism for myeloid-derived suppressor cell regulation of CD8+ T cell function mediated through programmed cell death-1 and programmed cell death-1 ligand interaction.
Ex vivo expanded hematopoietic stem cells overcome the MHC barrier in allogeneic transplantation.
The PD-1/PD-L1 axis modulates the natural killer cell versus multiple myeloma effect: a therapeutic target for CT-011, a novel monoclonal anti-PD-1 antibody.
PD-1 is a regulator of NY-ESO-1-specific CD8+ T cell expansion in melanoma patients.
Expression of B7-H1 in inflammatory renal tubular epithelial cells.
Clinical significance of programmed death-1 ligand-1 and programmed death-1 ligand-2 expression in human esophageal cancer.
Bajor M, Graczyk-Jarzynka A, Marhelava K, Burdzinska A, Muchowicz A, Goral A, Zhylko A, Soroczynska K, Retecki K, Krawczyk M, Klopotowska M, Pilch Z, Paczek L, Malmberg KJ, Wälchli S, Winiarska M, Zagozdzon R
Journal for immunotherapy of cancer 2022 Jan;10(1)
Journal for immunotherapy of cancer 2022 Jan;10(1)
Different Induction of PD-L1 (CD274) and PD-1 (CD279) Expression in THP-1-Differentiated Types 1 and 2 Macrophages.
Lai CY, Tseng PC, Chen CL, Satria RD, Wang YT, Lin CF
Journal of inflammation research 2021;14:5241-5249
Journal of inflammation research 2021;14:5241-5249
Protocol for high-throughput compound screening using flow cytometry in THP-1 cells.
Spangenberg SH, Zavareh RB, Lairson LL
STAR protocols 2021 Jun 18;2(2):100400
STAR protocols 2021 Jun 18;2(2):100400
Ruxolitinib reverses checkpoint inhibition by reducing programmed cell death ligand-1 (PD-L1) expression and increases anti-tumour effects of T cells in multiple myeloma.
Chen H, Li M, Ng N, Yu E, Bujarski S, Yin Z, Wen M, Hekmati T, Field D, Wang J, Nassir I, Yu J, Huang J, Daniely D, Wang CS, Xu N, Spektor TM, Berenson JR
British journal of haematology 2021 Feb;192(3):568-576
British journal of haematology 2021 Feb;192(3):568-576
IL-27 Mediates PD-L1 Expression and Release by Human Mesothelioma Cells.
Carbotti G, Dozin B, Martini S, Giordano C, Scordamaglia F, Croce M, Filaci G, Ferrini S, Fabbi M
Cancers 2021 Aug 9;13(16)
Cancers 2021 Aug 9;13(16)
Lentiviral delivery of combinatorial CAR/CRISPRi circuit into human primary T cells is enhanced by TBK1/IKKɛ complex inhibitor BX795.
Li L, Gao Y, Srivastava R, Wang W, Xiong Q, Fang Z, Pelayo A, Denson C, Goswami A, Harari-Steinfeld R, Yang Z, Weng L, Qi LS, Marincola FM
Journal of translational medicine 2020 Sep 23;18(1):363
Journal of translational medicine 2020 Sep 23;18(1):363
Contribution of GATA6 to homeostasis of the human upper pilosebaceous unit and acne pathogenesis.
Oulès B, Philippeos C, Segal J, Tihy M, Vietri Rudan M, Cujba AM, Grange PA, Quist S, Natsuga K, Deschamps L, Dupin N, Donati G, Watt FM
Nature communications 2020 Oct 20;11(1):5067
Nature communications 2020 Oct 20;11(1):5067
β-Catenin induces transcriptional expression of PD-L1 to promote glioblastoma immune evasion.
Du L, Lee JH, Jiang H, Wang C, Wang S, Zheng Z, Shao F, Xu D, Xia Y, Li J, Zheng Y, Qian X, Li X, Kim HR, Xing D, Liu P, Lu Z, Lyu J
The Journal of experimental medicine 2020 Nov 2;217(11)
The Journal of experimental medicine 2020 Nov 2;217(11)
TASL is the SLC15A4-associated adaptor for IRF5 activation by TLR7-9.
Heinz LX, Lee J, Kapoor U, Kartnig F, Sedlyarov V, Papakostas K, César-Razquin A, Essletzbichler P, Goldmann U, Stefanovic A, Bigenzahn JW, Scorzoni S, Pizzagalli MD, Bensimon A, Müller AC, King FJ, Li J, Girardi E, Mbow ML, Whitehurst CE, Rebsamen M, Superti-Furga G
Nature 2020 May;581(7808):316-322
Nature 2020 May;581(7808):316-322
Cancer cell-intrinsic expression of MHC II in lung cancer cell lines is actively restricted by MEK/ERK signaling and epigenetic mechanisms.
Neuwelt AJ, Kimball AK, Johnson AM, Arnold BW, Bullock BL, Kaspar RE, Kleczko EK, Kwak JW, Wu MH, Heasley LE, Doebele RC, Li HY, Nemenoff RA, Clambey ET
Journal for immunotherapy of cancer 2020 Apr;8(1)
Journal for immunotherapy of cancer 2020 Apr;8(1)
Protein kinase D3 regulates the expression of the immunosuppressive protein, PD‑L1, through STAT1/STAT3 signaling.
Cui B, Chen J, Luo M, Wang L, Chen H, Kang Y, Wang J, Zhou X, Feng Y, Zhang P
International journal of oncology 2020 Apr;56(4):909-920
International journal of oncology 2020 Apr;56(4):909-920
TLR9 Mediated Tumor-Stroma Interactions in Human Papilloma Virus (HPV)-Positive Head and Neck Squamous Cell Carcinoma Up-Regulate PD-L1 and PD-L2.
Baruah P, Bullenkamp J, Wilson POG, Lee M, Kaski JC, Dumitriu IE
Frontiers in immunology 2019;10:1644
Frontiers in immunology 2019;10:1644
Phospho‑STAT1 expression as a potential biomarker for anti‑PD‑1/anti‑PD‑L1 immunotherapy for breast cancer.
Nakayama Y, Mimura K, Tamaki T, Shiraishi K, Kua LF, Koh V, Ohmori M, Kimura A, Inoue S, Okayama H, Suzuki Y, Nakazawa T, Ichikawa D, Kono K
International journal of oncology 2019 Jun;54(6):2030-2038
International journal of oncology 2019 Jun;54(6):2030-2038
Quantitative Interactomics in Primary T Cells Provides a Rationale for Concomitant PD-1 and BTLA Coinhibitor Blockade in Cancer Immunotherapy.
Celis-Gutierrez J, Blattmann P, Zhai Y, Jarmuzynski N, Ruminski K, Grégoire C, Ounoughene Y, Fiore F, Aebersold R, Roncagalli R, Gstaiger M, Malissen B
Cell reports 2019 Jun 11;27(11):3315-3330.e7
Cell reports 2019 Jun 11;27(11):3315-3330.e7
High PD-L1 Expression Predicts for Worse Outcome of Leukemia Patients with Concomitant NPM1 and FLT3 Mutations.
Brodská B, Otevřelová P, Šálek C, Fuchs O, Gašová Z, Kuželová K
International journal of molecular sciences 2019 Jun 10;20(11)
International journal of molecular sciences 2019 Jun 10;20(11)
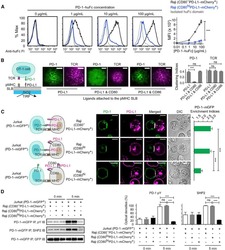
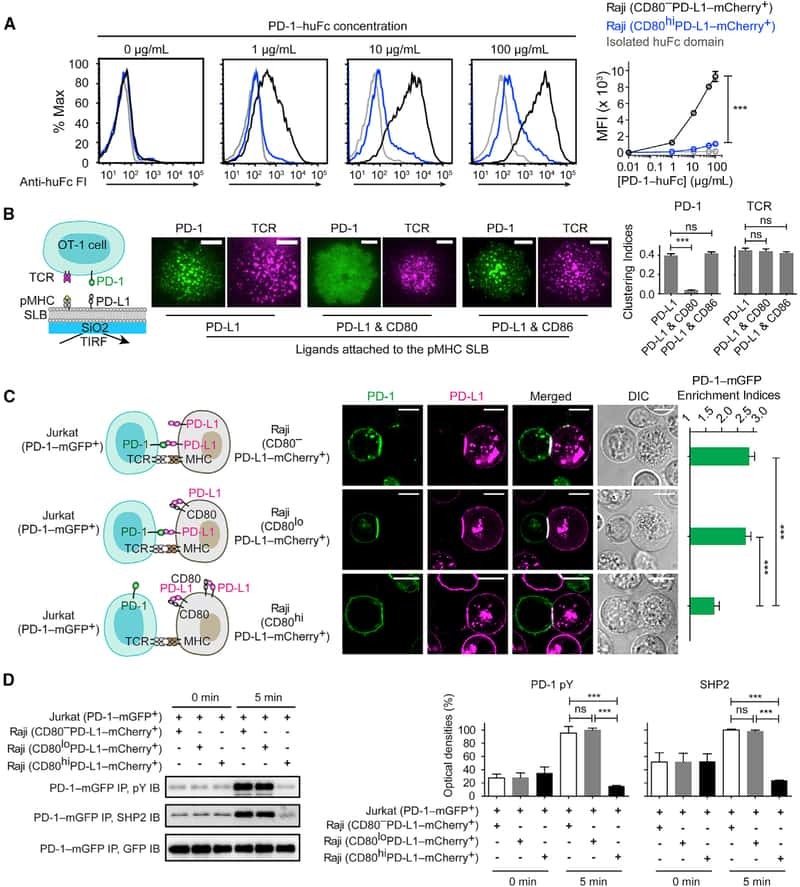
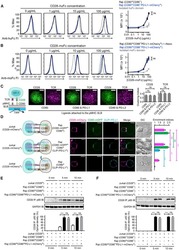
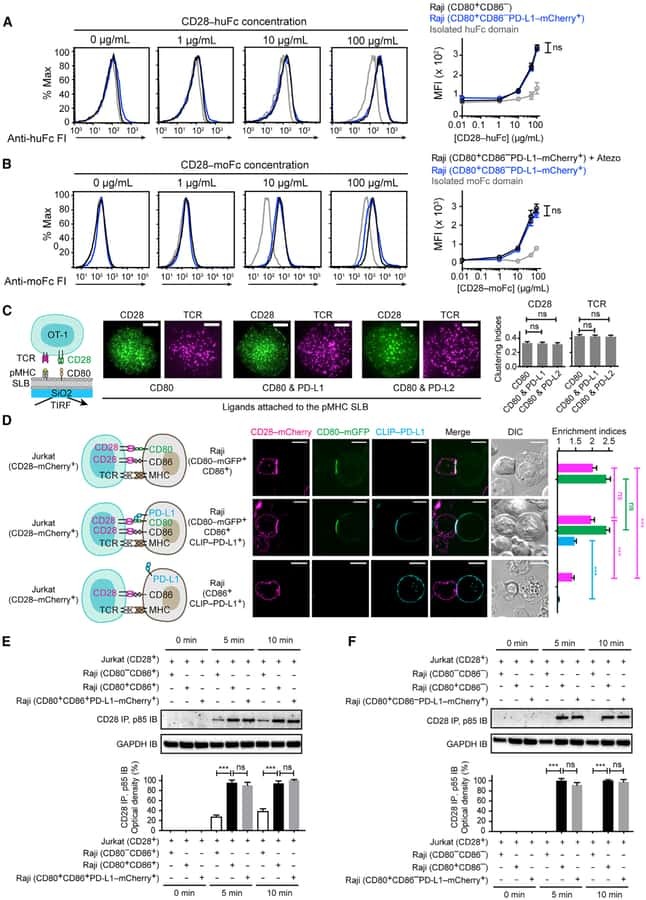
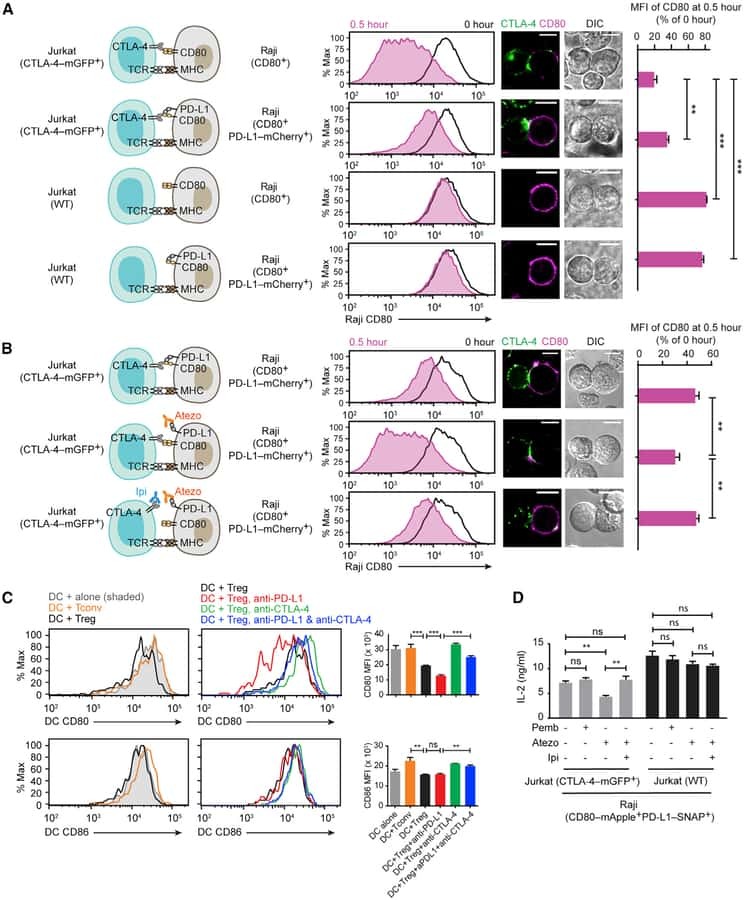
PD-L1:CD80 Cis-Heterodimer Triggers the Co-stimulatory Receptor CD28 While Repressing the Inhibitory PD-1 and CTLA-4 Pathways.
Zhao Y, Lee CK, Lin CH, Gassen RB, Xu X, Huang Z, Xiao C, Bonorino C, Lu LF, Bui JD, Hui E
Immunity 2019 Dec 17;51(6):1059-1073.e9
Immunity 2019 Dec 17;51(6):1059-1073.e9
CA-170 - A Potent Small-Molecule PD-L1 Inhibitor or Not?
Musielak B, Kocik J, Skalniak L, Magiera-Mularz K, Sala D, Czub M, Stec M, Siedlar M, Holak TA, Plewka J
Molecules (Basel, Switzerland) 2019 Aug 1;24(15)
Molecules (Basel, Switzerland) 2019 Aug 1;24(15)
Suppression of Exosomal PD-L1 Induces Systemic Anti-tumor Immunity and Memory.
Poggio M, Hu T, Pai CC, Chu B, Belair CD, Chang A, Montabana E, Lang UE, Fu Q, Fong L, Blelloch R
Cell 2019 Apr 4;177(2):414-427.e13
Cell 2019 Apr 4;177(2):414-427.e13
Disruption of PD-1 Enhanced the Anti-tumor Activity of Chimeric Antigen Receptor T Cells Against Hepatocellular Carcinoma.
Guo X, Jiang H, Shi B, Zhou M, Zhang H, Shi Z, Du G, Luo H, Wu X, Wang Y, Sun R, Li Z
Frontiers in pharmacology 2018;9:1118
Frontiers in pharmacology 2018;9:1118
Generation of Tumor-Reactive T Cells by Co-culture of Peripheral Blood Lymphocytes and Tumor Organoids.
Dijkstra KK, Cattaneo CM, Weeber F, Chalabi M, van de Haar J, Fanchi LF, Slagter M, van der Velden DL, Kaing S, Kelderman S, van Rooij N, van Leerdam ME, Depla A, Smit EF, Hartemink KJ, de Groot R, Wolkers MC, Sachs N, Snaebjornsson P, Monkhorst K, Haanen J, Clevers H, Schumacher TN, Voest EE
Cell 2018 Sep 6;174(6):1586-1598.e12
Cell 2018 Sep 6;174(6):1586-1598.e12
Apigenin suppresses PD-L1 expression in melanoma and host dendritic cells to elicit synergistic therapeutic effects.
Xu L, Zhang Y, Tian K, Chen X, Zhang R, Mu X, Wu Y, Wang D, Wang S, Liu F, Wang T, Zhang J, Liu S, Zhang Y, Tu C, Liu H
Journal of experimental & clinical cancer research : CR 2018 Oct 29;37(1):261
Journal of experimental & clinical cancer research : CR 2018 Oct 29;37(1):261
Specific expression of PD-L1 in RELA-fusion supratentorial ependymoma: Implications for PD-1-targeted therapy.
Witt DA, Donson AM, Amani V, Moreira DC, Sanford B, Hoffman LM, Handler MH, Levy JMM, Jones KL, Nellan A, Foreman NK, Griesinger AM
Pediatric blood & cancer 2018 May;65(5):e26960
Pediatric blood & cancer 2018 May;65(5):e26960
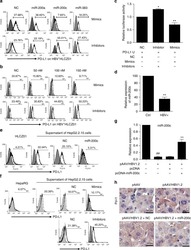
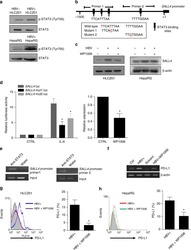
Oncofetal gene SALL4 reactivation by hepatitis B virus counteracts miR-200c in PD-L1-induced T cell exhaustion.
Sun C, Lan P, Han Q, Huang M, Zhang Z, Xu G, Song J, Wang J, Wei H, Zhang J, Sun R, Zhang C, Tian Z
Nature communications 2018 Mar 28;9(1):1241
Nature communications 2018 Mar 28;9(1):1241
Dominant Role for Regulatory T Cells in Protecting Females Against Pulmonary Hypertension.
Tamosiuniene R, Manouvakhova O, Mesange P, Saito T, Qian J, Sanyal M, Lin YC, Nguyen LP, Luria A, Tu AB, Sante JM, Rabinovitch M, Fitzgerald DJ, Graham BB, Habtezion A, Voelkel NF, Aurelian L, Nicolls MR
Circulation research 2018 Jun 8;122(12):1689-1702
Circulation research 2018 Jun 8;122(12):1689-1702
Challenging PD-L1 expressing cytotoxic T cells as a predictor for response to immunotherapy in melanoma.
Brochez L, Meireson A, Chevolet I, Sundahl N, Ost P, Kruse V
Nature communications 2018 Jul 26;9(1):2921
Nature communications 2018 Jul 26;9(1):2921
Antigen-Presenting Cell-Intrinsic PD-1 Neutralizes PD-L1 in cis to Attenuate PD-1 Signaling in T Cells.
Zhao Y, Harrison DL, Song Y, Ji J, Huang J, Hui E
Cell reports 2018 Jul 10;24(2):379-390.e6
Cell reports 2018 Jul 10;24(2):379-390.e6
PD-1 axis expression in musculoskeletal tumors and antitumor effect of nivolumab in osteosarcoma model of humanized mouse.
Zheng B, Ren T, Huang Y, Sun K, Wang S, Bao X, Liu K, Guo W
Journal of hematology & oncology 2018 Feb 6;11(1):16
Journal of hematology & oncology 2018 Feb 6;11(1):16
Spatial and Single-Cell Transcriptional Profiling Identifies Functionally Distinct Human Dermal Fibroblast Subpopulations.
Philippeos C, Telerman SB, Oulès B, Pisco AO, Shaw TJ, Elgueta R, Lombardi G, Driskell RR, Soldin M, Lynch MD, Watt FM
The Journal of investigative dermatology 2018 Apr;138(4):811-825
The Journal of investigative dermatology 2018 Apr;138(4):811-825
Similarities and differences between helminth parasites and cancer cell lines in shaping human monocytes: Insights into parallel mechanisms of immune evasion.
Narasimhan PB, Akabas L, Tariq S, Huda N, Bennuru S, Sabzevari H, Hofmeister R, Nutman TB, Tolouei Semnani R
PLoS neglected tropical diseases 2018 Apr;12(4):e0006404
PLoS neglected tropical diseases 2018 Apr;12(4):e0006404
PD-L1 expression in medulloblastoma: an evaluation by subgroup.
Martin AM, Nirschl CJ, Polanczyk MJ, Bell WR, Nirschl TR, Harris-Bookman S, Phallen J, Hicks J, Martinez D, Ogurtsova A, Xu H, Sullivan LM, Meeker AK, Raabe EH, Cohen KJ, Eberhart CG, Burger PC, Santi M, Taube JM, Pardoll DM, Drake CG, Lim M
Oncotarget 2018 Apr 10;9(27):19177-19191
Oncotarget 2018 Apr 10;9(27):19177-19191
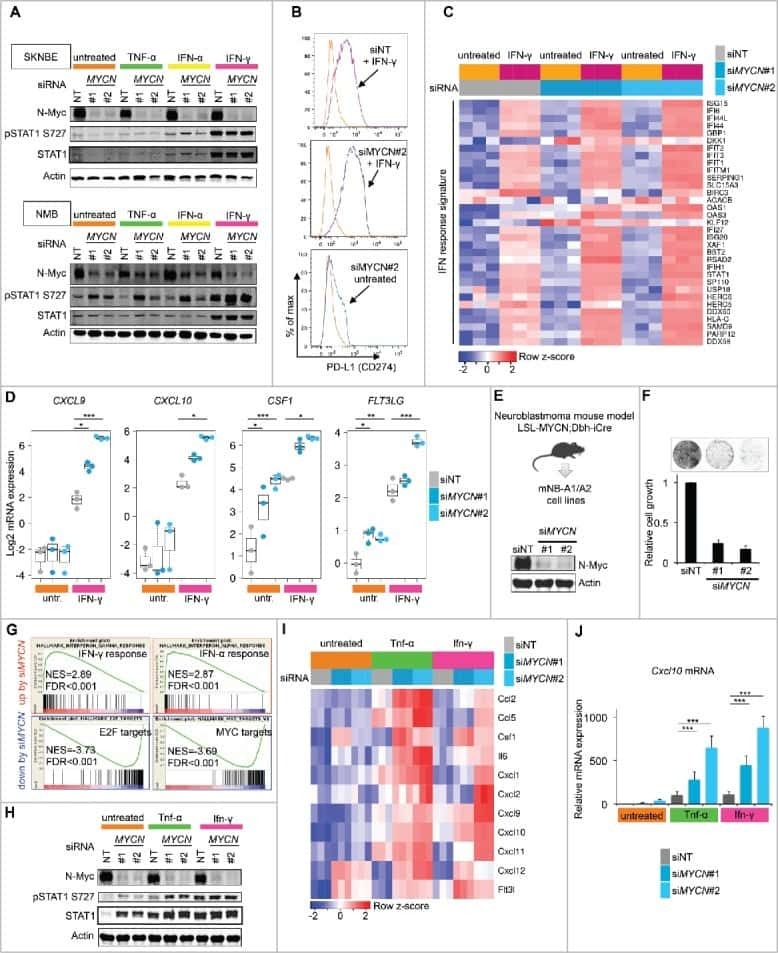
Amplification of N-Myc is associated with a T-cell-poor microenvironment in metastatic neuroblastoma restraining interferon pathway activity and chemokine expression.
Layer JP, Kronmüller MT, Quast T, van den Boorn-Konijnenberg D, Effern M, Hinze D, Althoff K, Schramm A, Westermann F, Peifer M, Hartmann G, Tüting T, Kolanus W, Fischer M, Schulte J, Hölzel M
Oncoimmunology 2017;6(6):e1320626
Oncoimmunology 2017;6(6):e1320626
Mesenchymal Stromal Cell Secretion of Programmed Death-1 Ligands Regulates T Cell Mediated Immunosuppression.
Davies LC, Heldring N, Kadri N, Le Blanc K
Stem cells (Dayton, Ohio) 2017 Mar;35(3):766-776
Stem cells (Dayton, Ohio) 2017 Mar;35(3):766-776
Retroviral Replicating Vector Delivery of miR-PDL1 Inhibits Immune Checkpoint PDL1 and Enhances Immune Responses In Vitro.
Lin AH, Twitty CG, Burnett R, Hofacre A, Mitchell LA, Espinoza FL, Gruber HE, Jolly DJ
Molecular therapy. Nucleic acids 2017 Mar 17;6:221-232
Molecular therapy. Nucleic acids 2017 Mar 17;6:221-232
Characterization and Purification of Neoplastic Cells of Nodular Lymphocyte Predominant Hodgkin Lymphoma from Lymph Nodes by Flow Cytometry and Flow Cytometric Cell Sorting.
Fromm JR, Thomas A, Wood BL
The American journal of pathology 2017 Feb;187(2):304-317
The American journal of pathology 2017 Feb;187(2):304-317
Oncogenic RAS Signaling Promotes Tumor Immunoresistance by Stabilizing PD-L1 mRNA.
Coelho MA, de Carné Trécesson S, Rana S, Zecchin D, Moore C, Molina-Arcas M, East P, Spencer-Dene B, Nye E, Barnouin K, Snijders AP, Lai WS, Blackshear PJ, Downward J
Immunity 2017 Dec 19;47(6):1083-1099.e6
Immunity 2017 Dec 19;47(6):1083-1099.e6
CD3xPDL1 bi-specific T cell engager (BiTE) simultaneously activates T cells and NKT cells, kills PDL1(+) tumor cells, and extends the survival of tumor-bearing humanized mice.
Horn LA, Ciavattone NG, Atkinson R, Woldergerima N, Wolf J, Clements VK, Sinha P, Poudel M, Ostrand-Rosenberg S
Oncotarget 2017 Aug 29;8(35):57964-57980
Oncotarget 2017 Aug 29;8(35):57964-57980
PD-L1/PD-1 expression and tumor-infiltrating lymphocytes in conjunctival melanoma.
Cao J, Brouwer NJ, Richards KE, Marinkovic M, van Duinen S, Hurkmans D, Verdegaal EME, Jordanova ES, Jager MJ
Oncotarget 2017 Aug 15;8(33):54722-54734
Oncotarget 2017 Aug 15;8(33):54722-54734
Expression of programmed death 1 ligand 1 on periodontal tissue cells as a possible protective feedback mechanism against periodontal tissue destruction.
Zhang J, Wang CM, Zhang P, Wang X, Chen J, Yang J, Lu W, Zhou W, Yuan W, Feng Y
Molecular medicine reports 2016 Mar;13(3):2423-30
Molecular medicine reports 2016 Mar;13(3):2423-30
CD28 family of receptors on T cells in chronic HBV infection: Expression characteristics, clinical significance and correlations with PD-1 blockade.
Tang ZS, Hao YH, Zhang EJ, Xu CL, Zhou Y, Zheng X, Yang DL
Molecular medicine reports 2016 Aug;14(2):1107-16
Molecular medicine reports 2016 Aug;14(2):1107-16
Helicobacter pylori cag pathogenicity island's role in B7-H1 induction and immune evasion.
Lina TT, Alzahrani S, House J, Yamaoka Y, Sharpe AH, Rampy BA, Pinchuk IV, Reyes VE
PloS one 2015;10(3):e0121841
PloS one 2015;10(3):e0121841
Interleukin-25 Mediates Transcriptional Control of PD-L1 via STAT3 in Multipotent Human Mesenchymal Stromal Cells (hMSCs) to Suppress Th17 Responses.
Wang WB, Yen ML, Liu KJ, Hsu PJ, Lin MH, Chen PM, Sudhir PR, Chen CH, Chen CH, Sytwu HK, Yen BL
Stem cell reports 2015 Sep 8;5(3):392-404
Stem cell reports 2015 Sep 8;5(3):392-404
STAT3 signaling contributes to the high effector activities of interleukin-15-derived dendritic cells.
Okada S, Han S, Patel ES, Yang LJ, Chang LJ
Immunology and cell biology 2015 May-Jun;93(5):461-71
Immunology and cell biology 2015 May-Jun;93(5):461-71
Characterization of the in vivo immune network of IDO, tryptophan metabolism, PD-L1, and CTLA-4 in circulating immune cells in melanoma.
Chevolet I, Speeckaert R, Schreuer M, Neyns B, Krysko O, Bachert C, Hennart B, Allorge D, van Geel N, Van Gele M, Brochez L
Oncoimmunology 2015 Mar;4(3):e982382
Oncoimmunology 2015 Mar;4(3):e982382
PD-1+Tim-3+ CD8+ T Lymphocytes Display Varied Degrees of Functional Exhaustion in Patients with Regionally Metastatic Differentiated Thyroid Cancer.
Severson JJ, Serracino HS, Mateescu V, Raeburn CD, McIntyre RC Jr, Sams SB, Haugen BR, French JD
Cancer immunology research 2015 Jun;3(6):620-30
Cancer immunology research 2015 Jun;3(6):620-30
T-helper 17 cell polarization in pulmonary arterial hypertension.
Hautefort A, Girerd B, Montani D, Cohen-Kaminsky S, Price L, Lambrecht BN, Humbert M, Perros F
Chest 2015 Jun;147(6):1610-1620
Chest 2015 Jun;147(6):1610-1620
Clinical significance of plasmacytoid dendritic cells and myeloid-derived suppressor cells in melanoma.
Chevolet I, Speeckaert R, Schreuer M, Neyns B, Krysko O, Bachert C, Van Gele M, van Geel N, Brochez L
Journal of translational medicine 2015 Jan 16;13:9
Journal of translational medicine 2015 Jan 16;13:9
Paucity of PD-L1 expression in prostate cancer: innate and adaptive immune resistance.
Martin AM, Nirschl TR, Nirschl CJ, Francica BJ, Kochel CM, van Bokhoven A, Meeker AK, Lucia MS, Anders RA, DeMarzo AM, Drake CG
Prostate cancer and prostatic diseases 2015 Dec;18(4):325-32
Prostate cancer and prostatic diseases 2015 Dec;18(4):325-32
IL-27 induces the expression of IDO and PD-L1 in human cancer cells.
Carbotti G, Barisione G, Airoldi I, Mezzanzanica D, Bagnoli M, Ferrero S, Petretto A, Fabbi M, Ferrini S
Oncotarget 2015 Dec 22;6(41):43267-80
Oncotarget 2015 Dec 22;6(41):43267-80
Inhibitory Receptor Expression Depends More Dominantly on Differentiation and Activation than "Exhaustion" of Human CD8 T Cells.
Legat A, Speiser DE, Pircher H, Zehn D, Fuertes Marraco SA
Frontiers in immunology 2013;4:455
Frontiers in immunology 2013;4:455
Alterations of immune response of Non-Small Cell Lung Cancer with Azacytidine.
Wrangle J, Wang W, Koch A, Easwaran H, Mohammad HP, Vendetti F, Vancriekinge W, Demeyer T, Du Z, Parsana P, Rodgers K, Yen RW, Zahnow CA, Taube JM, Brahmer JR, Tykodi SS, Easton K, Carvajal RD, Jones PA, Laird PW, Weisenberger DJ, Tsai S, Juergens RA, Topalian SL, Rudin CM, Brock MV, Pardoll D, Baylin SB
Oncotarget 2013 Nov;4(11):2067-79
Oncotarget 2013 Nov;4(11):2067-79
Upregulation of programmed death-1 on T cells and programmed death ligand-1 on monocytes in septic shock patients.
Zhang Y, Li J, Lou J, Zhou Y, Bo L, Zhu J, Zhu K, Wan X, Cai Z, Deng X
Critical care (London, England) 2011;15(1):R70
Critical care (London, England) 2011;15(1):R70
Phagocytosis, a potential mechanism for myeloid-derived suppressor cell regulation of CD8+ T cell function mediated through programmed cell death-1 and programmed cell death-1 ligand interaction.
Kim YJ, Park SJ, Broxmeyer HE
Journal of immunology (Baltimore, Md. : 1950) 2011 Sep 1;187(5):2291-301
Journal of immunology (Baltimore, Md. : 1950) 2011 Sep 1;187(5):2291-301
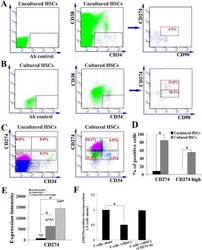
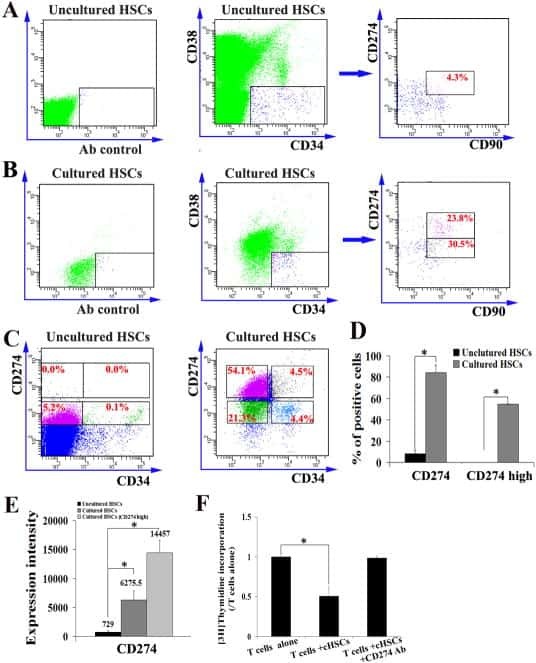
Ex vivo expanded hematopoietic stem cells overcome the MHC barrier in allogeneic transplantation.
Zheng J, Umikawa M, Zhang S, Huynh H, Silvany R, Chen BP, Chen L, Zhang CC
Cell stem cell 2011 Aug 5;9(2):119-30
Cell stem cell 2011 Aug 5;9(2):119-30
The PD-1/PD-L1 axis modulates the natural killer cell versus multiple myeloma effect: a therapeutic target for CT-011, a novel monoclonal anti-PD-1 antibody.
Benson DM Jr, Bakan CE, Mishra A, Hofmeister CC, Efebera Y, Becknell B, Baiocchi RA, Zhang J, Yu J, Smith MK, Greenfield CN, Porcu P, Devine SM, Rotem-Yehudar R, Lozanski G, Byrd JC, Caligiuri MA
Blood 2010 Sep 30;116(13):2286-94
Blood 2010 Sep 30;116(13):2286-94
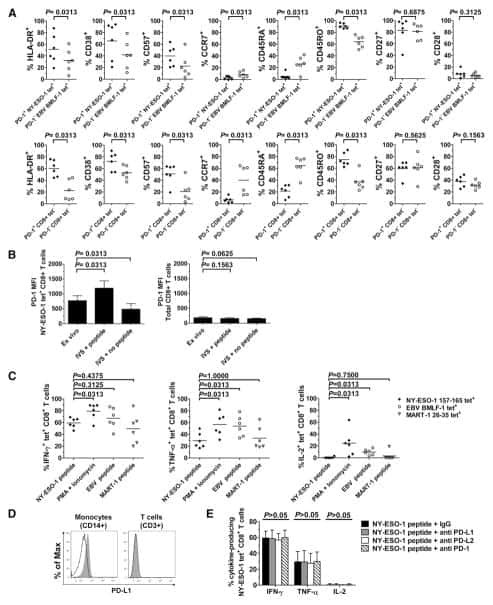
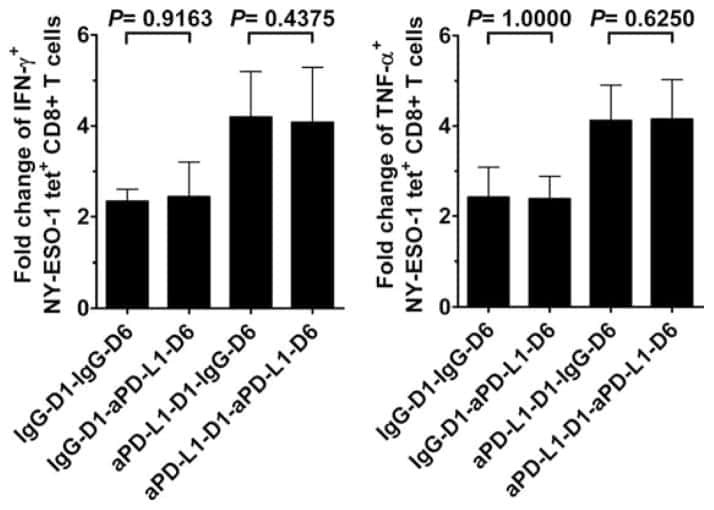
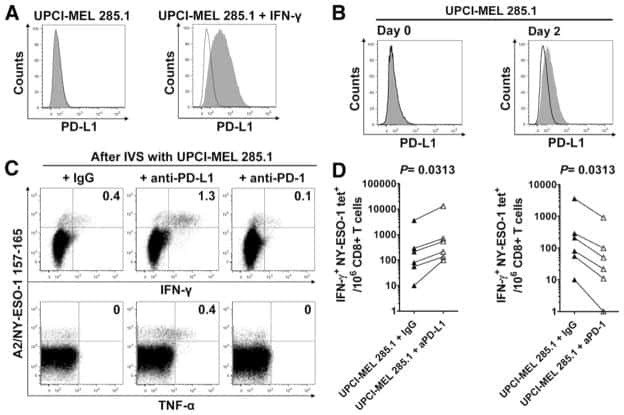
PD-1 is a regulator of NY-ESO-1-specific CD8+ T cell expansion in melanoma patients.
Fourcade J, Kudela P, Sun Z, Shen H, Land SR, Lenzner D, Guillaume P, Luescher IF, Sander C, Ferrone S, Kirkwood JM, Zarour HM
Journal of immunology (Baltimore, Md. : 1950) 2009 May 1;182(9):5240-9
Journal of immunology (Baltimore, Md. : 1950) 2009 May 1;182(9):5240-9
Expression of B7-H1 in inflammatory renal tubular epithelial cells.
Chen Y, Zhang J, Li J, Zou L, Zhao T, Tang Y, Wu Y
Nephron. Experimental nephrology 2006;102(3-4):e81-92
Nephron. Experimental nephrology 2006;102(3-4):e81-92
Clinical significance of programmed death-1 ligand-1 and programmed death-1 ligand-2 expression in human esophageal cancer.
Ohigashi Y, Sho M, Yamada Y, Tsurui Y, Hamada K, Ikeda N, Mizuno T, Yoriki R, Kashizuka H, Yane K, Tsushima F, Otsuki N, Yagita H, Azuma M, Nakajima Y
Clinical cancer research : an official journal of the American Association for Cancer Research 2005 Apr 15;11(8):2947-53
Clinical cancer research : an official journal of the American Association for Cancer Research 2005 Apr 15;11(8):2947-53
No comments: Submit comment
Supportive validation
- Submitted by
- Invitrogen Antibodies (provider)
- Main image

- Experimental details
- Staining of unstimulated (left) or PHA-stimulated (right) normal human peripheral blood cells with Mouse IgG1 K Isotype Control PE-Cyanine7 (Product # 25-4714-80) (blue histogram) or Anti-Human CD274 (B7-H1) PE-Cyanine7 (purple histogram). Total viable cells were used for analysis.

Supportive validation
- Submitted by
- Invitrogen Antibodies (provider)
- Main image

- Experimental details
- NULL

- Submitted by
- Invitrogen Antibodies (provider)
- Main image
- Experimental details
- NULL

- Submitted by
- Invitrogen Antibodies (provider)
- Main image

- Experimental details
- NULL
- Submitted by
- Invitrogen Antibodies (provider)
- Main image

- Experimental details
- NULL
- Submitted by
- Invitrogen Antibodies (provider)
- Main image

- Experimental details
- NULL
- Submitted by
- Invitrogen Antibodies (provider)
- Main image
- Experimental details
- NULL
- Submitted by
- Invitrogen Antibodies (provider)
- Main image
- Experimental details
- NULL

- Submitted by
- Invitrogen Antibodies (provider)
- Main image

- Experimental details
- NULL
- Submitted by
- Invitrogen Antibodies (provider)
- Main image
- Experimental details
- NULL

- Submitted by
- Invitrogen Antibodies (provider)
- Main image

- Experimental details
- NULL
- Submitted by
- Invitrogen Antibodies (provider)
- Main image
- Experimental details
- NULL
- Submitted by
- Invitrogen Antibodies (provider)
- Main image
- Experimental details
- NULL
- Submitted by
- Invitrogen Antibodies (provider)
- Main image
- Experimental details
- NULL

- Submitted by
- Invitrogen Antibodies (provider)
- Main image
- Experimental details
- NULL
- Submitted by
- Invitrogen Antibodies (provider)
- Main image
- Experimental details
- NULL

- Submitted by
- Invitrogen Antibodies (provider)
- Main image
- Experimental details
- NULL
- Submitted by
- Invitrogen Antibodies (provider)
- Main image

- Experimental details
- NULL
- Submitted by
- Invitrogen Antibodies (provider)
- Main image

- Experimental details
- NULL
- Submitted by
- Invitrogen Antibodies (provider)
- Main image
- Experimental details
- NULL
- Submitted by
- Invitrogen Antibodies (provider)
- Main image
- Experimental details
- NULL
- Submitted by
- Invitrogen Antibodies (provider)
- Main image
- Experimental details
- NULL
- Submitted by
- Invitrogen Antibodies (provider)
- Main image
- Experimental details
- NULL

- Submitted by
- Invitrogen Antibodies (provider)
- Main image
- Experimental details
- NULL
- Submitted by
- Invitrogen Antibodies (provider)
- Main image
- Experimental details
- NULL
- Submitted by
- Invitrogen Antibodies (provider)
- Main image
- Experimental details
- NULL
- Submitted by
- Invitrogen Antibodies (provider)
- Main image
- Experimental details
- NULL

- Submitted by
- Invitrogen Antibodies (provider)
- Main image

- Experimental details
- NULL
- Submitted by
- Invitrogen Antibodies (provider)
- Main image
- Experimental details
- NULL

- Submitted by
- Invitrogen Antibodies (provider)
- Main image
- Experimental details
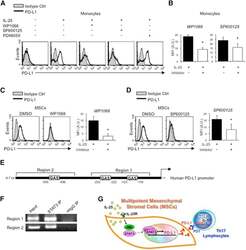
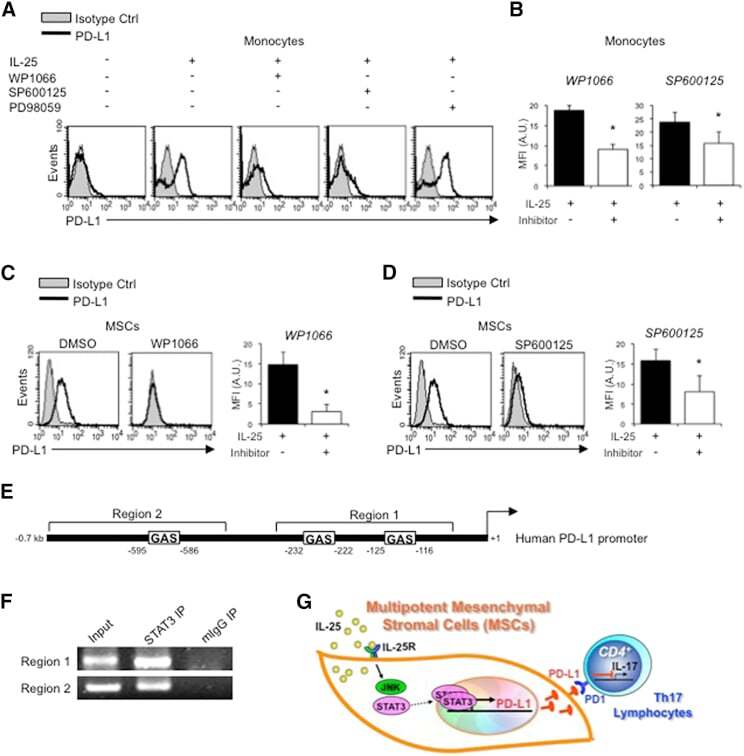
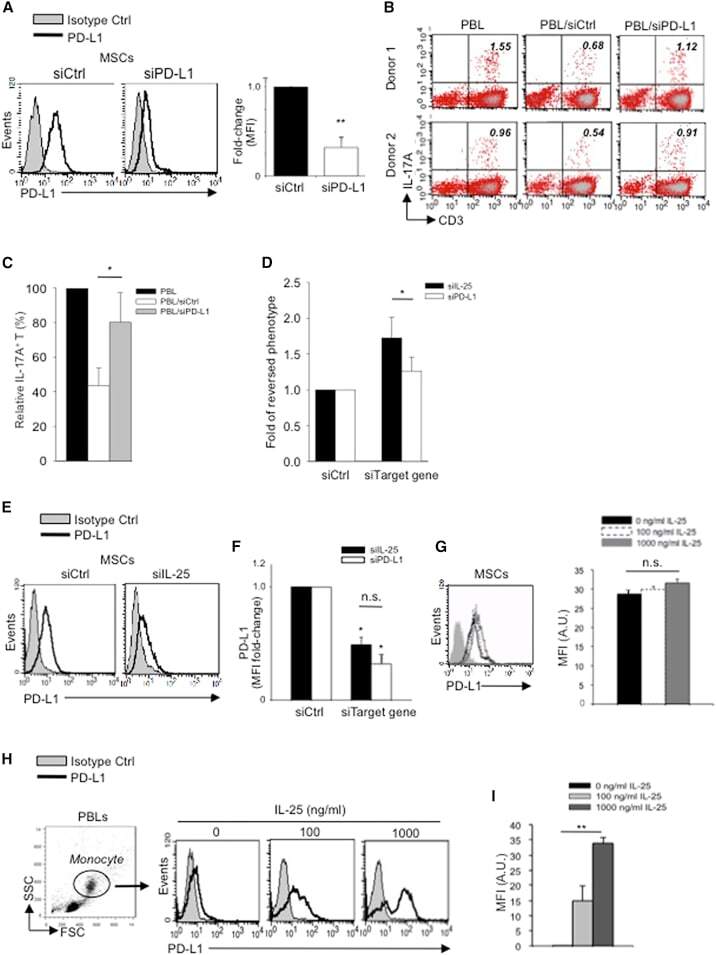
- Figure 6 IL-25-Mediated PD-L1 Expression in Human Monocytes and hMSCs Is Mediated through JNK and STAT3, with STAT3 Involved in Transcriptional Control of PD-L1 (A) Human PBLs were pretreated with inhibitors of STAT3 (WP1066; 2.5 muM), JNK (SP600125; 25 muM), or MEK1 (PD98059; 20 muM) prior to 100 ng/ml rhIL-25 for 18 hr, with subsequent flow cytometric analysis for PD-L1 surface expression on monocytes, gated using FSC and SSC. Filled histograms represent isotype control; unfilled histograms represent PD-L1 antibody staining. (B-D) Pooled data (three donors) are shown (B) with bars representing MFI. hMSCs were treated with inhibitors of STAT3 (C; WP1066, 2.5 muM) and JNK (D; SP600125, 25 muM) for 6 hr, and subsequently assessed by flow cytometric analysis for PD-L1 surface expression. Pooled data (all three donors) for each respective inhibitor are provided (left charts) with bars representing MFI. (E) Putative GAS elements (STAT-binding sites) in the proximal promoter region of human PD-L1 gene (700 bp region upstream from the transcription start site), as determined with TFSearch web-based software. (F) Binding of STAT3 or IgG (negative control) in hMSCs was analyzed by chromatin immunoprecipitation (ChIP) with promoter-specific primers for region 1 and region 2. The input samples (positive control) represent 1% starting chromatin. (G) Schematic shows a model of hMSC-mediated suppression of Th17 responses involving the IL-25/STAT3/PD-L1 axis.
- Submitted by
- Invitrogen Antibodies (provider)
- Main image
- Experimental details
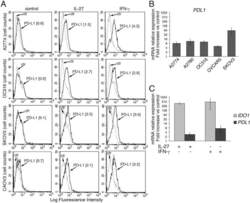
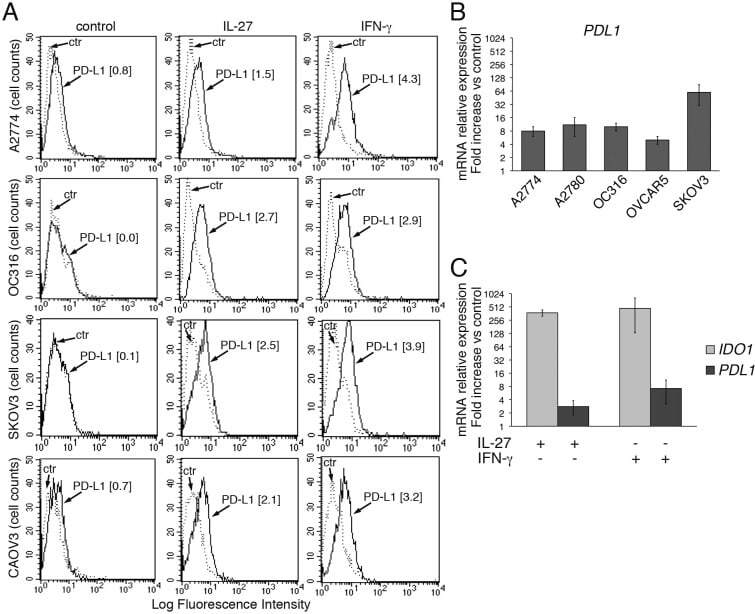
- Figure 2 IL-27 increases PD-L1 surface protein and mRNA expression in EOC cells in vitro A. FACS analysis of surface PD-L1 expression in four EOC cell lines, cultured in the presence of medium (control), IL-27 or IFN-gamma. Dotted lines are isotype-matched unrelated Ig staining controls. Numbers in brackets are Median Fluorescence Intensity (MFI) values calculated as median PD-L1 minus median Ig control. Data are representative of two independent experiments showing similar results. B. QRT-PCR analysis of PDL1 mRNA expression in five IL-27-stimulated EOC cells relative to untreated cells. Data are the mean (+-SD) of three independent experiments. C. Comparative analysis of IDO1 and PDL1 mRNA up-regulation by IL-27 or IFN-gamma in a representative EOC cell line (CAOV3). Data are the mean of two independent replicates and are expressed as DeltaDeltaCT-fold change. Error bars represent the minimum and maximum.
- Submitted by
- Invitrogen Antibodies (provider)
- Main image
- Experimental details
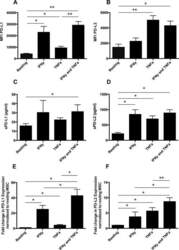
- Figure 1 Mesenchymal stromal cell (MSC) cell surface expression and secretion of PD-L1 and PD-L2 are potentiated by pro-inflammatory cytokines, IFNgamma and TNFalpha. MSCs ( n = 4) were exposed to 100 U/ml IFNgamma and 10 ng/ml TNFalpha for 3 days in culture. Cell surface expression (MFI) of (A) PD-L1 and (B) PD-L2 was assessed by flow cytometry. Secretion of (C) soluble (s)PD-L1 and (D) sPD-L2 within the conditioned media of stimulated cells was assessed by ELISA. Bar charts indicate mean +- SEM. Transcriptional regulation of (E) PD-L1 and (F) PD-L2 were assessed by qRT-PCR. mRNA data are expressed as fold change compared to unstimulated, resting MSCs +- SEM. *, p < .05; **, p < .01. Abbreviations: IFNgamma, Interferon gamma; MFI, mean fluorescence intensity; PD-L1 and PD-L2, programmed death 1 ligands 1 and 2; TNFalpha, tumor necrosis factor alpha.

- Submitted by
- Invitrogen Antibodies (provider)
- Main image
- Experimental details
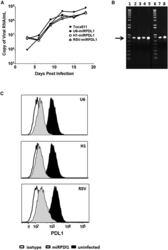
- Figure 4 RRV-RSV-miRPDL1 and RRV-H1-miRPDL1 Exhibit Comparable PDL1 Downregulation Activity as RRV-miRPDL1 (A) Replication kinetics of RRV-RSV-miRPDL1 and RRV-H1-miRPDL1. The viral genome in the supernatants of infected LN-18 cells (MOI of 0.1) at indicated time points were quantified by qRT-PCR using primer set targeted to the env region ( Figure 1 ). RRV-yCD2 and RRV-miRPDL1 (indicated as U6-miRPDL1 in the graph) were included as positive controls. (B) Vector stability of RRV-RSV-miRPDL1 and RRV-H1-miRPDL1 in LN-18 cells was analyzed by endpoint PCR at 14 and 30 days post infection. Lanes 1 and 6: DNA molecular marker (1 Kb Plus marker, Invitrogen); lanes 2, 4, and 7 are positive controls using the corresponding plasmid DNA as the templates; lane 3: RRV-H1-miRPDL1; lane 5: RRV-RSV-miRPDL1; and lane 8: RRV-miRPDL1. The arrow indicates the expected size of the PCR products. (C) LN-18 cells infected with RRV-miRPDL1 (U6), RRV-H1-miRPDL1 (H1), and RRV-RSV-miRPDL1 (RSV) were stained for PDL1 cell surface expression with PDL1 antibody and analyzed by flow cytometry.

- Submitted by
- Invitrogen Antibodies (provider)
- Main image
- Experimental details
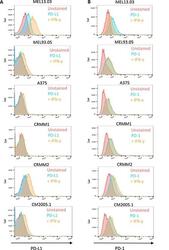
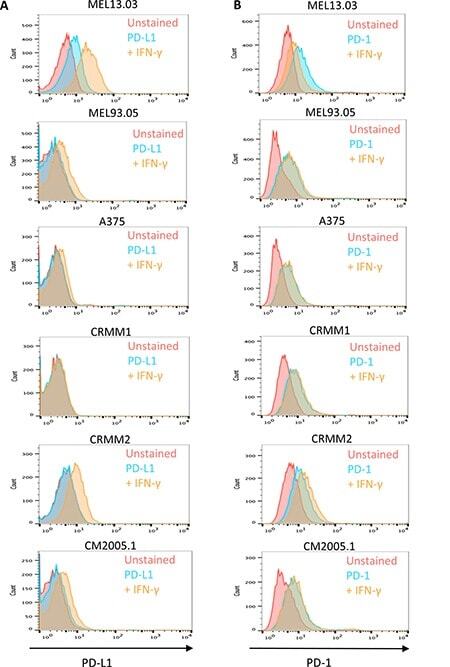
- Figure 6 Cutaneous (MEL13.03, MEL93.05 and A375) and conjunctival melanoma (CRMM1, CRMM2 and CM2005.1) cell lines express various levels of PD-L1 and PD-1 MEL13.03 is the positive control cell line for both PD-L1 and PD-1. Representative histograms show ( A ) PD-L1 and PD-1 ( B ) expression in cell lines with or without IFN-gamma (100 IU/ml) exposure for 48 h. Pink, blue and brown shaded histograms represent unstained, PD-L1 (PD-1) staining, and the effect of IFN-gamma stimulation on PD-L1 and PD-1, respectively.
- Submitted by
- Invitrogen Antibodies (provider)
- Main image

- Experimental details
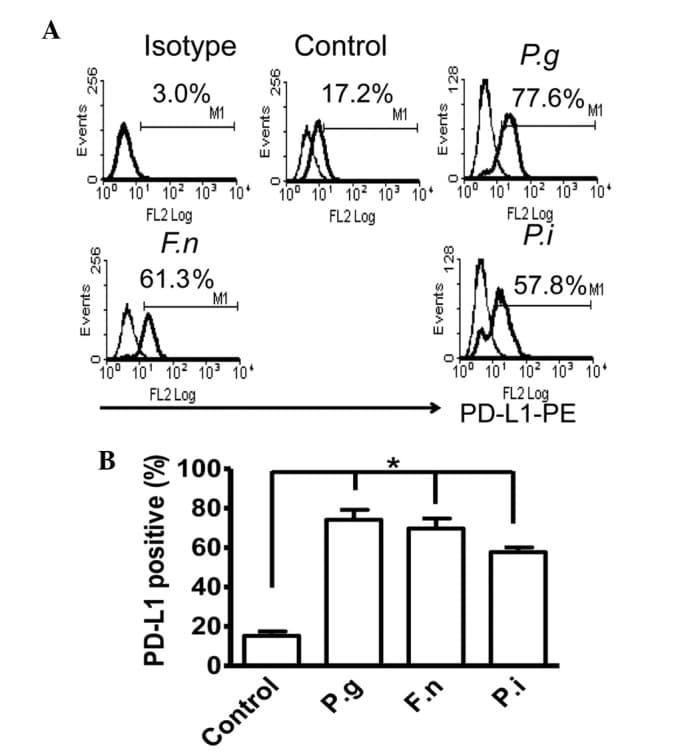
- Figure 2 Common periodontal pathogens induce the expression of PD-L1 on PDLCs. (A) Flow cytometry histogram overlays of PDLCs co-cultured with P.g , F.n and P.i . (B) Comparison of expression levels of PD-L1 induced by P.g, F.n and P.i. Data are expressed as the mean +- standard error of the mean of three independent experiments. All three strains significantly increased the expression of PD-L1 on the PDLCs, * P
- Submitted by
- Invitrogen Antibodies (provider)
- Main image
- Experimental details
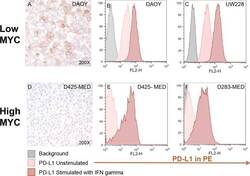
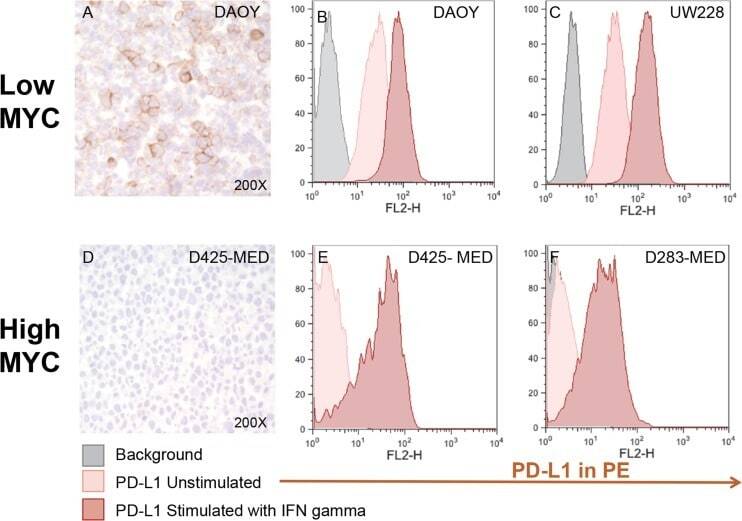
- Figure 4 Medulloblastoma cell lines express PD-L1 in a subgroup dependent manner PD-L1 expression in low and high MYC MB cell lines. Paraffin embedded cell line pellets stained for PD-L1 in DAOY ( A ) and D425-MED ( D ). Histograms of PD-L1 expression by flow cytometry using phycoerythrin (PE) conjugated MIH1 clone of PD-L1 (EBioscience) with and without IFN-gamma stimulation in DAOY ( B ), UW228 ( C ), D425-MED ( E ), and D283-MED ( F ).
- Submitted by
- Invitrogen Antibodies (provider)
- Main image
- Experimental details
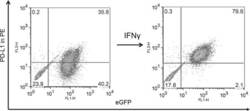
- Figure 5 MYC overexpression in DAOY (YM21) does not alter PD-L1 expression Dot Plots of PD-L1 expression by flow cytometry using PE-conjugated MIH1 clone of PD-L1 (EBioscience) in YM21 construct made by overexpressing MYC in DAOY via stable lentiviral transfection.

- Submitted by
- Invitrogen Antibodies (provider)
- Main image
- Experimental details
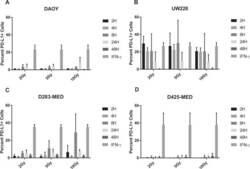
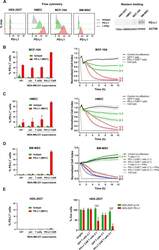
- Figure 6 Radiation induces PD-L1 in most medulloblastoma cell lines Bar graph depicts percent PD-L1 positive cells above baseline as determined by flow cytometry using PE-conjugated MIH1 clone of PD-L1 (EBioscience) in DAOY ( A ), UW228 ( B ), D283-MED ( C ), and D425-MED ( D ) after irradiation with 2, 5, or 10 Gy at 2, 4, 8, 24, and 48 hours. IFN-gamma values were obtained without radiation. Each bar graph depicts findings from 2 different experiments where all data points were repeated. Error bars represent standard deviation of the mean. Levels of PD-L1 that were comparable to those induced by IFN-gamma included UW228 hours 2-24 at 2, 5 and 10 Gy and D283-MED at hour 8, 10 Gy. All other values were significantly less than those induced by IFN-gamma as determined by 2-way ANOVA corrected for multiple comparisons. Full statistical analysis available in Supplementary Table 1-1-1-4 .

- Submitted by
- Invitrogen Antibodies (provider)
- Main image
- Experimental details
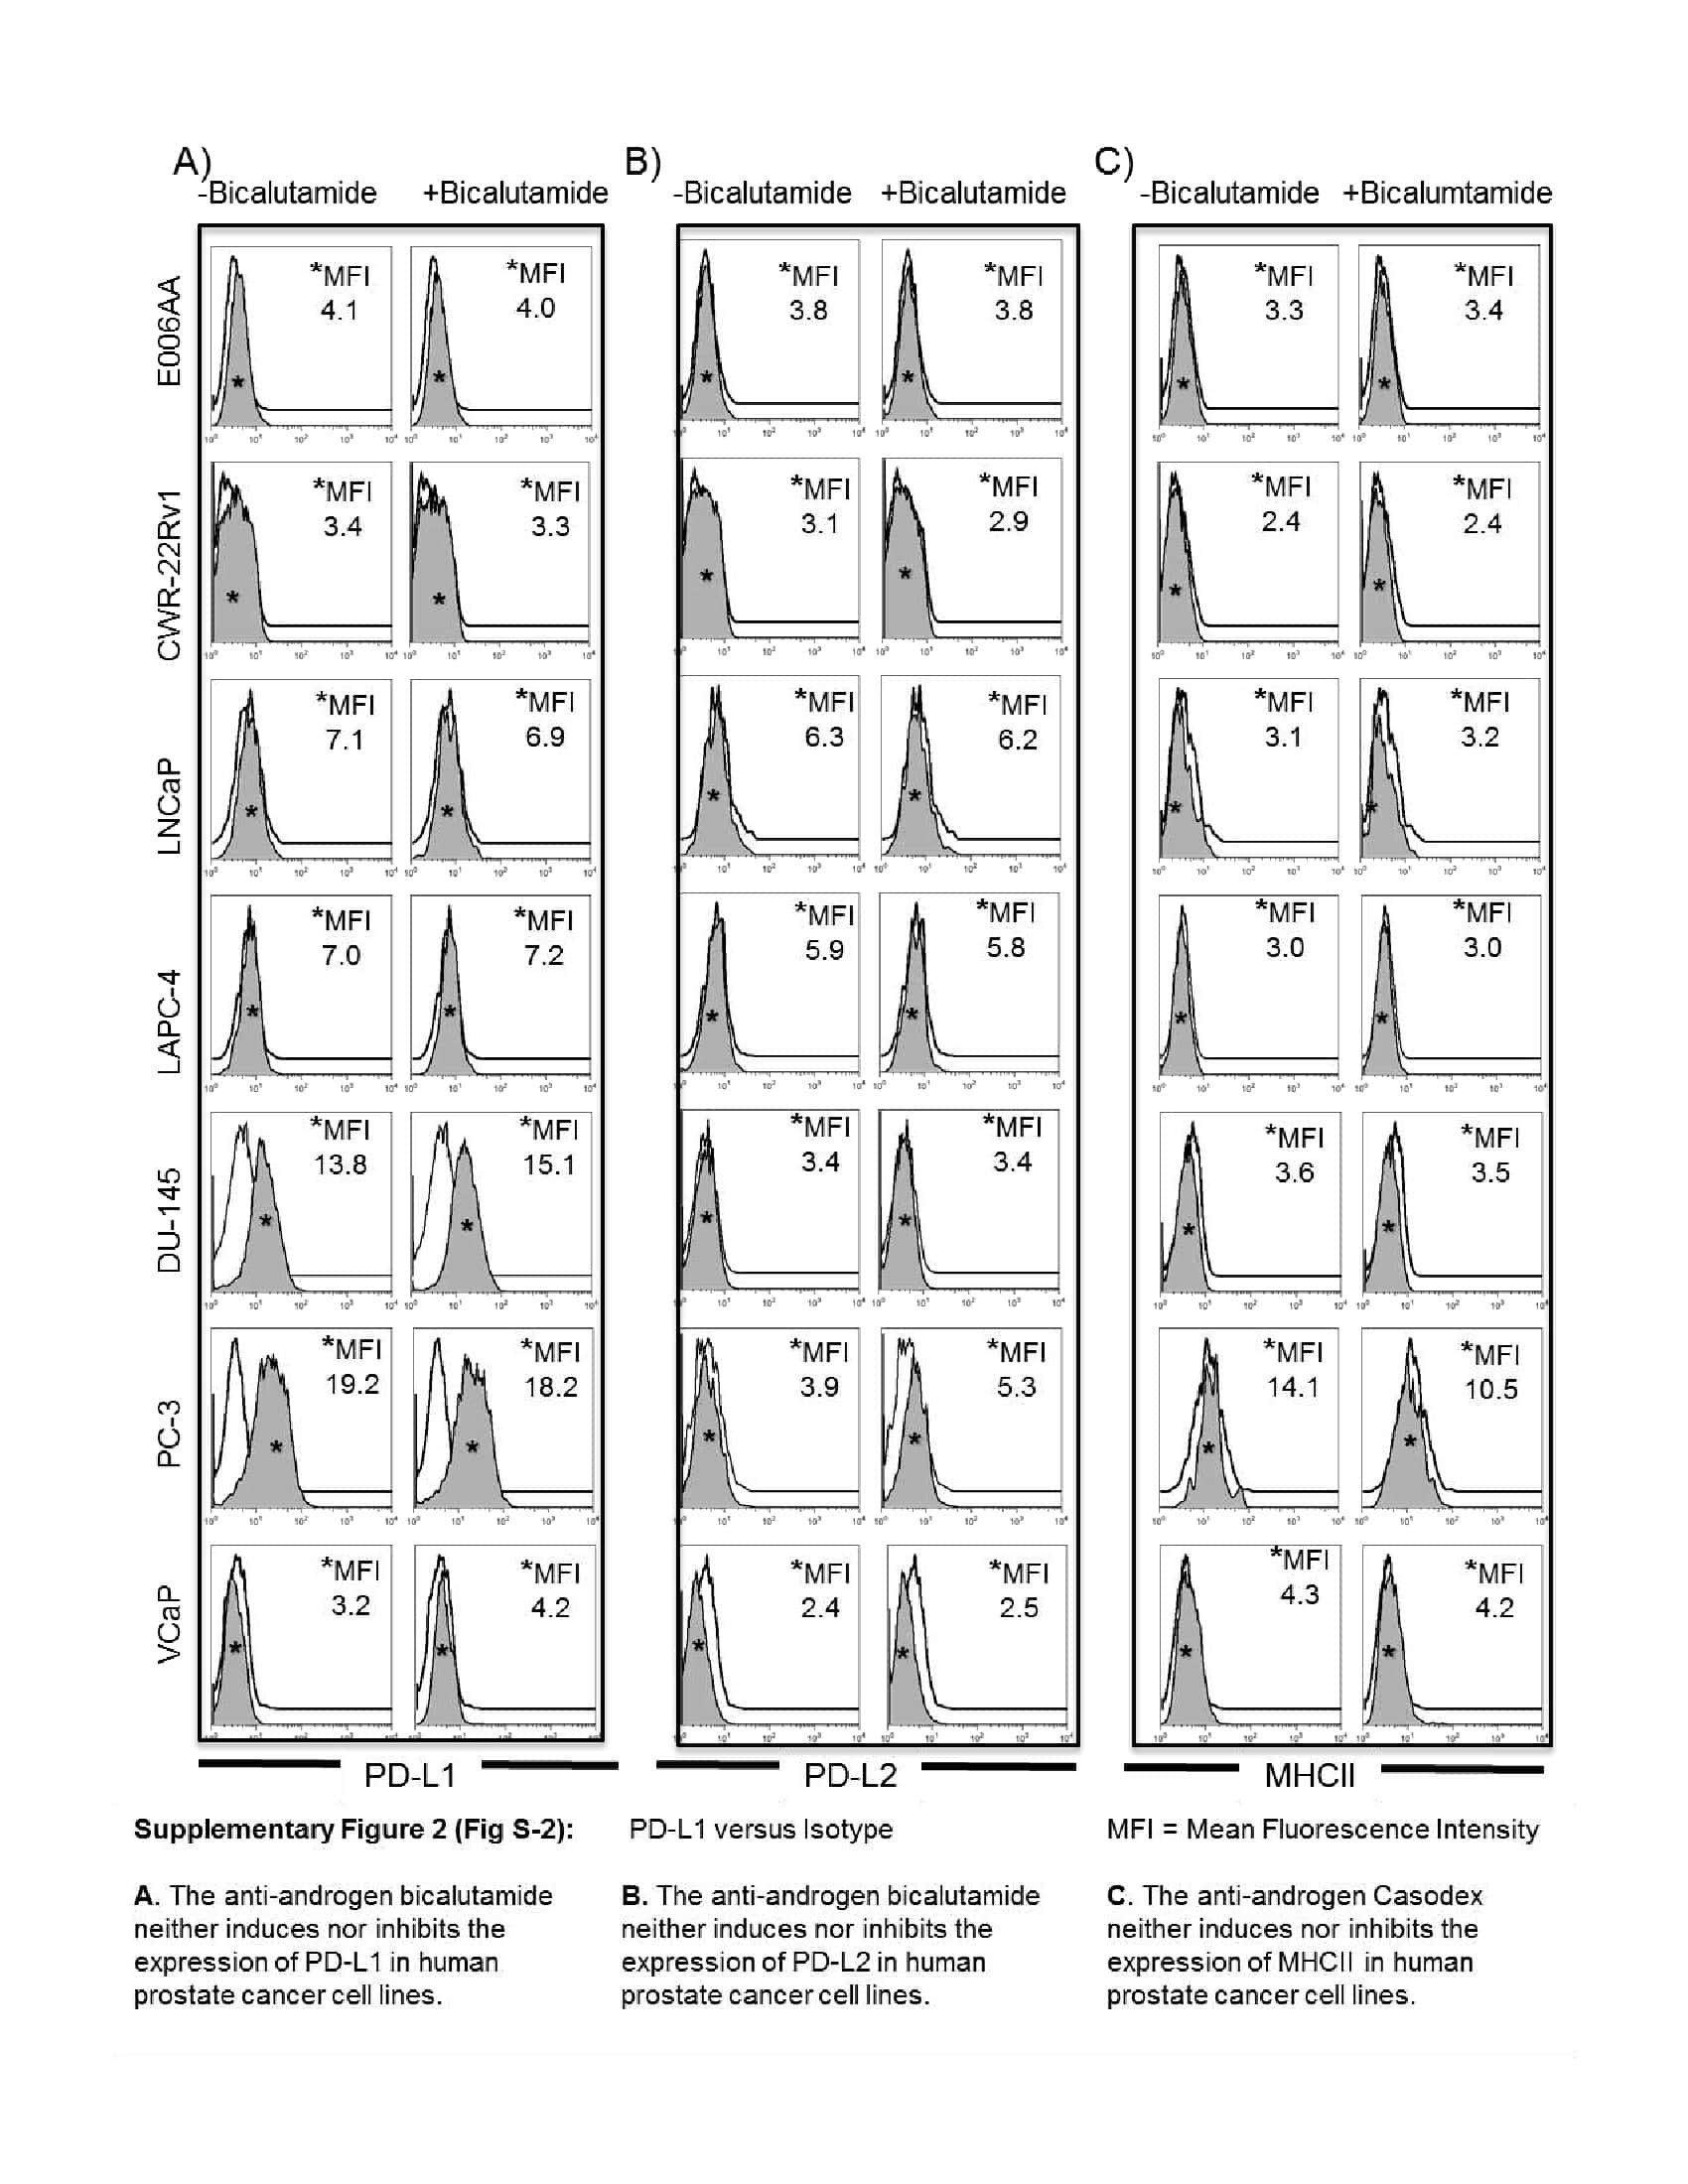
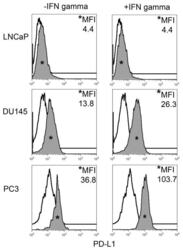
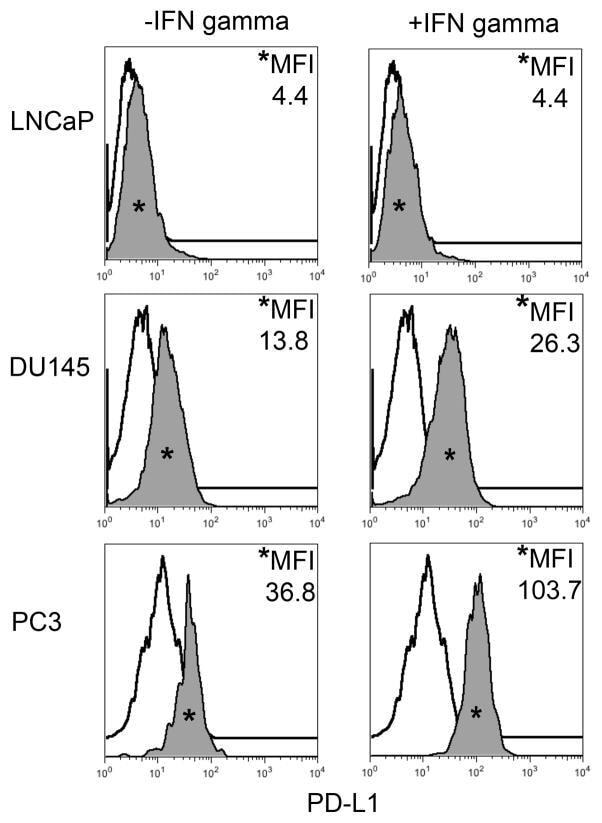
- FIGURE 1 Human Prostate Cancer Cell Lines Display Varying Expression of PD-L1 in Response to IFN-gamma Histograms representing PD-L1 surface expression as detected by flow cytometry in human prostate cancer cell lines with and without exposure to IFN-gamma. Open histograms represent cells stained with an isotype IgG1 antibody tagged with a matching PE fluorochrome. Shaded histograms represent PD-L1. Quantitative measurements reflect mean fluorescence index. LNCaP does not express PD-L1 at rest or in response to IFN-gamma. DU145 expresses PD-L1 at rest and has little response to IFN-gamma indicating an innate immune resistance phenotype. PC3 expresses PD-L1 at rest but robustly up-regulates this expression in response to IFN-gamma displaying a more classic adaptive immune resistance phenotype.
- Submitted by
- Invitrogen Antibodies (provider)
- Main image
- Experimental details
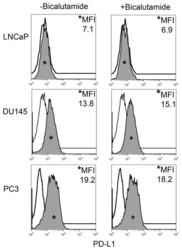
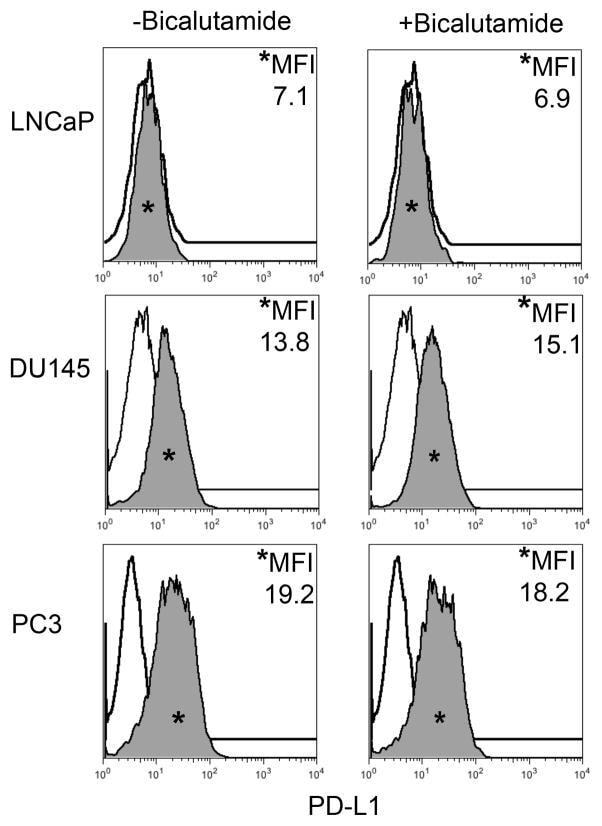
- FIGURE 2 Human Prostate Cancer Cell Lines Display No Change in PD-L1 Expression in Response to Bicalutamide Histograms representing PD-L1 surface expression as detected by flow cytometry in human prostate cancer cell lines with and without exposure to bicalutamide. Open histograms represent cells stained with an isotype IgG1 antibody tagged with a matching PE fluorochrome. Shaded histograms represent PD-L1. Quantitative measurements reflect mean fluorescence index. LNCaP, DU145, and PC3 displayed no changes in PD-L1 expression upon exposure to bicalutamide.
- Submitted by
- Invitrogen Antibodies (provider)
- Main image

- Experimental details
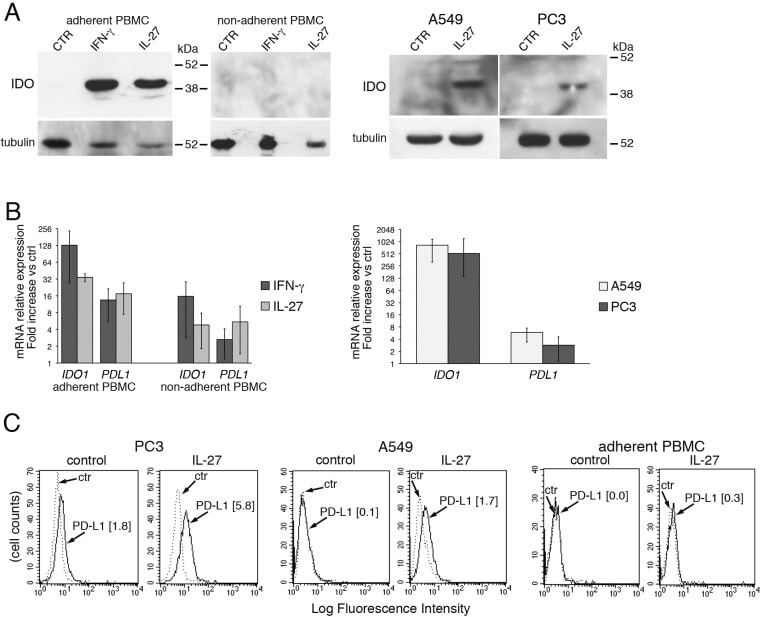
- Figure 7 IL-27 induces PD-L1 and/or IDO expression in human PC3 prostate and A549 lung cancer cells and adherent PBMC A. Western blot analysis of IDO expression in human adherent PBMC, non-adherent PBMC and in PC3 and A549 cells treated with the indicated cytokines or medium only for 48 hours. alpha-tubulin is used as loading control. Similar results were observed in two additional experiments. B. QRT-PCR analysis of IDO1 and PDL1 mRNA expression in cytokine-stimulated adherent or non-adherent PBMC, PC3 and A549 cells relative to untreated cells. Data are expressed as DeltaDeltaCT-fold change. Mean values of three independent experiments. Error bars represent SD. C. FACS analysis of surface PD-L1 in IL-27-treated or untreated PC3 and A549 cell lines and adherent PBMC. Dotted lines are isotype-matched unrelated Ig staining controls. Similar results were obtained in five different experiments (PC3: MFI 5.5 +- 2.7 vs 1.5 +- 0.6, mean +- SD in IL-27-treated vs un-stimulated cells, P = 0.03 by paired Student's t test; A549: MFI 2 +- 1 vs 0.43 +- 0.4, P = 0.01).
- Submitted by
- Invitrogen Antibodies (provider)
- Main image
- Experimental details
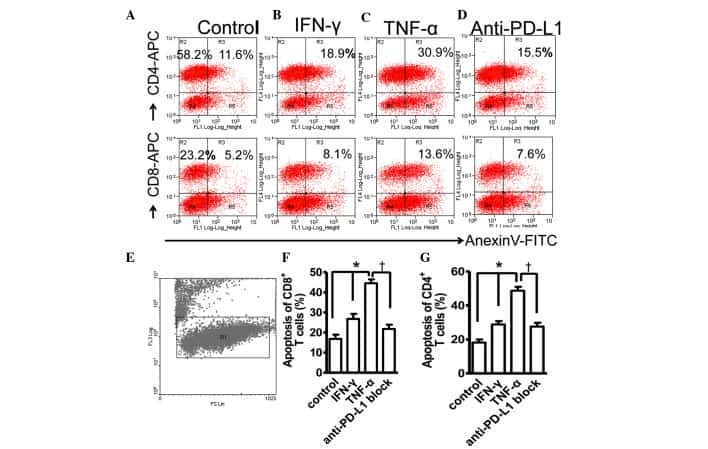
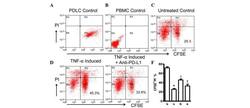
- Figure 4 Expression of PD-L1 on PDLCs improves survival of PDLCs. Flow cytometry histrograms of (A) PDLCs, (B) PHA-activated PBMCs, (C) PDLCs co-cultured with activated PBMCs, (D) PDLCs pretreated with TNF-alpha and co-cultured with activated PBMCs, and (E) PDLCs pretreated with TNF-alpha, and incubated with activated PBMCs and anti-PD-L1 antibodies. (F) Comparison of PDLC survival, according to the percentages of CFSE + /PI - cells. a, c, d and e represent the PDLC control, untreated control, TNF-alpha induced and TNF-alpha induced+anti-PD-L1 groups, respectively. Data are expressed as the mean +- standard error of the mean of three independent experiments. Co-culturing the activated PMBCs with untreated PDLCs resulted in a significant decrease in viable PDLCs ( * P

- Submitted by
- Invitrogen Antibodies (provider)
- Main image
- Experimental details
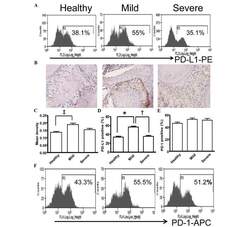
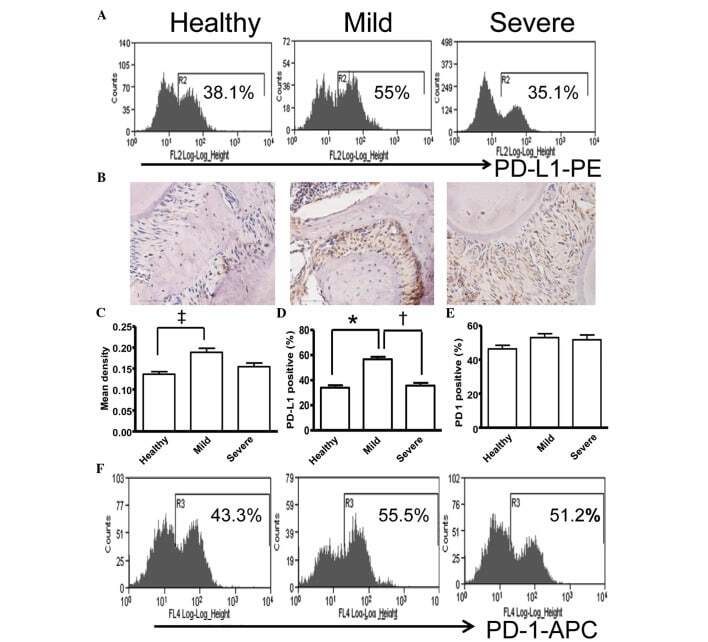
- Figure 5 Expression of PD-L1 is correlated with the severity of periodontitis in the experimental periodontitis model. (A) Flow cytometry histograms of the expression of PD-L1 on the surface of periodontal tissue cells from healthy mice, and mice with mild periodontitis and severe periodontitis. (B) Expression of PD-L1 in periodontal tissues from the three groups, detected by immunohistochemical staining (magnification, x400). (C) Comparison of the expression of PDL-1 in periodontal tissues between the three groups ( ++ P
- Submitted by
- Invitrogen Antibodies (provider)
- Main image
- Experimental details
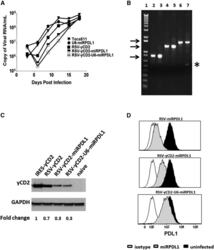
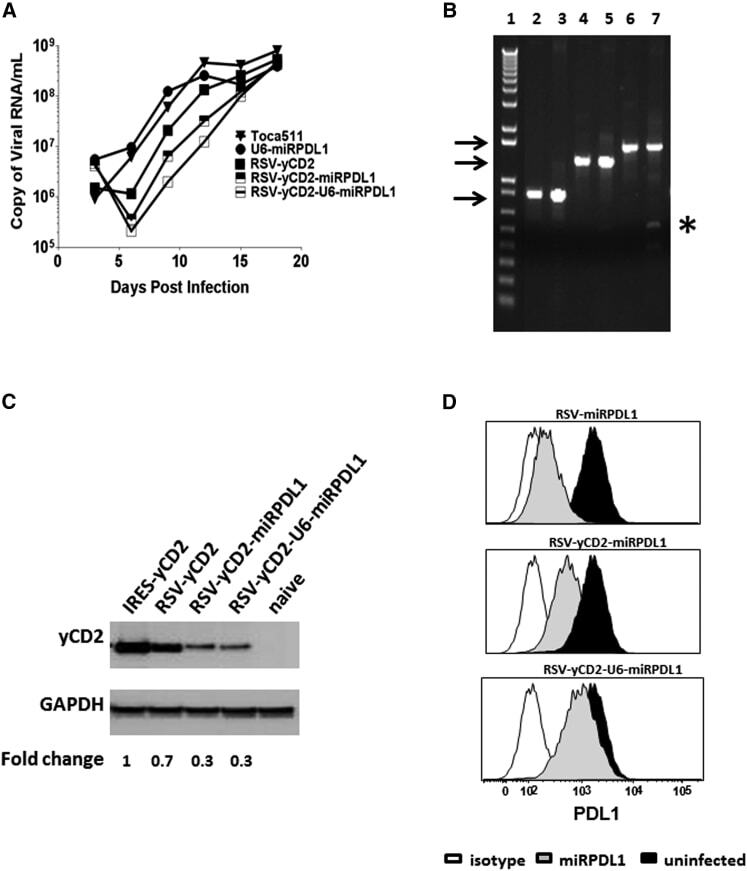
- Figure 5 RRV-RSV-yCD2-miRPDL1 and RRV-RSV-yCD2-U6-miRPDL1 Express yCD2 Protein and Exhibit PDL1 Downregulation Activity (A) Replication kinetics of RRV-RSV-yCD2-miRPDL1 and RRV-RSV-yCD2-U6-miRPDL1. The viral genome in the supernatants of infected LN-18 cells (MOI of 0.1) at indicated time points were quantified by qRT-PCR using primer set targeted to the env region ( Figure 1 ). A paired t test was performed and showed no statistically significant difference in replication kinetics between RRV-RSV-yCD2-miRPDL1 versus RRV-RSV-yCD2 (p = 0.0649) and RRV-RSV-yCD2-U6-miRPDL1 (p = 0.0801). RRV-yCD2, RRV-RSV-yCD2, and RRV-miRPDL1 (indicated as U6-miRPDL1 in the graph) were included as positive controls. (B) Vector stability of RRV-RSV-yCD2-miRPDL1 and RRV-RSV-yCD2-U6-miRPDL1 in LN-18 cells was analyzed by endpoint PCR at 14 days post infection. Lane 1: DNA molecular marker (1 Kb Plus marker, Invitrogen); lanes 2, 4, and 6 are positive controls using the corresponding plasmid DNA as the templates; lane 3: RRV-RSV-miRPDL1; lane 5: RRV-RSV-yCD2-miRPDL1; and lane 7: RRV-RSV-yCD2-U6-miRPDL1. The arrows indicate the expected size of the PCR products (844 bp for RRV-RSV-miRPDL1; 1,326 bp for RRV-RSV-yCD2-miRPDL1; and 1,591 bp for RRV-RSV-yCD2-U6-miRPDL1). (C) yCD2 protein expression in LN-18 cell infected with RRV-yCD2, RRV-RSV-yCD2, RRV-RSV-yCD2-miRPDL1, RRV-RSV-yCD2-U6-miRPDL1, and naive cells. GAPDH is included as loading control. The numbers shown on the bottom of the immunoblot indica
- Submitted by
- Invitrogen Antibodies (provider)
- Main image
- Experimental details
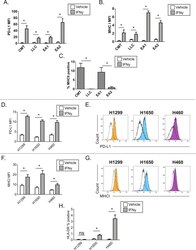
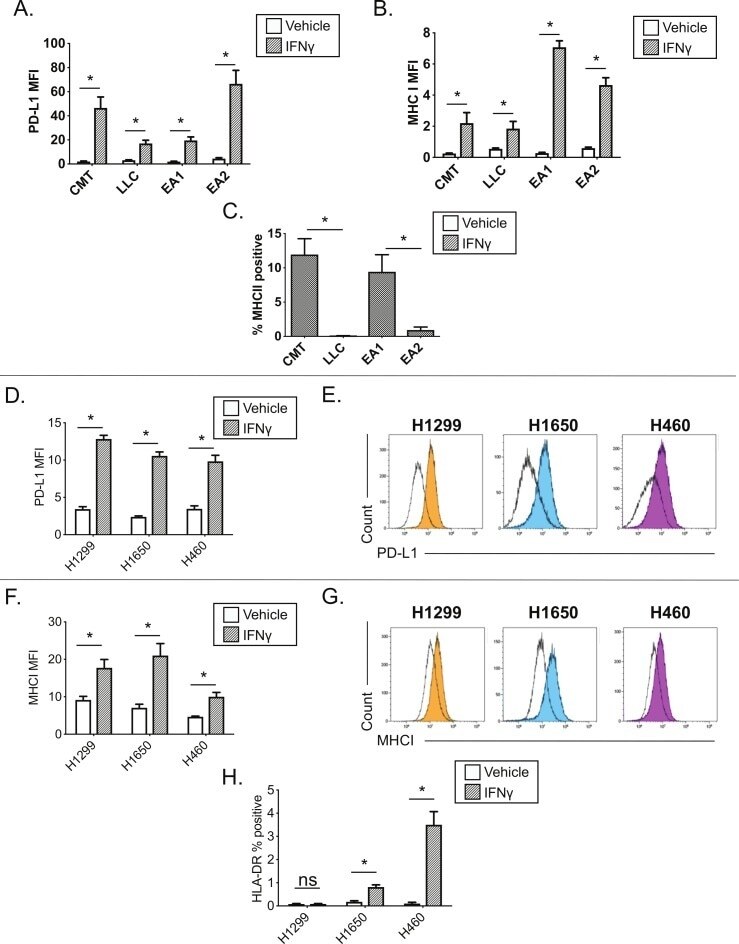
- Figure 2 Interferon gamma responsiveness in mouse and human NSCLC cell lines. In A-C, cultured cell lines (CMT167, LLC, EA1, EA2) were treated with vehicle or 100 ng/mL IFNgamma for 48 hours, and analyzed by flow cytometry for cell surface expression of (A) PD-L1, (B) MHC I, or (C) MHC II. Data for PD-L1 and MHC I are defined by median fluorescent intensity (MFI) of all cells, given the uniform induction of these proteins ( online supplementary figure 1 ). MHC II expression is defined as the frequency of positive cells, based on MHC II induction in a subset of cells ( online supplementary figure 2 ). Statistical analysis in (A, B) defined between vehicle and IFNgamma treated samples using an unpaired T-test (statistical significance identified by *p
- Submitted by
- Invitrogen Antibodies (provider)
- Main image
- Experimental details
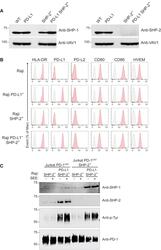
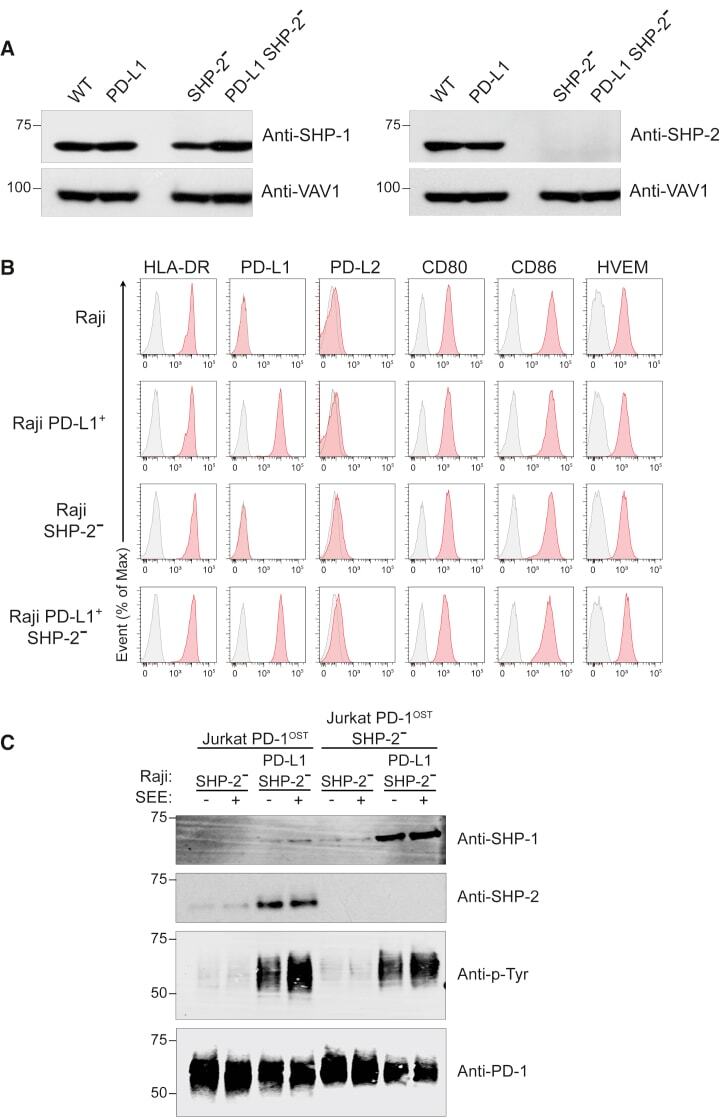
- Figure 6 SHP-1 Can Replace SHP-2 for PD-1 Coinhibition in Jurkat T Cells (A) Immunoblot analysis of equal amounts of proteins from total lysates of Raji (WT), Raji PD-L1, Raji SHP-2 - , and Raji PD-L1 SHP-2 - cells probed with antibodies to SHP-1 (right panel), SHP-2 (left panel), or VAV1 (loading control). Left margin, molecular size in kilodaltons. Data are representative of two independent experiments. (B) Raji, Raji PD-L1, Raji SHP-2 - , and Raji PD-L1 SHP-2 - cells were analyzed using flow cytometry for expression of HLA-DR, PD-L1, PD-L2, CD80, CD86, and HVEM. Gray shaded curves correspond to isotype-matched control antibody (negative control), and data are representative of two independent experiments. (C) Jurkat-PD-1 OST and Jurkat-PD-1 OST SHP-2 - cells were stimulated with Raji SHP-2 - cells or Raji PD-L1 SHP-2 - cells that have been preincubated in the absence (-) or presence (+) of SEE and lysed for 2 min after the initial contact. Immunoblot analysis of equal amounts (90%) of lysates from the specified conditions subjected to affinity purification (AP) on Strep-Tactin-Sepharose beads, followed by elution of proteins with D-biotin, and probed with antibody to anti-SHP-1, anti-SHP-2, and phosphorylated proteins (Anti-p-Tyr). Also shown is immunoblot analysis of equal amounts (10%) of total lysates of the specified cells probed with anti-PD-1 antibody (loading control). Left margin, molecular size in kilodaltons (kDa). Data are representative of two independent exper
- Submitted by
- Invitrogen Antibodies (provider)
- Main image
- Experimental details
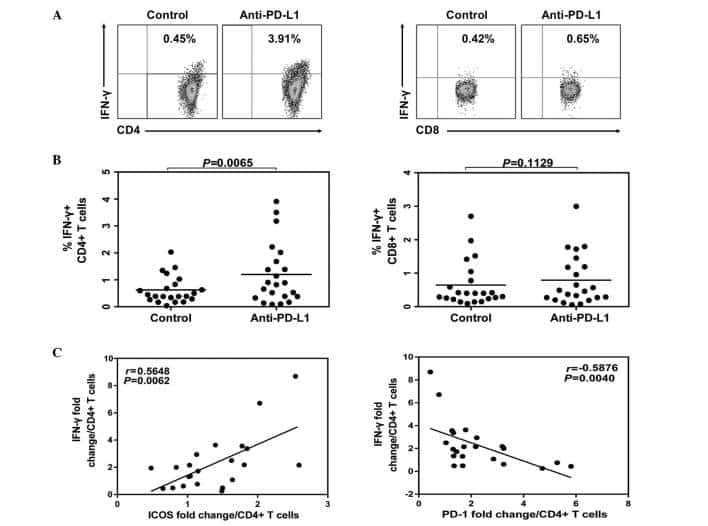
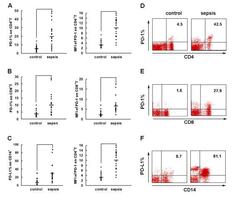
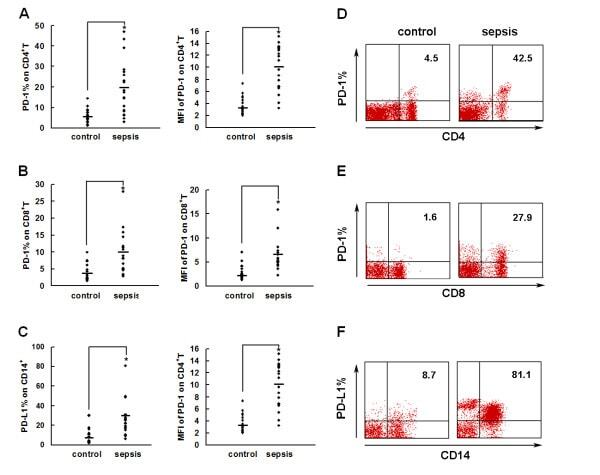
- Figure 2 PD-1 and PD-L1 were upregulated on T cells and monocytes in septic shock patients . Blood samples were obtained from 19 septic shock patients and 22 healthy controls and were stained for programmed death-1 (PD-1) and programmed death ligand-1 (PD-L1) gated on CD4 + T cells, CD8 + T cells, and CD14 + monocytes. (a) to (c) Percentage of PD-1 expression on (a) CD4 + T cells and (b) CD8 + T cells, and (c) percentage of PD-L1 expression on CD14 + monocytes. Each dot represents one individual. Data are mean +- standard error of the mean (SEM) of three independent experiments. ** P < 0.01 compared with healthy controls. (d) to (f) Mean fluorescence intensity (relative fluorescence units) of PD-1 expression on (d) CD4 + T cells, (e) PD-1 expression on CD8 + T cells, and (f) PD-L1 expression on CD14 + monocytes Each dot represents one individual. Data are mean +- SEM of three independent experiments. * P < 0.05 compared with healthy controls. (g) Representative PD-1 expression levels on CD4 + T cells and CD8 + T cells, and PD-L1 expression on CD14 + monocytes. Values in the upper-right quadrant indicate the percentage of cells that express PD-1 or PD-L1.
- Submitted by
- Invitrogen Antibodies (provider)
- Main image
- Experimental details
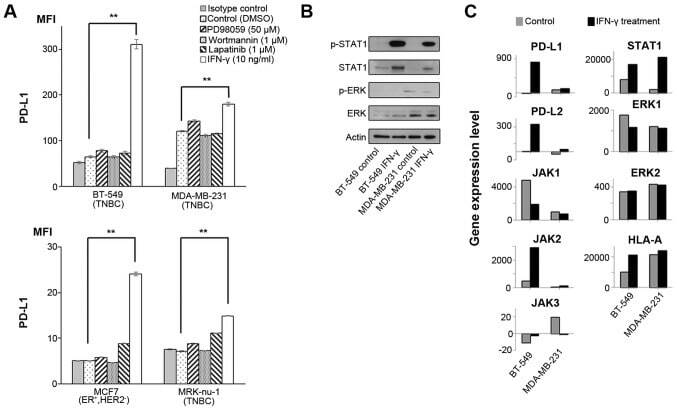
- Figure 1 Effects of IFN-gamma on PD-L1 and signaling pathways. (A) PD-L1 expression was measured by flow cytometry in the cell lines at 48 h following treatment with DMSO, which was used as a vehicle control, 50 u M PD98059 (MAPK inhibitor), 1 u M wortmannin (PI3K-AKT inhibitor), 1 u M lapatinib (combined epidermal growth factor receptor/human epidermal growth factor receptor 2 tyrosine kinase inhibitor), and 10 ng/ml IFN-gamma. Error bars represent the means +- SEM. ** P
- Submitted by
- Invitrogen Antibodies (provider)
- Main image
- Experimental details
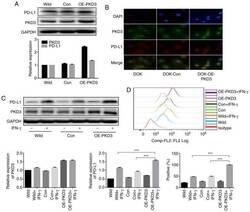
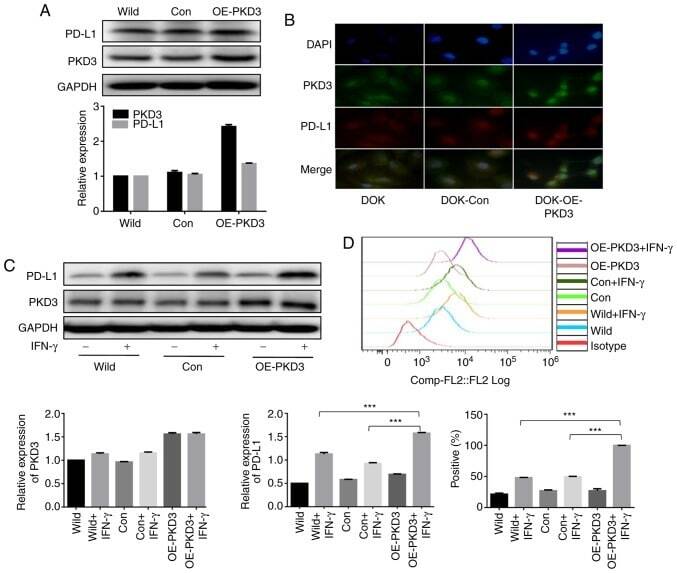
- Figure 3 PKD3 overexpression enhances IFN-gamma-induced PD-L1 expression in DOK cells. (A and B) The levels of PKD3 and PD-L1 protein were examined by western blot analysis and immunofluorescence. The PKD3 overexpression plasmid was transfected into DOK cells using Lipofectamine 2000. (C and D) Cells transfected with the PKD3 overexpression plasmid and cells transfected with control shRNA were cultured in the presence or absence of IFN-gamma (20 ng/ml) for 24 h. The expression levels of PKD3 and PD-L1 were determined by western blot analysis. In addition, the cell surface expression of PD-L1 was analyzed by flow cytometry. Data are presented as the means +- SD (n=3). *** P
- Submitted by
- Invitrogen Antibodies (provider)
- Main image
- Experimental details
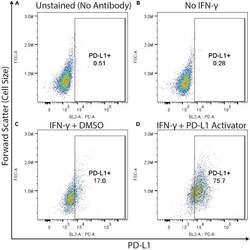
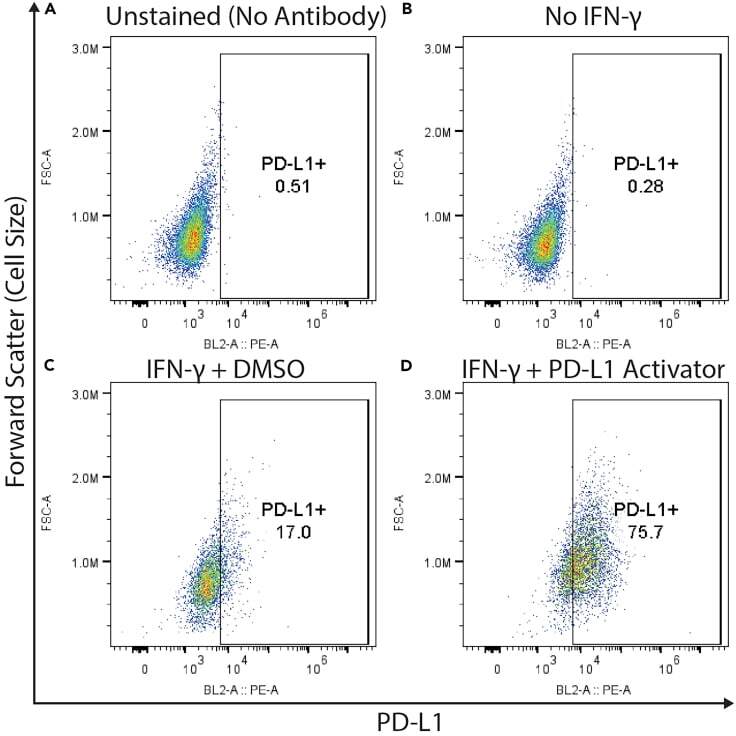
- Figure 3 Example flow cytometry plots demonstrating gating for PD-L1 positive cells THP-1 cells were (A and C) treated with IFN-gamma (50 ng/mL, approximate EC20 of PD-L1 activation), (B) left untreated, or (D) treated with IFN-gamma and a compound which we have identified that increases PD-L1 expression (unpublished data). Cells represented in (A) were not stained with the PE conjugated anti-PD-L1 antibody, whereas (B, C and D) were. All four groups of cells were otherwise stained (including fixable viability dye) and analyzed by flow cytometry as described in this protocol. All plots depict viable cells, gated as seen in Figure 2 .
- Submitted by
- Invitrogen Antibodies (provider)
- Main image
- Experimental details
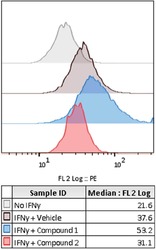
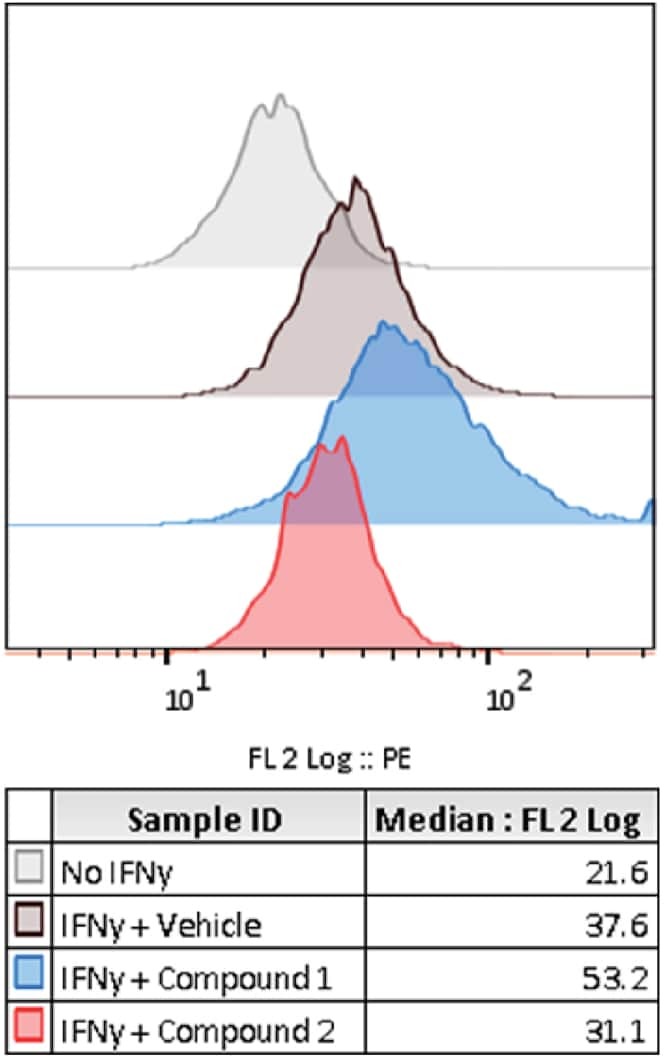
- Figure 5 Representative control and compound treated wells Flow cytometry histogram plots showing PD-L1 expression (PE fluorescence signal) for wells treated with either No IFN-gamma, IFN-gamma and vehicle, or IFN-gamma and one of two compounds from a screening library which were identified as modulating PD-L1 expression.
- Submitted by
- Invitrogen Antibodies (provider)
- Main image
- Experimental details
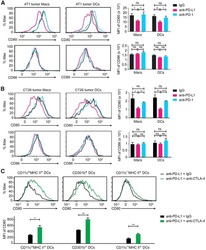
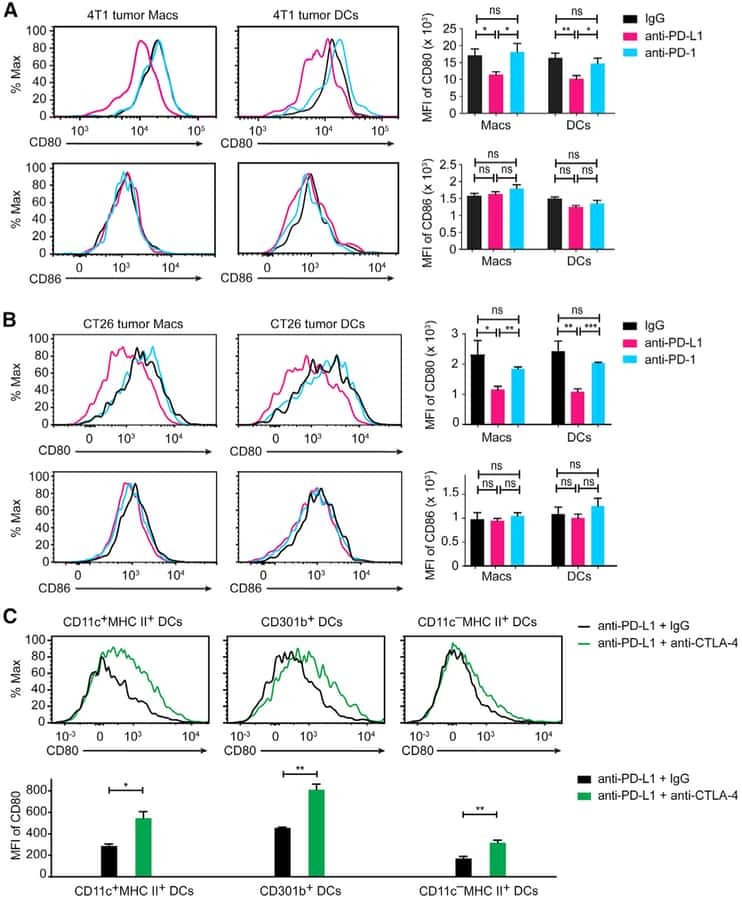
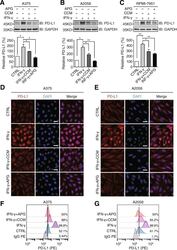
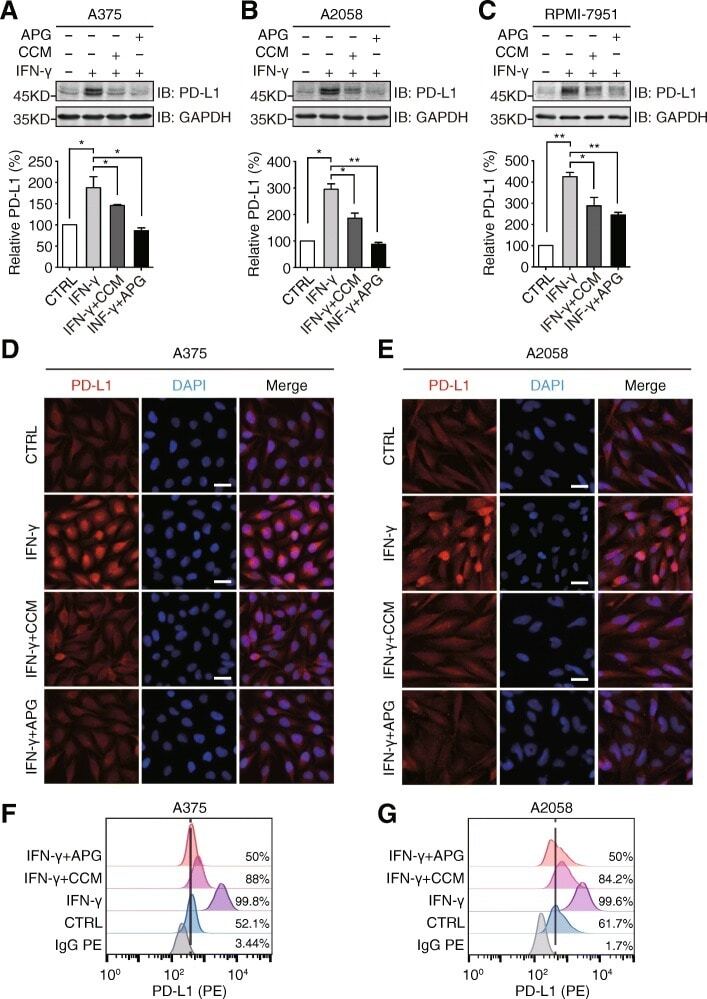
- Fig. 3 Apigenin and curcumin suppress IFN-gamma-induced PD-L1 expression in human melanoma cells. a - c indicated melanoma cells were pretreated with DMSO, curcumin (25 muM), or apigenin (30 muM) for 4 h and then treated with IFN-gamma (10 ng/ml) for 24 h. Cells were lysed and PD-L1 expression was detected by Western blotting using a PD-L1 antibody. GAPDH was used as a loading control. Column charts below show quantitation data of relative PD-L1 expression. Error bars represent the mean +- S.D. ( n = 3, * P < 0.05 and ** P < 0.01). d and e cells were treated as described above and processed for immunofluorescence analysis. Representative micrographs show PD-L1 staining from different groups with same intensity settings on a fluorescent microscope (Olympus, Japan). DAPI stains nucleus. Scale bar = 25 mum. f and g , A375 and A2058 cells were treated as described above, and cell surface PD-L1 expression was determined by flow cytometry
- Submitted by
- Invitrogen Antibodies (provider)
- Main image

- Experimental details
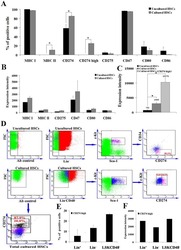
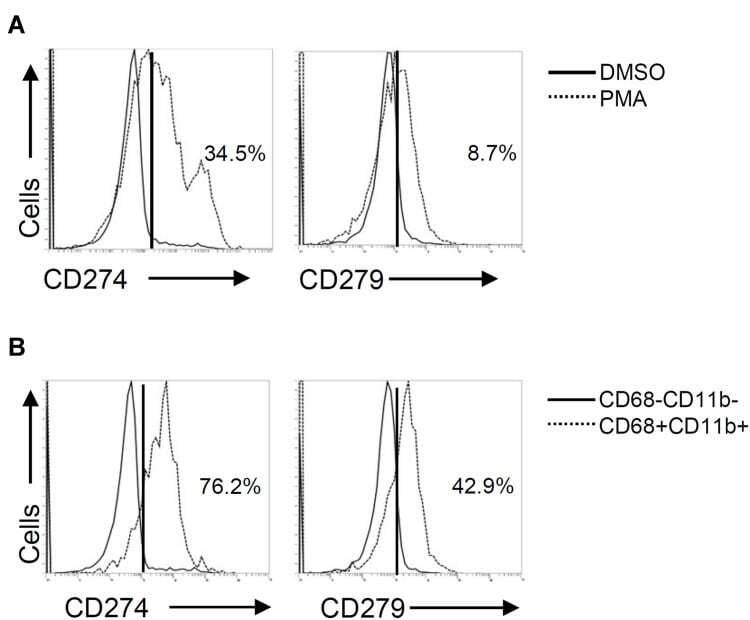
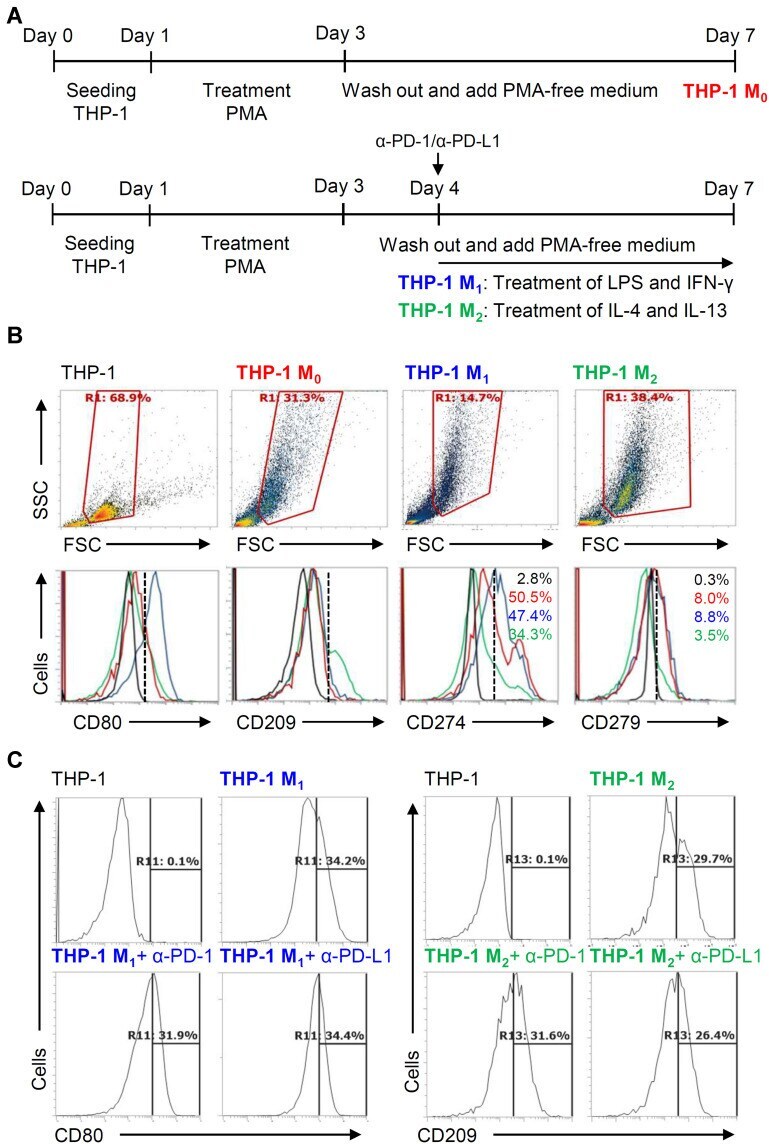
- Figure 3 Phorbol 12-myristate 13-acetate (PMA) treatment induces PD-L1 (CD274) and PD-1 (CD279) expression in THP-1-differentiated macrophages. According to the experimental design shown in Figure 1A , immunostaining followed by flow cytometric histogram and dot-plot analysis showed the expression of PD-L1 (CD274) and PD-1 (CD279) in PMA-treated THP-1 cells ( A ) without or ( B ) with the gating of CD68 - CD11b - and CD68 + CD11b + cells. Representative data were selectively obtained from three individual experiments, and the percentage of positive cells is shown.
- Submitted by
- Invitrogen Antibodies (provider)
- Main image
- Experimental details
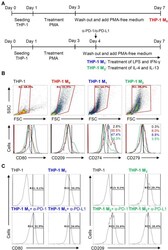
- Figure 5 Different expression of PD-L1 (CD274) and PD-1 (CD279) in THP-1-differentiated macrophages. ( A ) In PMA-stimulated THP-1-differentiated M 0 macrophages, cells were then treated with LPS (1 mug/mL)/IFN-gamma (10 ng/mL) and IL-4 (25 ng/mL)/IL-13 (25 ng/mL) for polarization of M 1 and M 2 , respectively, in the absence and presence of neutralizing antibodies (5 mug/mL) against CD274 (alpha-PD-L1) and CD279 (alpha-PD-1) according to the experimental design. ( B ) For immunostaining, cells were stained with CD80 and CD209 for dissecting M 1 and M 2 , respectively. Immunostaining followed by flow cytometric histogram analysis showed the expression of CD274 and CD279 in these cells. ( C ) Furthermore, the expression of CD80 and CD209 in M 1 and M 2 without or with the blockade of CD274 and CD279 were shown. For all flow cytometric analysis, representative data were selectively obtained from three individual experiments, and the percentage of positive cells is shown. THP-1 (black); THP-1 M 0 (red); THP-1 M 1 (blue); THP-1 M 2 (green).
- Submitted by
- Invitrogen Antibodies (provider)
- Main image
- Experimental details
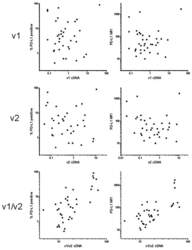
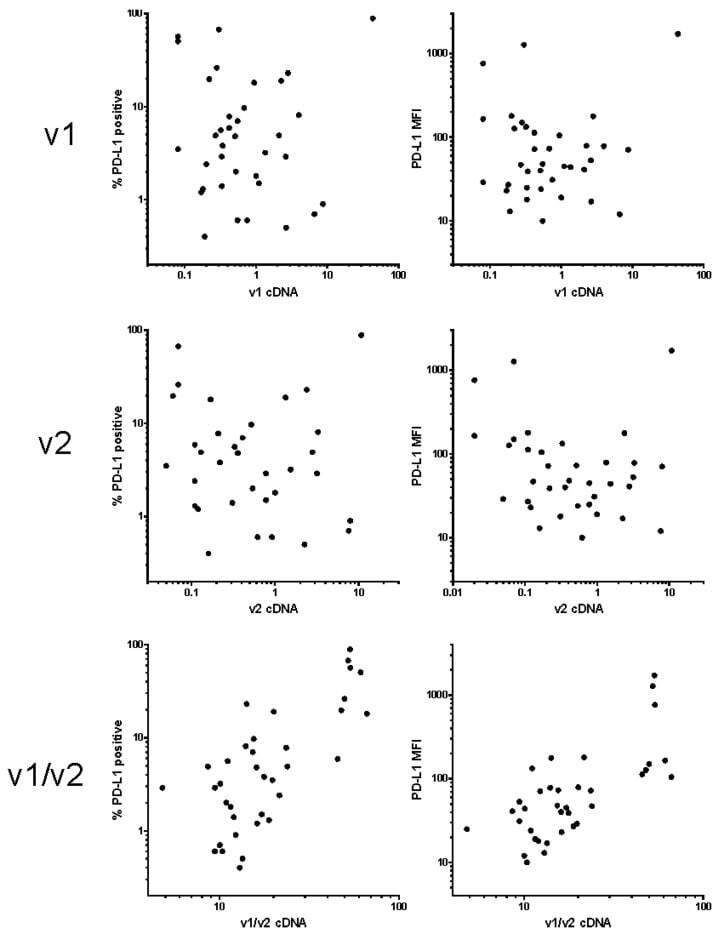
- Figure 2 Correlation of PD-L1 cell surface amount with the transcript levels. The amount of PD-L1 on acute myeloid leukemia (AML) blast surface was determined using flow cytometry and expressed as the percentage of positive cells (left column) or as the mean fluorescence intensity (MFI) of the blast population (right column). The relative levels of v1 and v2 transcripts were measured by PCR and normalized to GAPDH.
- Submitted by
- Invitrogen Antibodies (provider)
- Main image
- Experimental details
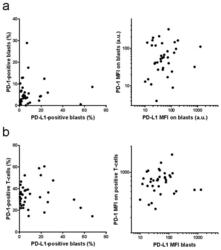
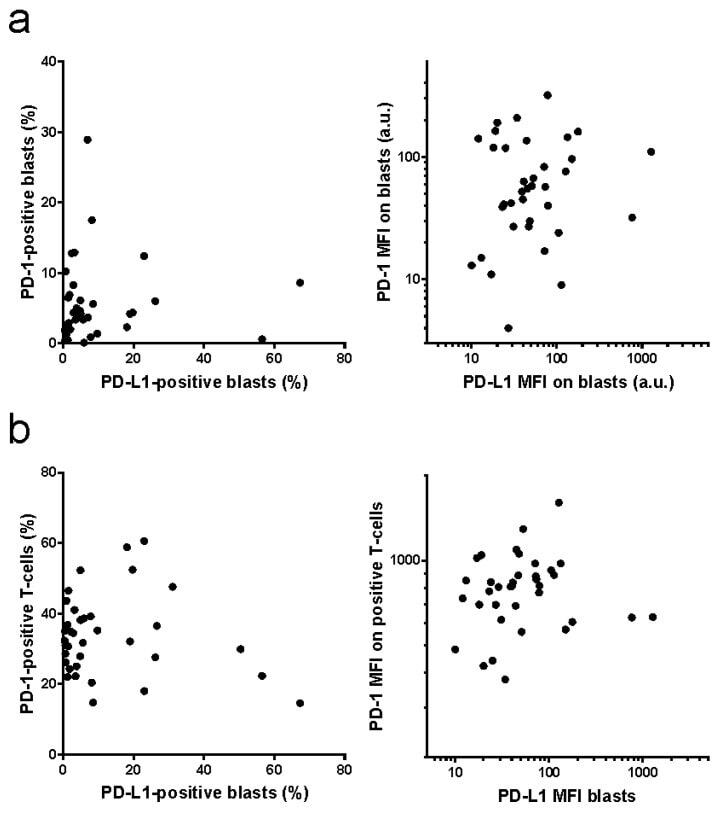
- Figure 5 Correlation of PD-L1 and PD-1 expression. PD-L1 expression on AML blasts and PD-1 expression on AML blasts ( a ) or on the autologous T-cells ( b ) was determined by flow cytometry. Left: positive cell fractions, right: mean fluorescence intensity (MFI).
- Submitted by
- Invitrogen Antibodies (provider)
- Main image
- Experimental details
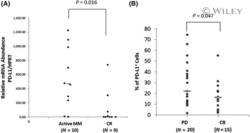
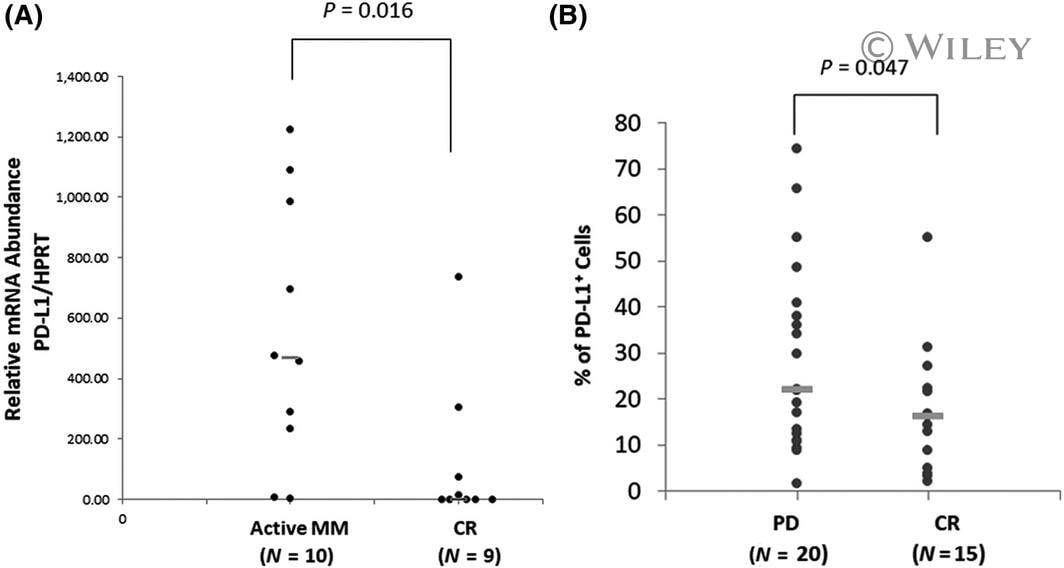
- 1 Fig Expression of programmed cell death ligand-1 (PD-L1) is higher in patients with active multiple myeloma (MM) as compared to those with complete remission (CR). ( A ) Quantified polymerase chain reaction analysis of PD-L1 gene expression and ( B ) flow cytometric analysis of PD-L1 protein expression in bone marrow mononuclear cells (BMMCs) from patients with active MM. PD, progressive disease.
- Submitted by
- Invitrogen Antibodies (provider)
- Main image
- Experimental details
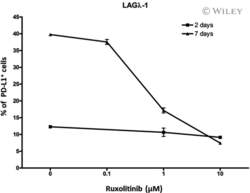
- 5 Fig Ruxolitinib (RUX) reduces programmed cell death ligand-1 (PD-L1) expression in human multiple myeloma (MM) LAGlamda-1 cells. Flow cytometric analysis of percentage of PD-L1-postive cells in human MM xenograft LAGlamda-1 tumour cells treated with increasing concentrations of RUX for 2 or 7 days. All experiments were n = 3 (technical replicates).

- Submitted by
- Invitrogen Antibodies (provider)
- Main image
- Experimental details
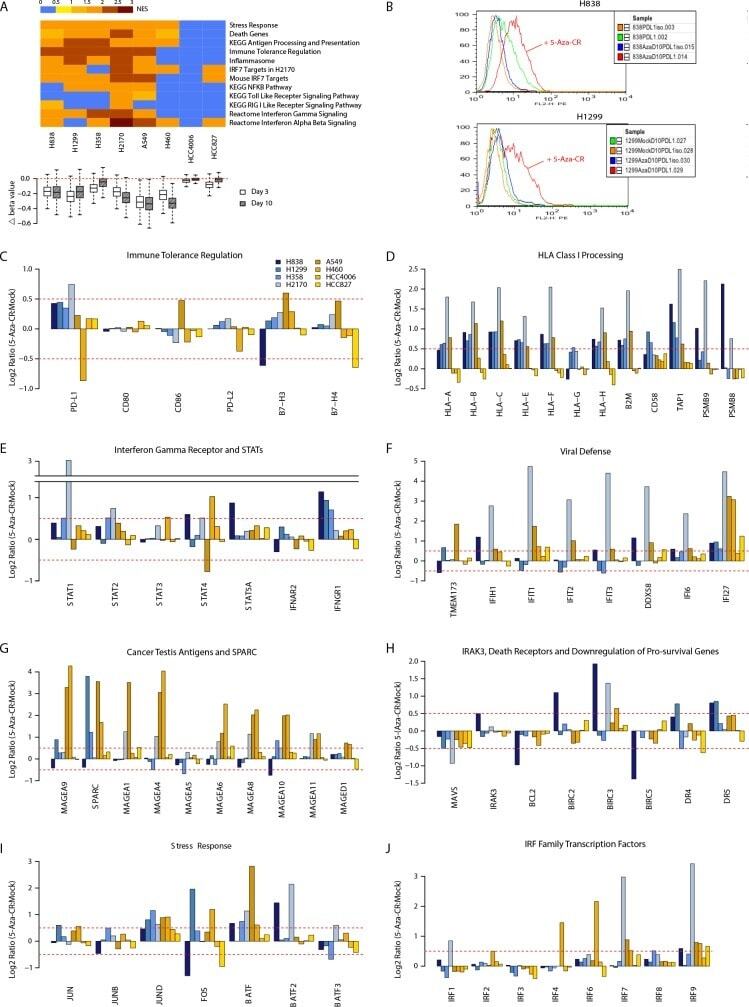
- Figure 1 Azacytidine alters gene expression in NSCLC cell lines for multiple immune related pathways (A) Top panel: Gene Set Enrichment Analysis (GSEA) for pathways up-regulated by azacytidine. Normalized enrichment scores are plotted as a heat map. Bottom panel: boxplot showing degree of demethylation in each cell line, as measured by the difference in beta values between the AZA and mock-treated cells immediately after drug withdrawal and 7 days later. (B) FACS analysis shows increased level of cell surface PD-L1 after AZA treatment by day 10 in NSCLC lines H838 and H1299. (C) to (J) AZA-mediated expression changes at day 10 in key genes from pathways outlined in (A). Y axis = Ratio of expression values (log2) of AZA -treated vs. mock-treated cells; X-axis = gene names.
- Submitted by
- Invitrogen Antibodies (provider)
- Main image

- Experimental details
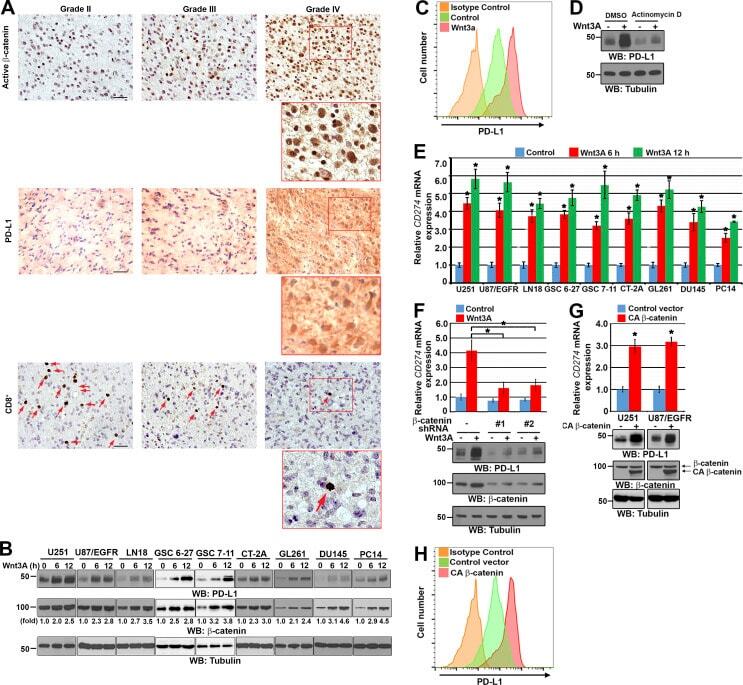
- Figure 1. Wnt-induced beta-catenin activation results in PD-L1 up-regulation in tumor cells. (B, D, F, and G) Immunoblotting analyses were performed with the indicated antibodies. (E-G) Data represent the means +- SD of three independent experiments. (A) IHC staining of 20 diffuse astrocytoma (grade II), 20 anaplastic astrocytoma (grade III), and 50 GBM (grade IV) specimens was performed with the indicated antibodies. Representative images of IHC staining from the specimens are shown. Scale bar, 50 um. Red arrows point to CD8 + cells. (B) The indicated tumor cells were serum starved for 12 h and then stimulated with Wnt3A (20 ng/ml) for the indicated periods of time. Immunoblotting analyses were performed. (C) U87/EGFR cells were treated with or without Wnt3A (20 ng/ml) for 12 h. A cell surface analysis of PD-L1 protein was performed using a flow cytometer. (D) Serum-starved U87/EGFR cells were pretreated with or without actinomycin D (1 ug/ml) for 2 h and then stimulated with or without Wnt3A (20 ng/ml) for 12 h. (E) The indicated tumor cells were serum starved for 12 h and then stimulated with or without Wnt3A (20 ng/ml) for the indicated periods of time. Real-time PCR analyses were performed. *, P < 0.0001, on the basis of Student's t test. (F) U87/EGFR cells with stable expression of beta-catenin shRNA or a control shRNA were treated with or without Wnt3A (20 ug/ml) for 12 h. A real-time PCR analysis (top panel) and immunoblotting analyses (bottom panel) were performed. b
- Submitted by
- Invitrogen Antibodies (provider)
- Main image
- Experimental details
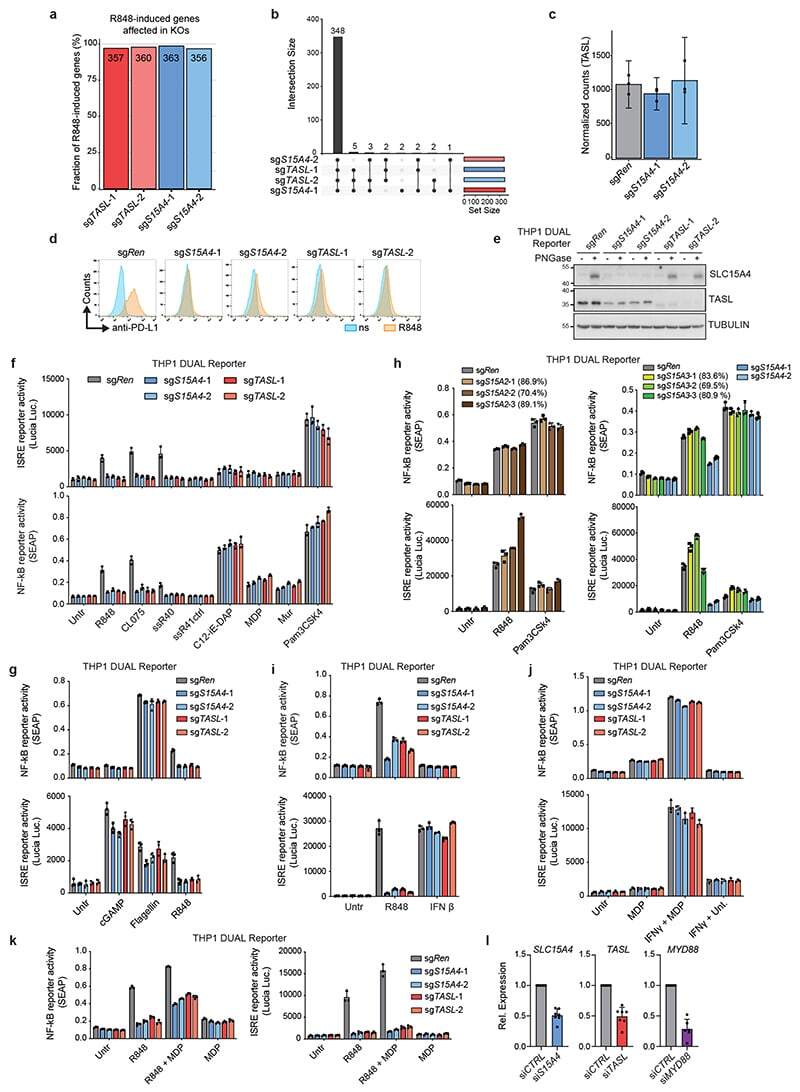
- Extended Data Figure 5 TASL mirrors SLC15A4 requirement for TLR7/8 activation. ( a ) Fraction of R848-induced genes affected by SLC15A4 and TASL knockout, related to Fig. 2b . ( b ) Upset plot representing number of R848-induced genes commonly affected by indicated sgRNAs, related to Fig. 2b . ( c ) TASL gene expression levels in indicated THP1 cells, related to Fig. 2b . Bar graphs shown mean (n=3 biological replicates), error bars show 95 % confidence interval of mean. ( d ) Flow cytometry of PD-L1 surface expression in indicated unstimulated (ns) or R848-stimulated (5 mug/ml, 24h) THP1 cells. ( e ) Immunoblots of indicated THP1 DUAL cells. Lysates treated with PNGase F as indicated. ( f-i,k ) Indicated THP1 DUAL cells were (co-)treated for 24 hours with R848 (5 mug/ml), CL075 (5 mug/ml), ssRNA40/LyoVec(tm) (5 mug/ml) or inactive control ssRNA41/LyoVec(tm) (5 mug/ml), C12-iE-DAP (5 mug/ml), MDP (10 mug/ml), murabutide (10 mug/ml), Pam3CSK4 (0.1 mug/ml), Flagellin (0.1 mug/ml), cGAMP (3 mug/ml) or interferon beta (20 ng/ml). ( h ) CRISPR/Cas9 editing efficiency (%) estimated by TIDE. ( j ) Indicated THP1 DUAL cells were primed or not with interferon gamma (0.1 mug/ml) for 24h, washed and stimulated or not with MDP (10 mug/ml, 24h). ( f-k ) Supernatants were analyzed for ISRE and NF-kappaB reporter activity. Mean +- s.d. (n=3 biological replicates). ( l ) Relative mRNA expression of SLC15A4 , TASL or MYD88 in siRNA-transfected CD14 + monocytes in comparison to control (si CTR
- Submitted by
- Invitrogen Antibodies (provider)
- Main image
- Experimental details
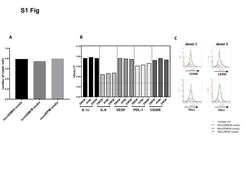
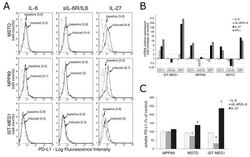
- Figure 2 IL-27 upregulates PD-L1 molecule expression and release by MM cells. ( A ) Flow cytometry analysis of membrane PD-L1 expression in MSTO, MPP89, and IST-MES1 MM cell lines cultured with medium alone (baseline), IL-6, sIL-6R/IL-6 chimera, or IL-27 (induced). Dotted line shows isotype-matched Ig control. Numbers in brackets represent Median Fluorescence Intensity (MFI) values calculated as median anti-PD-L1 mAb minus median Ig control. Data are representative of two independent experiments yielding similar results. ( B ) qRT-PCR analysis of CD274 (PD-L1) mRNA expression in the same three MM cell lines stimulated with IL-6, sIL-6R/IL-6 chimera, IL-27, or IFN-gamma relative to untreated cells. Data are calculated with the DeltaDeltaCT method and expressed as fold change versus untreated control. Error bars represent SD of triplicates. LGALS3 (Galectin 3) and GBP1 (Guanylate Binding Protein 1) mRNA levels are shown, respectively, as negative and positive controls of IL-27 activity. ( C ) Evaluation by ELISA of soluble (s)PD-L1 release in the conditioned media of the indicated MM cells treated with IL-6, sIL-6R/IL-6 chimera, or IL-27. Data are expressed as a percent of untreated control and are the mean of two independent experiments, run in duplicates. Error bars represent the minimum and maximum values (* p < 0.001, Student's t -test versus untreated control).

- Submitted by
- Invitrogen Antibodies (provider)
- Main image
- Experimental details
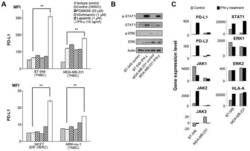
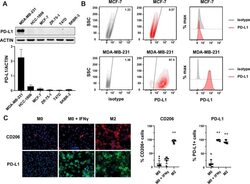
- Figure 1 Expression of PD-L1 in breast cancer cell lines and macrophages. (A) The representative western blot analysis of PD-L1 expression in triple-negative (MDA-MB-231, HCC-1806), ER-positive (MCF-7, ZR-75-1, T47D), and HER-2-positive (SKBR-3) breast cancer cell lines (upper panel). beta-actin was used as a loading control. The experiment was repeated three times. Bands were quantified by densitometry; the signal for PD-L1 band was normalized to the corresponding actin band (lower panel). (B) Representative density plots and histogram overlays illustrating PD-L1 expression (red) against a background from isotype control (gray) for MCF-7 (upper panel) and MDA-MB-231 (lower panel) breast cancer cell lines using flow cytometry. The staining was performed using an anti-PD-L1 antibody (cat. no. 12-5983-42, eBioscience, clone MIH1, dilution 1:100). Numbers on the density plots indicate the percentage of PD-L1-positive cells. The experiment was repeated at least three times. (C) PD-L1 expression in macrophage subpopulations (M0, M0+IFNgamma, M2) detected by immunocytohistochemistry assay using Cytation 1 Cell Imaging Multi-Mode Reader (BioTek, Agilent). PD-L1 positively stained cells were detected using an anti-PD-L1 antibody (clone MIH1, cat. no. 14-5983-82, eBioscience, dilution 1:100) and are marked in green; red shows CD206-positive cells (cat. no. AF2534, R&D Systems, dilution 1:100). The signal was developed using AF488-conjugated or AF647-conjugated secondary antibody, resp

- Submitted by
- Invitrogen Antibodies (provider)
- Main image

- Experimental details
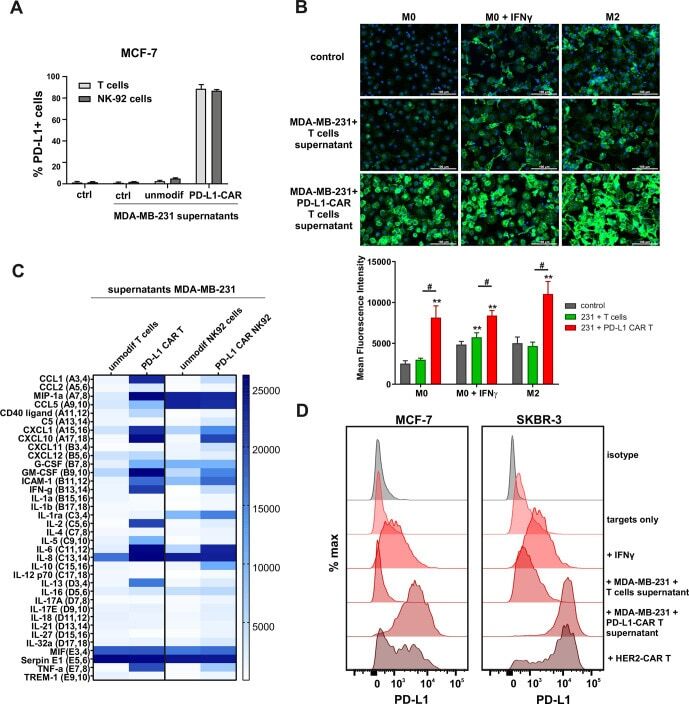
- Figure 5 Induction of PD-L1 expression on the target cells. (A) PD-L1 expression induced by supernatant from activated CAR T or CAR-NK-92 cells on cancer cells was assessed by flow cytometry. The control (only medium) and conditioned supernatants from the 24 hours coincubation cultures of control (unmodified) or PD-L1-CAR T/NK-92 cells with the target MDA-MB-231 cells were transferred onto the culture of MCF-7 and incubated for 48 hours. Next, PD-L1 surface presence was assessed using anti-PD-L1 antibody (clone MIH1) by flow cytometry. The experiment was repeated three times. (B) Representative images of different subpopulations of macrophages (M0, M0+IFNgamma, M2) stained for PD-L1 assessed by immunocytochemistry assay using Cytation 1 Cell Imaging Multi-Mode Reader (BioTek, Agilent). Macrophages were incubated with 10 ng/mL IFNgamma or IL-4 and IL-10 (for M2) for 5 days before staining (every 2-day fresh portion of cytokines was added). The control (only medium) and conditioned supernatants from the 24 hours coincubation cultures of control (unmodified) or PD-L1-CAR T cells with the target MDA-MB-231 cells were transferred onto different subpopulations of macrophages and incubated for 48 hours. Next, PD-L1 surface presence was assessed using anti-PD-L1 antibody (clone MIH1, cat. no. 14-5983-82, eBioscience, diluted 1:100). The signal was developed using AF488-conjugated secondary antibody (green), and nuclei were counterstained with DAPI (blue), scale bar: 100 um. The backg
- Submitted by
- Invitrogen Antibodies (provider)
- Main image
- Experimental details
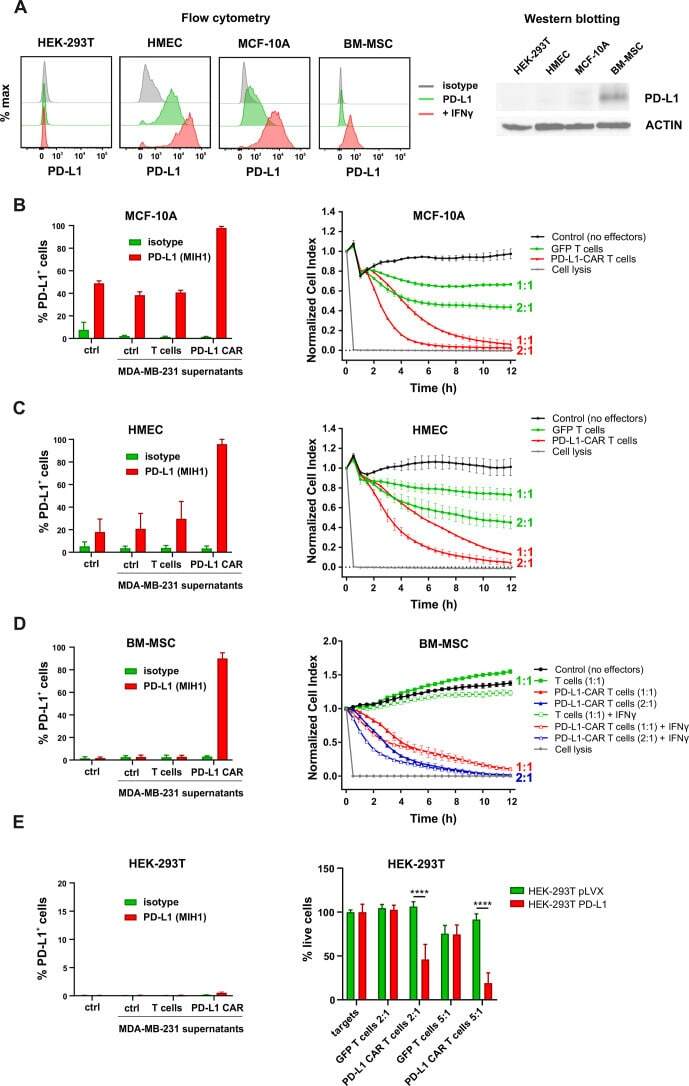
- Figure 6 Expression of PD-L1 and PD-L1-CAR T mediated cytotoxicity in non-malignant cells. (A) IFNgamma induced expression of PD-L1 on HEK293T cell line derived from human embryonic kidney cells and non-malignant cells (HMEC, MCF-10A, and bone marrow-derived mesenchymal stem cells (BM-MSC)) assessed by flow cytometry as presented on the left panel. PD-L1 staining was performed using anti-PD-L1 antibody (clone MIH1). The representative western blot analysis of PD-L1 expression in human embryonic kidney HEK293T cells and non-malignant mammary epithelial HMEC and MCF10A cells, and BM-MSC (right panel). beta-actin was used as a loading control. The experiment was repeated three times. (B) PD-L1 expression induced on MCF-10A cells by activated CAR T cells (left panel) and RTCA-monitored cytotoxic activity of PD-L1 CAR T cells toward MCF-10A cells (right panel). The control (only medium) and conditioned supernatants from the 24 hours coincubation cultures in the presence of control (unmodified) T cells or PD-L1-CAR T cells with the target MDA-MB-231 cells were transferred onto the cultures of MCF-10A cell line and incubated for 48 hours. Next, PD-L1 surface presence was assessed by flow cytometry using anti-PD-L1 antibody (clone MIH1). Cytotoxic activity of PD-L1-CAR T cells against MCF-10A non-malignant cell line was measured by impedance analysis at the E:T ratios of 1:1 and 2:1. Samples were internally normalized for the cell index value measured before PD-L1-CAR T cells additio
- Submitted by
- Invitrogen Antibodies (provider)
- Main image

- Experimental details
- Figure 5 IL-25 Induces PD-L1 Surface Expression on hMSCs and Human Monocytes (A) PD-L1 in siCtrl MSCs (left) and siPD-L1 MSCs (right) was analyzed by surface staining. (B) Freshly isolated human PBLs were co-cultured without (left) or with siCtrl MSCs (middle) or siPD-L1 MSCs (right) for 3 days, followed by PMA/ionomycin stimulation for 6 hr. IL-17A production in CD3 + T cells was assessed by intracellular staining. Representative data are shown with numbers in the top right quadrants representing the percentages of IL-17A-producing CD3 + T cells. (C) Pooled data from PBLs (n = 4) and two hMSC donors (donors A and B) are shown. (D) Folds of reversed phenotypes of siIL-25 and siPD-L1 are shown. (E) PD-L1 expression on siCtrl hMSCs (left) and siIL-25 hMSCs (right) was assessed by cell surface staining. Filled histograms represent isotype control; unfilled histograms represent PD-L1 antibody staining. (F) Pooled data of PD-L1 expression (indicated by fold change in MFI) on siIL-25 hMSCs and siPD-L1 hMSCs (all three donors) are shown. PD-L1 expression levels were compared between hMSCs silenced for the target gene (IL-25 or PD-L1) and the respective siCtrl. (G) hMSCs were treated with the indicated doses of rhIL-25 for 18 hr and assessed for cell surface PD-L1 expression by cell surface staining. Pooled data (all three donors) are shown in chart to the right with bars representing MFI. (H) Human PBLs were treated with the indicated doses of rhIL-25 for 18 hr and assessed for cell
- Submitted by
- Invitrogen Antibodies (provider)
- Main image
- Experimental details
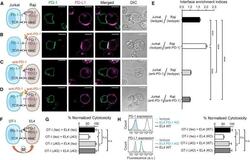
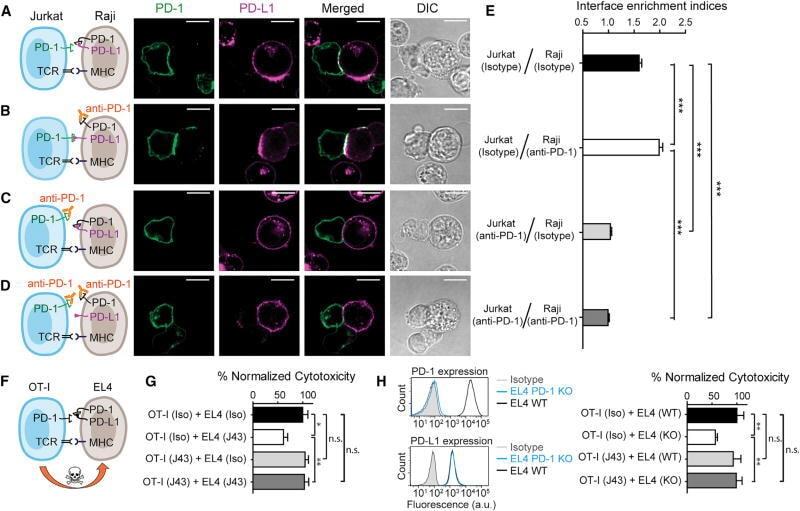
- Figure 7 Blockade of APC-Intrinsic PD-1 Enhances the Synaptic Enrichment of T Cell-Intrinsic PD-1 and Inhibits T Cell-Mediated Cytotoxicity (A) Left: cartoon showing a Jurkat cell expressing PD-1-mGFP (shown as PD-1 in green) conjugated with a Raji cell co-transduced with PD-L1-mCherry and unlabeled PD-1. Right: representative confocal images of the conjugate at the indicated channel acquired 2 min after cell-cell contact. Scale bars, 10 um. (B-D) Same as (A), except that Raji (PD-L1+/PD-1+) cells (B), Jurkat (PD-1-mGFP) cells (C), or both (D) were preincubated with pembrolizumab and washed extensively prior to conjugation. Scale bars, 10 um. (E) Bar graph comparing the interface enrichment indices (calculated as described in STAR Methods) of the four conditions shown in (A)-(D). Data are expressed as mean +- SEM; n = 40 cells from three independent experiments. (F) Cartoon illustrating the cytotoxicity assay, in which EL4 cells were used as the target for OT-I cytotoxic T cells. (G) Bar graph summarizing the OT-I cytotoxicity under indicated conditions, with PD-1 blockade antibody J43 or isotype antibody (Iso) preincubated with neither cell, only EL4, only OT-I, or both cell types. See STAR Methods for details. Cytotoxicity was normalized to the no blockade antibody condition (i.e., EL4 and OT-I preincubated with the isotype control). n.s., not significantly different. Data are presented as mean +- SEM from three independent replicates. (H) Left: FACS histograms showing PD-1
- Submitted by
- Invitrogen Antibodies (provider)
- Main image
- Experimental details
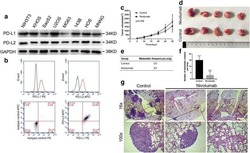
- FIGURE 2 Expression of PD-L1 on human HCC PLC/PRF/5 cells. (A) Human HCC PLC/PRF/5 cells were cultured alone in the absence of GPC3-CAR T cells in RPMI 1640 medium containing 10% FBS. (B) Human HCC PLC/PRF/5 cells were cocultured with GPC3-CAR T cells at an effector:Target ratio of 1:1 for 18 h in RPMI 1640 medium containing 10% FBS. PD-L1 was determined by flow cytometry in the CD3-negative gate, and the fixable, viable stain 780 was used for discriminating live from dead cells.
- Submitted by
- Invitrogen Antibodies (provider)
- Main image

- Experimental details
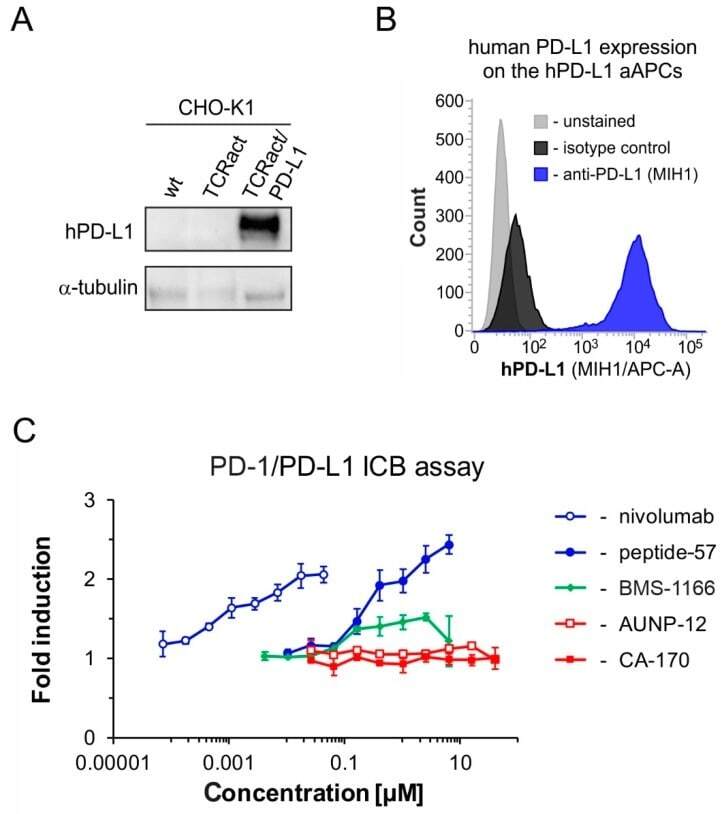
- Figure 5 The activities of the tested molecules in the cell-based in vitro immune checkpoint blockade assay. ( A ) Western blot analysis of the expression of the human PD-L1 protein in the hPD-L1 aAPCs (artificial antigen-presenting cells, CHO-K1 TCRact/PD-L1) in comparison to the original CHO-K1 cells (CHO-K1 wt) and CHO-K1 overexpressing only the TCR Activator molecule (CHO-K1 TCRact). ( B ) Flow cytometry analysis of the expression of human PD-L1 on the surface of the hPD-L1 aAPCs. ( C ) Comparison of bioactivities of the known PD-L1-targeting molecules: nivolumab, peptide-57 , BMS-1166 , and the tested molecules, CA-170 and AUNP-12 in the hPD-1/hPD-L1 immune checkpoint assay.
- Submitted by
- Invitrogen Antibodies (provider)
- Main image
- Experimental details
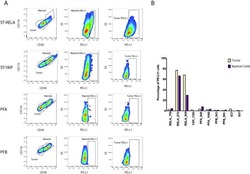
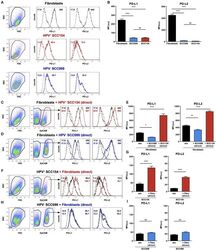
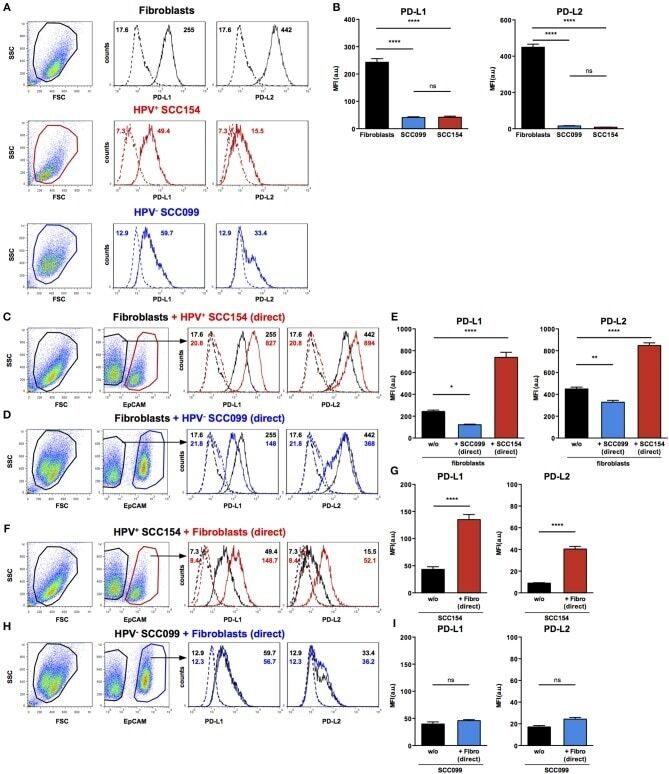
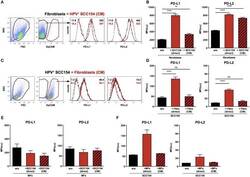
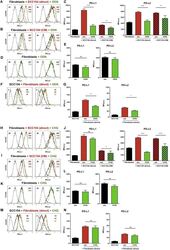
- Figure 3 HPV-positive HNSCCs increase PD-L1 and PD-L2 on fibroblasts. PD-L1 and PD-L2 expression on primary BJ human fibroblasts, HPV-positive (SCC154), and HPV-negative (SCC099) HNSCC cell lines (HNSCCs) was detected by flow cytometry. Illustrative histograms show PD-L1 and PD-L2 expression on fibroblasts (black histograms), HPV-positive (red histograms), or HPV-negative (blue histograms) HNSCCs (A) . Graphs show PD-L1 and PD-L2 expression (mean +- SEM; n = 5) in fibroblasts, HPV-positive, and HPV-negative HNSCCs (B) . Fibroblasts were cultured alone or co-cultured in direct contact (direct) with HPV-positive (SCC154) or HPV-negative (SCC099) HNSCCs. Fibroblasts were identified in co-cultures by lack of EpCAM expression. Illustrative histograms show PD-L1 and PD-L2 expression on fibroblasts cultured alone (black histograms) or co-cultured directly with HPV-positive SCC154 ( C ; red histograms) or HPV-negative SCC099 ( D ; blue histograms). Graphs show PD-L1 and PD-L2 expression (mean +- SEM; n = 5) on fibroblasts cultured alone (w/o) or co-cultured directly with HNSCC cells (E) . HPV-positive (SCC154) or HPV-negative (SCC099) HNSCCs were cultured alone or co-cultured in direct contact (direct) with fibroblasts. HNSCCs were identified in co-cultures by EpCAM expression. Illustrative histograms show PD-L1 and PD-L2 expression on HPV-positive SCC154 cultured alone (black histograms) or co-cultured directly with fibroblasts ( F ; red histograms). Graphs show PD-L1 and PD-
- Submitted by
- Invitrogen Antibodies (provider)
- Main image
- Experimental details
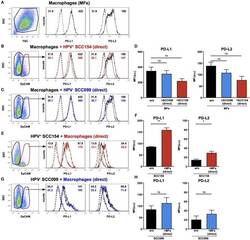
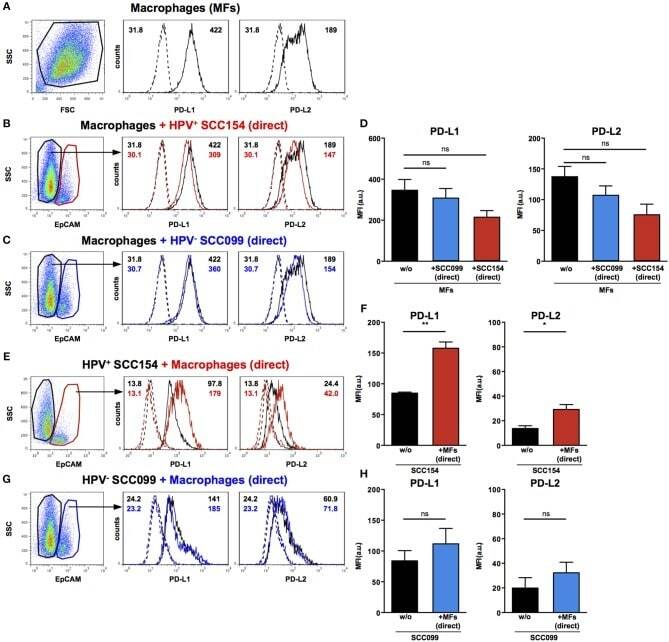
- Figure 4 PD-L1 and PD-L2 expression in co-cultures of macrophages and HPV-positive or HPV-negative HNSCCs. Macrophages were cultured alone (w/o) or co-cultured in direct contact (direct) with HPV-positive (SCC154) or HPV-negative (SCC099) HNSCC cell lines (HNSCCs). Illustrative histograms show PD-L1 and PD-L2 expression on macrophages cultured alone ( A ; black histograms). Macrophages were identified in co-cultures by lack of EpCAM expression. Illustrative histograms show PD-L1 and PD-L2 expression on macrophages cultured alone (black histograms) or co-cultured directly with HPV-positive SCC154 ( B ; red histograms) or HPV-negative SCC099 ( C ; blue histograms). Graphs show PD-L1 and PD-L2 expression (mean +- SEM; n = 4) on macrophages cultured alone (w/o) or co-cultured directly with HNSCCs (D) . HPV-positive (SCC154) or HPV-negative (SCC099) HNSCCs were cultured alone or co-cultured in direct contact (direct) with macrophages. HNSCCs were identified in co-cultures by EpCAM expression. Illustrative histograms show PD-L1 and PD-L2 expression on HPV-positive SCC154 cultured alone (black histograms) or co-cultured directly with macrophages ( E ; red histograms). Graphs show PD-L1 and PD-L2 expression (mean +- SEM; n = 3) on HPV-positive SCC154 cultured alone or co-cultured directly with macrophages (F) . Illustrative histograms show PD-L1 and PD-L2 expression on HPV-negative SCC099 cultured alone (black histograms) or co-cultured directly with macrophages ( G ; blue hist
- Submitted by
- Invitrogen Antibodies (provider)
- Main image
- Experimental details
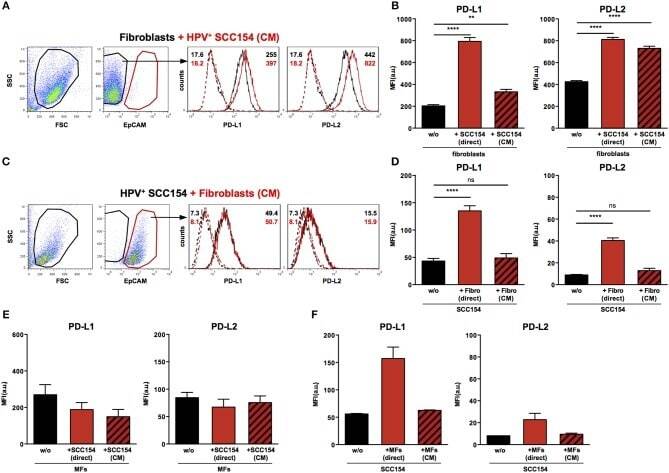
- Figure 5 Conditioned medium from HPV-positive HNSCCs up-regulates PD-L1 and PD-L2 on fibroblasts. Fibroblasts were cultured alone or co-cultured in direct contact with HPV-positive SCC154 (direct) or with conditioned medium from HPV-positive SCC154 (CM). Illustrative histograms show PD-L1 and PD-L2 expression on fibroblasts cultured alone (black histograms) or co-cultured with conditioned medium from HPV-positive SCC154 ( A ; red histograms). Graphs show PD-L1 and PD-L2 expression (mean +- SEM; n = 13) on fibroblasts cultured alone (w/o), co-cultured directly with HPV-positive SCC154 (direct) or with conditioned medium from HPV-positive SCC154 (CM) (B) . HPV-positive (SCC154) HNSCCs were cultured alone or co-cultured in direct contact with fibroblasts (Fibro direct) or with conditioned medium from fibroblasts (Fibro CM). Illustrative histograms show PD-L1 and PD-L2 expression on HPV-positive SCC154 cultured alone (black histograms) or co-cultured with conditioned medium from fibroblasts ( C ; red histograms). Graphs show PD-L1 and PD-L2 expression (mean +- SEM; n = 4) on HPV-positive SCC154 cultured alone (w/o), co-cultured directly with fibroblasts (Fibro direct) or with conditioned medium from fibroblasts (Fibro CM) (D) . Macrophages were cultured alone (w/o) or co-cultured in direct contact with HPV-positive SCC154 (direct) or with conditioned medium from HPV-positive SCC154 (CM). Graphs show PD-L1 and PD-L2 expression (mean +- SEM; n = 3) on macrophages for the in
- Submitted by
- Invitrogen Antibodies (provider)
- Main image
- Experimental details
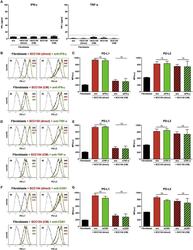
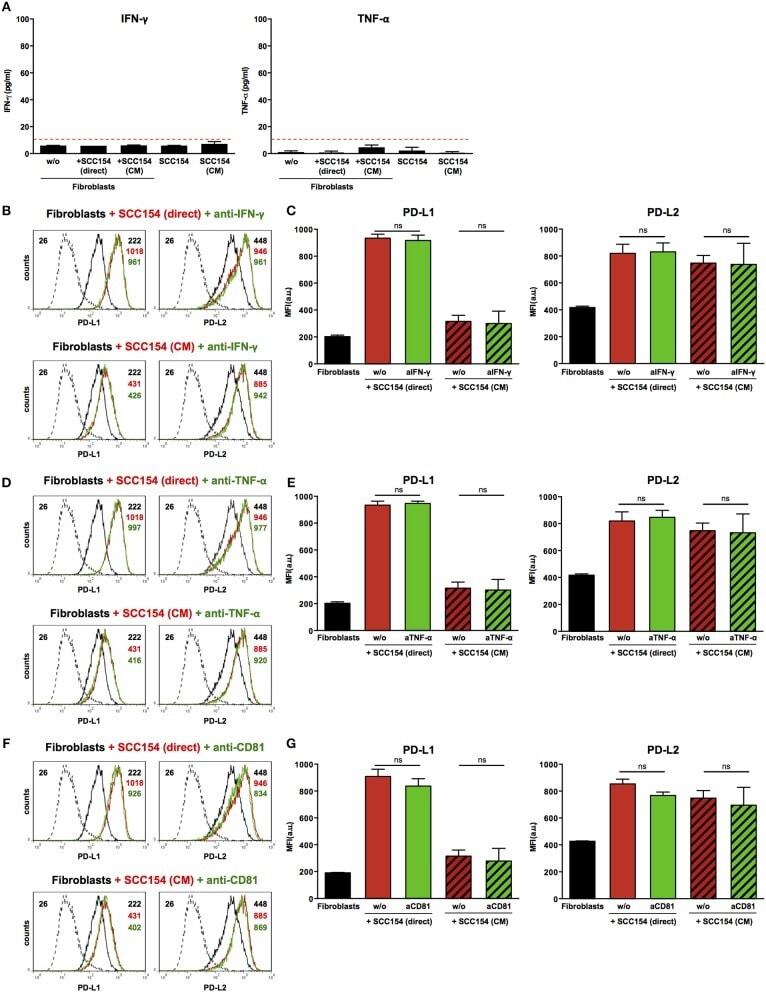
- Figure 6 Blockade of IFN-gamma, TNF-alpha, or CD81 does not affect PD-L1 and PD-L2 up-regulation by HPV-positive HNSCCs. Fibroblasts were cultured alone (w/o) or co-cultured in direct contact with HPV-positive SCC154 (SCC154 direct) or with conditioned medium from HPV-positive SCC154 (SCC154 CM) as indicated. Graphs (A) show IFN-gamma and TNF-alpha levels in culture supernatants (mean +- SEM; n = 4). The dashed red line indicates the lowest value (15.6 pg/ml) of the dynamic range for the ELISA assays used. Neutralizing antibodies anti-IFN-gamma (B,C) , anti-TNF-alpha (D,E) , or anti-CD81 (F,G) were added to the cultures as indicated. Illustrative histograms show PD-L1 and PD-L2 expression on fibroblasts cultured alone (black histograms), co-cultured directly with HPV-positive SCC154 or with conditioned medium from HPV-positive SCC154 alone (red histograms) or in the presence of blocking antibodies (green histograms). Graphs show PD-L1 and PD-L2 expression (mean +- SEM; n = 3) on fibroblasts for the indicated treatments. ns, not significant (one-way ANOVA with Bonferroni correction for multiple comparisons) Numbers adjacent to plots represent MFI values; dashed histograms show control staining with isotype-matched antibodies. MFI, mean fluorescence intensity.
- Submitted by
- Invitrogen Antibodies (provider)
- Main image
- Experimental details
- Figure 7 The TLR9 antagonists ODN TTAGGG and chloroquine inhibit PD-1 ligands up-regulation on fibroblasts co-cultured with HPV-positive HNSCCs. Fibroblasts were cultured alone (w/o) or co-cultured in direct contact with HPV-positive SCC154 (SCC154 direct) or with conditioned medium from HPV-positive SCC154 (SCC154 CM) in the presence or absence of the TLR9 antagonists ODN TTAGGG (ODN) or chloroquine (CHQ). Illustrative histograms show PD-L1 and PD-L2 expression on fibroblasts cultured alone (black histograms), co-cultured directly with HPV-positive SCC154 (red histograms) or co-cultured directly with HPV-positive SCC154 in the presence of ODN (A) or CHQ (H) (green histograms). Illustrative histograms show PD-L1 and PD-L2 expression on fibroblasts cultured alone (black histograms), cultured with conditioned medium from HPV-positive SCC154 (red histograms) or with conditioned medium from HPV-positive SCC154 in the presence of ODN (B) or CHQ (I) (green histograms). Graphs show PD-L1 and PD-L2 expression (mean +- SEM; n = 6) on fibroblasts for the indicated treatments (C,J) . Illustrative histograms show PD-L1 and PD-L2 expression on fibroblasts cultured alone (black histograms) or in the presence of ODN (D) or CHQ (K) (green histograms). Graphs show PD-L1 and PD-L2 expression (mean +- SEM; n = 4) on fibroblasts for the indicated treatments (E,L) . HPV-positive SCC154 were cultured alone or co-cultured in direct contact (direct) with fibroblasts in the presence
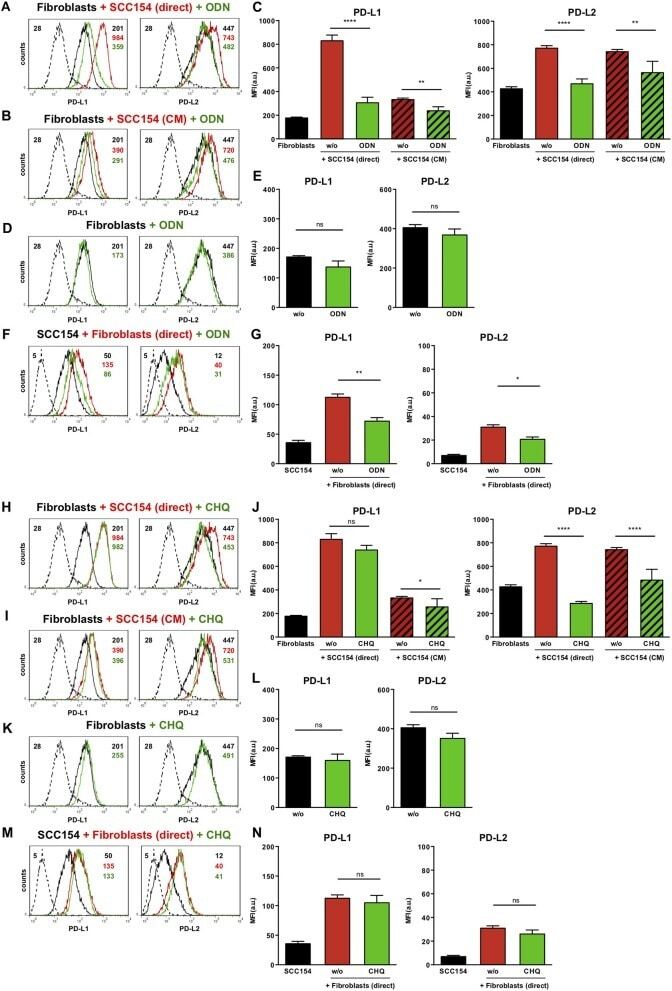
- Submitted by
- Invitrogen Antibodies (provider)
- Main image
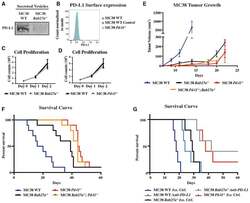
- Experimental details
- Figure 5. Exosomal PD-L1 Suppresses Tumor Progression in Syngeneic Colorectal Cancer Model (A) Western for PD-L1 in WT and Rab27a MC38 100k g extracellular fraction. (B) Flow cytometry for surface PD-L1 on MC38 cells. (C) Cell counts over time for Rab27a versus WT MC38 cells. n = 3. Error bars represent SD. (D) Cell counts over time for Pd-l1 versus WT MC38 cells. n = 3. Error bars represent SD. (E) Tumor growth over time following subcutaneous injection of 1 x 10 6 WT, Rab27a , or Pd-l1 MC38 cells into immunocompetent B6 mice. n = 5 for each genotype. Error bars represent SEM. MC38 WT versus MC38 Rab27a , p < 0.05. MC38 WT versus MC38 Pd-l1 , p < 0.05. MC38 WT versus MC38 Pd-l1 ; Rab27a , p < 0.05 (two-way ANOVA test). (F) Mouse survival curve following injection of cells like in (D). n = 10 for each genotype. MC38 WT versus MC38 Rab27a , p < 0.001. MC38 WT versus MC38 Pd-l1 , p < 0.001. MC38 WT versus MC38 Pd-l1 ; Rab27a , p < 0.001 (log rank test). (G) Survival curve for mice injected with WT, Rab27a , or Pd-l1 MC38 cells followed by treatment with either anti-PD-L1 or isotype control antibody. n = 5 for each condition. MC38 WT isotype versus MC38 WT anti-PD-L1, p < 0.01. MC38 Rab27a isotype versus MC38 Rab27a anti-PD-L1, p < 0.05. MC38 Pd-l1 isotype versus MC38 Rab27a anti-PD-L1, ns. (log rank test). See also Figure S7 .