Explore
 Validate
 Learn
Learn61-5983-42
antibody from Invitrogen Antibodies
Targeting: CD274
B7-H, B7-H1, B7H1, PD-L1, PDCD1LG1, PDL1
 Flow cytometry
Antibody data
- Antibody Data
- Antigen structure
- References [19]
- Comments [0]
- Validations
- Flow cytometry [1]
- Other assay [25]
Submit
Validation data
Reference
Comment
Report error
- Product number
- 61-5983-42 - Provider product page

- Provider
- Invitrogen Antibodies
- Product name
- CD274 (PD-L1, B7-H1) Monoclonal Antibody (MIH1), PE-eFluor™ 610, eBioscience™
- Antibody type
- Monoclonal
- Antigen
- Other
- Description
- Description: The MIH1 monoclonal antibody reacts with human B7-H1, also known as PD-L1. B7-H1, a member of the B7 family, has a predicted molecular weight of approximately 40 kDa and belongs to the Ig superfamily. B7-H1 is expressed on a majority of leukocytes. B7-H1 is a ligand for PD-1. Interaction of PD-1 with either PD-L1 (B7-H1) or PD-L2 (B7-DC) results in inhibition of T and B cell responses. MIH1 is reported to be a blocking antibody. Applications Reported: This MIH1 antibody has been reported for use in flow cytometric analysis. Applications Tested: This MIH1 antibody has been pre-diluted and tested by flow cytometric analysis of normal human peripheral blood cells. This may be used at 5 µL (0.25 µg) per test. A test is defined as the amount (µg) of antibody that will stain a cell sample in a final volume of 100 µL. Cell number should be determined empirically but can range from 10^5 to 10^8 cells/test. PE-eFluor™ 610 can be excited with laser lines from 488-561 nm and emits at 607 nm. We recommend using a 610/20 band pass filter (equivalent to PE-Texas Red™). Please make sure that your instrument is capable of detecting this fluorochrome. Light sensitivity: This tandem dye is sensitive to photo-induced oxidation. Please protect this vial and stained samples from light. Fixation: Samples can be stored in IC Fixation Buffer (Product # 00-8222) (100 µL of cell sample + 100 µL of IC Fixation Buffer) or 1-step Fix/Lyse Solution (Product # 00-5333) for up to 3 days in the dark at 4°C with minimal impact on brightness and FRET efficiency/compensation. Some generalizations regarding fluorophore performance after fixation can be made, but clone specific performance should be determined empirically. Excitation: 488-561 nm; Emission: 607 nm; Laser: Blue Laser, Green Laser, Yellow-Green Laser. Filtration: 0.2 µm post-manufacturing filtered.
- Reactivity
- Human
- Host
- Mouse
- Isotype
- IgG
- Antibody clone number
- MIH1
- Vial size
- 100 Tests
- Concentration
- 5 µL/Test
- Storage
- 4° C, store in dark, DO NOT FREEZE!
Submitted references PD-L1 CAR effector cells induce self-amplifying cytotoxic effects against target cells.
Different Induction of PD-L1 (CD274) and PD-1 (CD279) Expression in THP-1-Differentiated Types 1 and 2 Macrophages.
Microbe-Mediated Activation of Toll-like Receptor 2 Drives PDL1 Expression in HNSCC.
Concomitant High Apoptosis Inhibitor of Macrophage (AIM) and Low Prostate-Specific Antigen (PSA) Indicates Activated T Cell-Mediated Anticancer Immunity, Enhance Sensitivity to Pembrolizumab, and Elicit Good Prognosis in Prostate Cancer.
Protocol for high-throughput compound screening using flow cytometry in THP-1 cells.
Ruxolitinib reverses checkpoint inhibition by reducing programmed cell death ligand-1 (PD-L1) expression and increases anti-tumour effects of T cells in multiple myeloma.
IL-27 Mediates PD-L1 Expression and Release by Human Mesothelioma Cells.
β-Catenin induces transcriptional expression of PD-L1 to promote glioblastoma immune evasion.
TASL is the SLC15A4-associated adaptor for IRF5 activation by TLR7-9.
Cancer cell-intrinsic expression of MHC II in lung cancer cell lines is actively restricted by MEK/ERK signaling and epigenetic mechanisms.
Protein kinase D3 regulates the expression of the immunosuppressive protein, PD‑L1, through STAT1/STAT3 signaling.
Phospho‑STAT1 expression as a potential biomarker for anti‑PD‑1/anti‑PD‑L1 immunotherapy for breast cancer.
Quantitative Interactomics in Primary T Cells Provides a Rationale for Concomitant PD-1 and BTLA Coinhibitor Blockade in Cancer Immunotherapy.
High PD-L1 Expression Predicts for Worse Outcome of Leukemia Patients with Concomitant NPM1 and FLT3 Mutations.
Generation of Tumor-Reactive T Cells by Co-culture of Peripheral Blood Lymphocytes and Tumor Organoids.
Apigenin suppresses PD-L1 expression in melanoma and host dendritic cells to elicit synergistic therapeutic effects.
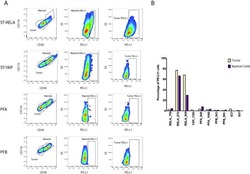
Specific expression of PD-L1 in RELA-fusion supratentorial ependymoma: Implications for PD-1-targeted therapy.
Similarities and differences between helminth parasites and cancer cell lines in shaping human monocytes: Insights into parallel mechanisms of immune evasion.
Alterations of immune response of Non-Small Cell Lung Cancer with Azacytidine.
Bajor M, Graczyk-Jarzynka A, Marhelava K, Burdzinska A, Muchowicz A, Goral A, Zhylko A, Soroczynska K, Retecki K, Krawczyk M, Klopotowska M, Pilch Z, Paczek L, Malmberg KJ, Wälchli S, Winiarska M, Zagozdzon R
Journal for immunotherapy of cancer 2022 Jan;10(1)
Journal for immunotherapy of cancer 2022 Jan;10(1)
Different Induction of PD-L1 (CD274) and PD-1 (CD279) Expression in THP-1-Differentiated Types 1 and 2 Macrophages.
Lai CY, Tseng PC, Chen CL, Satria RD, Wang YT, Lin CF
Journal of inflammation research 2021;14:5241-5249
Journal of inflammation research 2021;14:5241-5249
Microbe-Mediated Activation of Toll-like Receptor 2 Drives PDL1 Expression in HNSCC.
Mann JE, Ludwig ML, Kulkarni A, Scheftz EB, Murray IR, Zhai J, Gensterblum-Miller E, Jiang H, Brenner JC
Cancers 2021 Sep 24;13(19)
Cancers 2021 Sep 24;13(19)
Concomitant High Apoptosis Inhibitor of Macrophage (AIM) and Low Prostate-Specific Antigen (PSA) Indicates Activated T Cell-Mediated Anticancer Immunity, Enhance Sensitivity to Pembrolizumab, and Elicit Good Prognosis in Prostate Cancer.
Bamodu OA, Wang YH, Yeh CT, Ho CH, Chiang YT, Kao WT, Liu CH, Wu CC
Biomedicines 2021 Sep 15;9(9)
Biomedicines 2021 Sep 15;9(9)
Protocol for high-throughput compound screening using flow cytometry in THP-1 cells.
Spangenberg SH, Zavareh RB, Lairson LL
STAR protocols 2021 Jun 18;2(2):100400
STAR protocols 2021 Jun 18;2(2):100400
Ruxolitinib reverses checkpoint inhibition by reducing programmed cell death ligand-1 (PD-L1) expression and increases anti-tumour effects of T cells in multiple myeloma.
Chen H, Li M, Ng N, Yu E, Bujarski S, Yin Z, Wen M, Hekmati T, Field D, Wang J, Nassir I, Yu J, Huang J, Daniely D, Wang CS, Xu N, Spektor TM, Berenson JR
British journal of haematology 2021 Feb;192(3):568-576
British journal of haematology 2021 Feb;192(3):568-576
IL-27 Mediates PD-L1 Expression and Release by Human Mesothelioma Cells.
Carbotti G, Dozin B, Martini S, Giordano C, Scordamaglia F, Croce M, Filaci G, Ferrini S, Fabbi M
Cancers 2021 Aug 9;13(16)
Cancers 2021 Aug 9;13(16)
β-Catenin induces transcriptional expression of PD-L1 to promote glioblastoma immune evasion.
Du L, Lee JH, Jiang H, Wang C, Wang S, Zheng Z, Shao F, Xu D, Xia Y, Li J, Zheng Y, Qian X, Li X, Kim HR, Xing D, Liu P, Lu Z, Lyu J
The Journal of experimental medicine 2020 Nov 2;217(11)
The Journal of experimental medicine 2020 Nov 2;217(11)
TASL is the SLC15A4-associated adaptor for IRF5 activation by TLR7-9.
Heinz LX, Lee J, Kapoor U, Kartnig F, Sedlyarov V, Papakostas K, César-Razquin A, Essletzbichler P, Goldmann U, Stefanovic A, Bigenzahn JW, Scorzoni S, Pizzagalli MD, Bensimon A, Müller AC, King FJ, Li J, Girardi E, Mbow ML, Whitehurst CE, Rebsamen M, Superti-Furga G
Nature 2020 May;581(7808):316-322
Nature 2020 May;581(7808):316-322
Cancer cell-intrinsic expression of MHC II in lung cancer cell lines is actively restricted by MEK/ERK signaling and epigenetic mechanisms.
Neuwelt AJ, Kimball AK, Johnson AM, Arnold BW, Bullock BL, Kaspar RE, Kleczko EK, Kwak JW, Wu MH, Heasley LE, Doebele RC, Li HY, Nemenoff RA, Clambey ET
Journal for immunotherapy of cancer 2020 Apr;8(1)
Journal for immunotherapy of cancer 2020 Apr;8(1)
Protein kinase D3 regulates the expression of the immunosuppressive protein, PD‑L1, through STAT1/STAT3 signaling.
Cui B, Chen J, Luo M, Wang L, Chen H, Kang Y, Wang J, Zhou X, Feng Y, Zhang P
International journal of oncology 2020 Apr;56(4):909-920
International journal of oncology 2020 Apr;56(4):909-920
Phospho‑STAT1 expression as a potential biomarker for anti‑PD‑1/anti‑PD‑L1 immunotherapy for breast cancer.
Nakayama Y, Mimura K, Tamaki T, Shiraishi K, Kua LF, Koh V, Ohmori M, Kimura A, Inoue S, Okayama H, Suzuki Y, Nakazawa T, Ichikawa D, Kono K
International journal of oncology 2019 Jun;54(6):2030-2038
International journal of oncology 2019 Jun;54(6):2030-2038
Quantitative Interactomics in Primary T Cells Provides a Rationale for Concomitant PD-1 and BTLA Coinhibitor Blockade in Cancer Immunotherapy.
Celis-Gutierrez J, Blattmann P, Zhai Y, Jarmuzynski N, Ruminski K, Grégoire C, Ounoughene Y, Fiore F, Aebersold R, Roncagalli R, Gstaiger M, Malissen B
Cell reports 2019 Jun 11;27(11):3315-3330.e7
Cell reports 2019 Jun 11;27(11):3315-3330.e7
High PD-L1 Expression Predicts for Worse Outcome of Leukemia Patients with Concomitant NPM1 and FLT3 Mutations.
Brodská B, Otevřelová P, Šálek C, Fuchs O, Gašová Z, Kuželová K
International journal of molecular sciences 2019 Jun 10;20(11)
International journal of molecular sciences 2019 Jun 10;20(11)
Generation of Tumor-Reactive T Cells by Co-culture of Peripheral Blood Lymphocytes and Tumor Organoids.
Dijkstra KK, Cattaneo CM, Weeber F, Chalabi M, van de Haar J, Fanchi LF, Slagter M, van der Velden DL, Kaing S, Kelderman S, van Rooij N, van Leerdam ME, Depla A, Smit EF, Hartemink KJ, de Groot R, Wolkers MC, Sachs N, Snaebjornsson P, Monkhorst K, Haanen J, Clevers H, Schumacher TN, Voest EE
Cell 2018 Sep 6;174(6):1586-1598.e12
Cell 2018 Sep 6;174(6):1586-1598.e12
Apigenin suppresses PD-L1 expression in melanoma and host dendritic cells to elicit synergistic therapeutic effects.
Xu L, Zhang Y, Tian K, Chen X, Zhang R, Mu X, Wu Y, Wang D, Wang S, Liu F, Wang T, Zhang J, Liu S, Zhang Y, Tu C, Liu H
Journal of experimental & clinical cancer research : CR 2018 Oct 29;37(1):261
Journal of experimental & clinical cancer research : CR 2018 Oct 29;37(1):261
Specific expression of PD-L1 in RELA-fusion supratentorial ependymoma: Implications for PD-1-targeted therapy.
Witt DA, Donson AM, Amani V, Moreira DC, Sanford B, Hoffman LM, Handler MH, Levy JMM, Jones KL, Nellan A, Foreman NK, Griesinger AM
Pediatric blood & cancer 2018 May;65(5):e26960
Pediatric blood & cancer 2018 May;65(5):e26960
Similarities and differences between helminth parasites and cancer cell lines in shaping human monocytes: Insights into parallel mechanisms of immune evasion.
Narasimhan PB, Akabas L, Tariq S, Huda N, Bennuru S, Sabzevari H, Hofmeister R, Nutman TB, Tolouei Semnani R
PLoS neglected tropical diseases 2018 Apr;12(4):e0006404
PLoS neglected tropical diseases 2018 Apr;12(4):e0006404
Alterations of immune response of Non-Small Cell Lung Cancer with Azacytidine.
Wrangle J, Wang W, Koch A, Easwaran H, Mohammad HP, Vendetti F, Vancriekinge W, Demeyer T, Du Z, Parsana P, Rodgers K, Yen RW, Zahnow CA, Taube JM, Brahmer JR, Tykodi SS, Easton K, Carvajal RD, Jones PA, Laird PW, Weisenberger DJ, Tsai S, Juergens RA, Topalian SL, Rudin CM, Brock MV, Pardoll D, Baylin SB
Oncotarget 2013 Nov;4(11):2067-79
Oncotarget 2013 Nov;4(11):2067-79
No comments: Submit comment
Supportive validation
- Submitted by
- Invitrogen Antibodies (provider)
- Main image

- Experimental details
- Staining of unstimulated (left) or PHA-stimulated (right) normal human peripheral blood cells with Mouse IgG1 K Isotype Control PE-eFluor® 610 (Product # 61-4714-82) (blue histogram) or Anti-Human CD274 (B7-H1) PE-eFluor® 610 (purple histogram). Viable cells in the lymphocyte gate, as determined by Fixable Viability Dye eFluor® 780 (Product # 65-0865-14), were used for analysis.

Supportive validation
- Submitted by
- Invitrogen Antibodies (provider)
- Main image
- Experimental details
- NULL
- Submitted by
- Invitrogen Antibodies (provider)
- Main image
- Experimental details
- NULL

- Submitted by
- Invitrogen Antibodies (provider)
- Main image
- Experimental details
- NULL

- Submitted by
- Invitrogen Antibodies (provider)
- Main image
- Experimental details
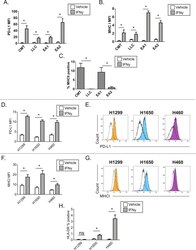
- Figure 2 Interferon gamma responsiveness in mouse and human NSCLC cell lines. In A-C, cultured cell lines (CMT167, LLC, EA1, EA2) were treated with vehicle or 100 ng/mL IFNgamma for 48 hours, and analyzed by flow cytometry for cell surface expression of (A) PD-L1, (B) MHC I, or (C) MHC II. Data for PD-L1 and MHC I are defined by median fluorescent intensity (MFI) of all cells, given the uniform induction of these proteins ( online supplementary figure 1 ). MHC II expression is defined as the frequency of positive cells, based on MHC II induction in a subset of cells ( online supplementary figure 2 ). Statistical analysis in (A, B) defined between vehicle and IFNgamma treated samples using an unpaired T-test (statistical significance identified by *p
- Submitted by
- Invitrogen Antibodies (provider)
- Main image
- Experimental details
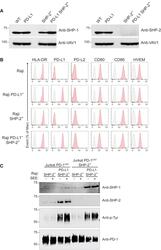
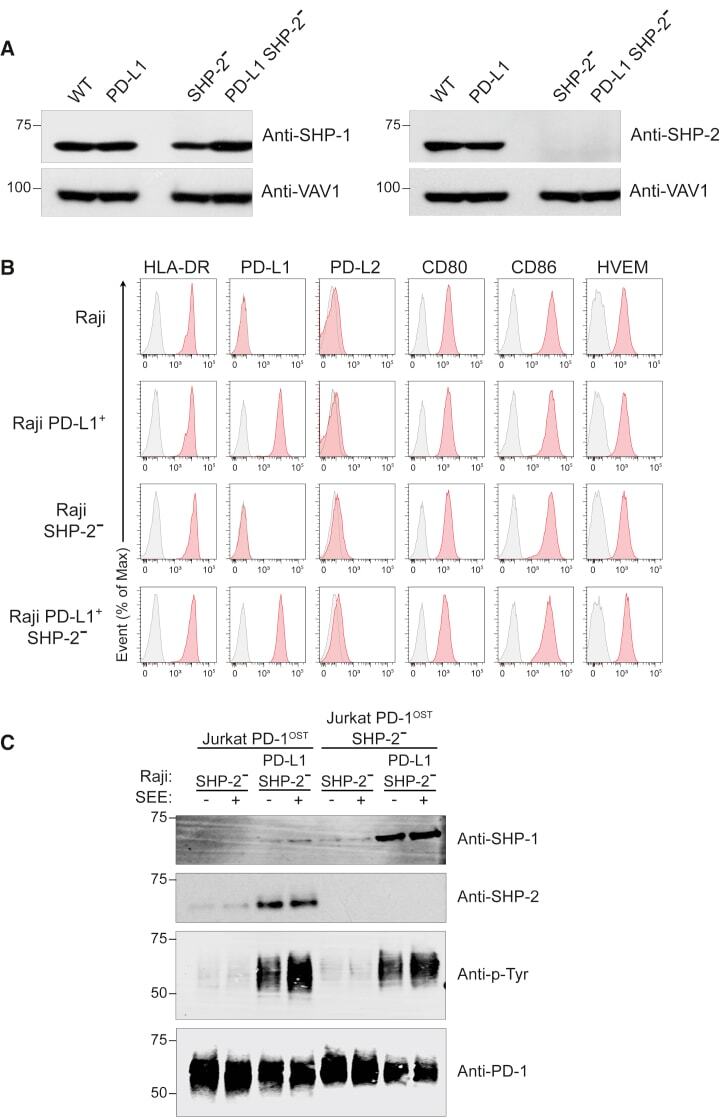
- Figure 6 SHP-1 Can Replace SHP-2 for PD-1 Coinhibition in Jurkat T Cells (A) Immunoblot analysis of equal amounts of proteins from total lysates of Raji (WT), Raji PD-L1, Raji SHP-2 - , and Raji PD-L1 SHP-2 - cells probed with antibodies to SHP-1 (right panel), SHP-2 (left panel), or VAV1 (loading control). Left margin, molecular size in kilodaltons. Data are representative of two independent experiments. (B) Raji, Raji PD-L1, Raji SHP-2 - , and Raji PD-L1 SHP-2 - cells were analyzed using flow cytometry for expression of HLA-DR, PD-L1, PD-L2, CD80, CD86, and HVEM. Gray shaded curves correspond to isotype-matched control antibody (negative control), and data are representative of two independent experiments. (C) Jurkat-PD-1 OST and Jurkat-PD-1 OST SHP-2 - cells were stimulated with Raji SHP-2 - cells or Raji PD-L1 SHP-2 - cells that have been preincubated in the absence (-) or presence (+) of SEE and lysed for 2 min after the initial contact. Immunoblot analysis of equal amounts (90%) of lysates from the specified conditions subjected to affinity purification (AP) on Strep-Tactin-Sepharose beads, followed by elution of proteins with D-biotin, and probed with antibody to anti-SHP-1, anti-SHP-2, and phosphorylated proteins (Anti-p-Tyr). Also shown is immunoblot analysis of equal amounts (10%) of total lysates of the specified cells probed with anti-PD-1 antibody (loading control). Left margin, molecular size in kilodaltons (kDa). Data are representative of two independent exper
- Submitted by
- Invitrogen Antibodies (provider)
- Main image
- Experimental details
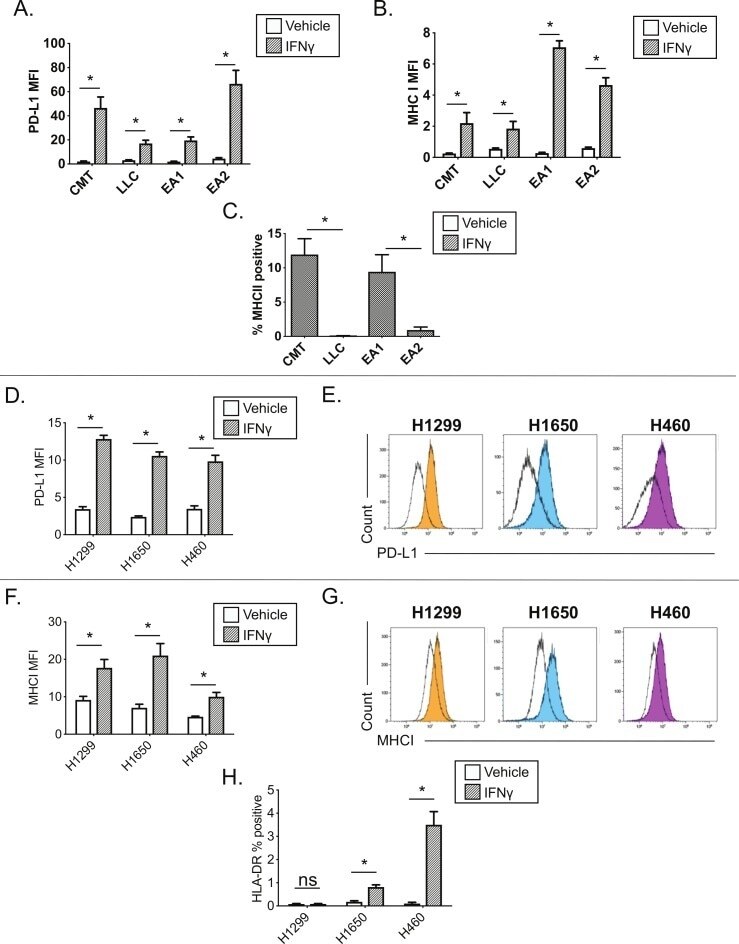
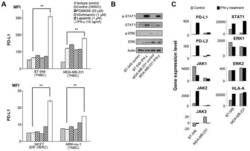
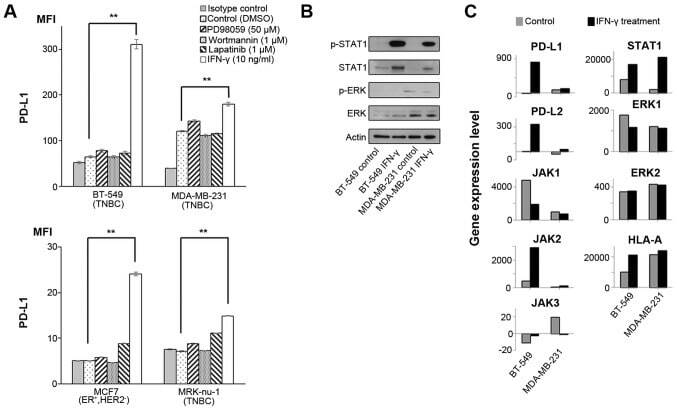
- Figure 1 Effects of IFN-gamma on PD-L1 and signaling pathways. (A) PD-L1 expression was measured by flow cytometry in the cell lines at 48 h following treatment with DMSO, which was used as a vehicle control, 50 u M PD98059 (MAPK inhibitor), 1 u M wortmannin (PI3K-AKT inhibitor), 1 u M lapatinib (combined epidermal growth factor receptor/human epidermal growth factor receptor 2 tyrosine kinase inhibitor), and 10 ng/ml IFN-gamma. Error bars represent the means +- SEM. ** P
- Submitted by
- Invitrogen Antibodies (provider)
- Main image
- Experimental details
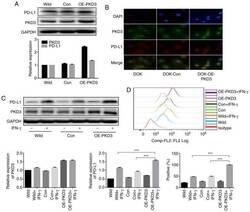
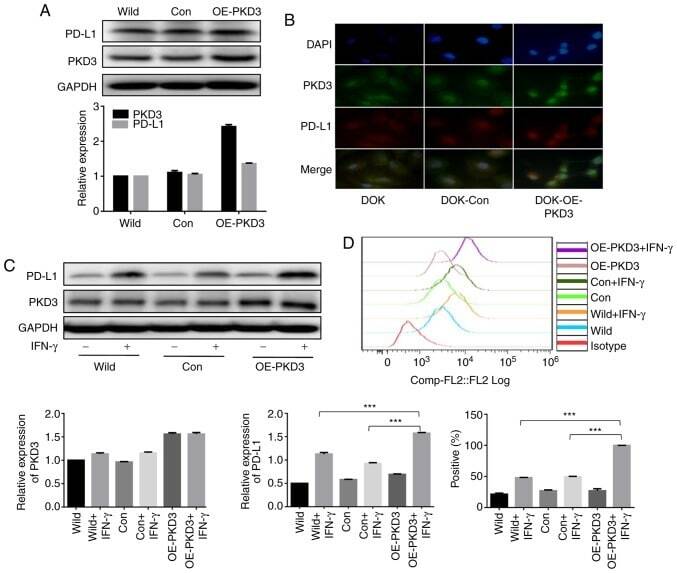
- Figure 3 PKD3 overexpression enhances IFN-gamma-induced PD-L1 expression in DOK cells. (A and B) The levels of PKD3 and PD-L1 protein were examined by western blot analysis and immunofluorescence. The PKD3 overexpression plasmid was transfected into DOK cells using Lipofectamine 2000. (C and D) Cells transfected with the PKD3 overexpression plasmid and cells transfected with control shRNA were cultured in the presence or absence of IFN-gamma (20 ng/ml) for 24 h. The expression levels of PKD3 and PD-L1 were determined by western blot analysis. In addition, the cell surface expression of PD-L1 was analyzed by flow cytometry. Data are presented as the means +- SD (n=3). *** P
- Submitted by
- Invitrogen Antibodies (provider)
- Main image
- Experimental details
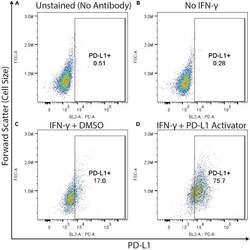
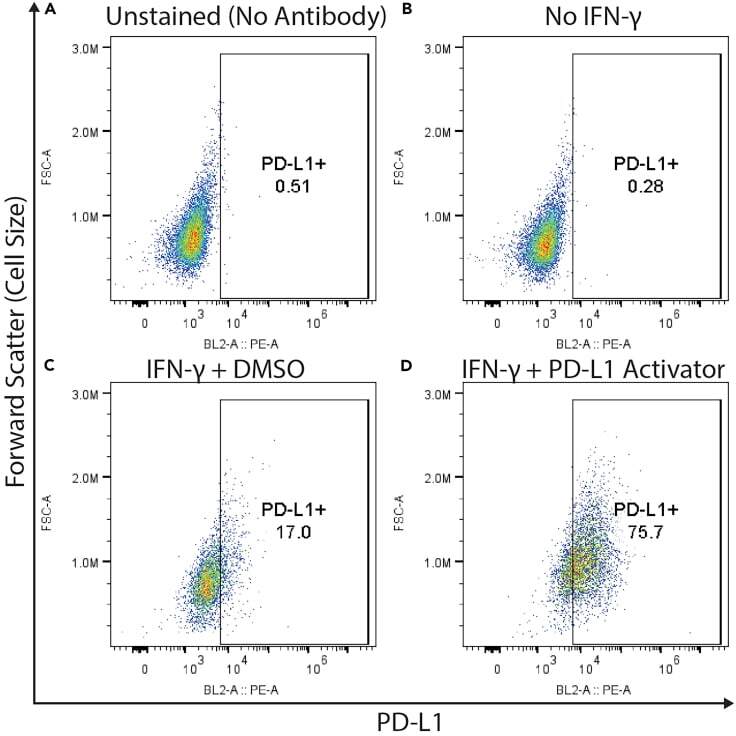
- Figure 3 Example flow cytometry plots demonstrating gating for PD-L1 positive cells THP-1 cells were (A and C) treated with IFN-gamma (50 ng/mL, approximate EC20 of PD-L1 activation), (B) left untreated, or (D) treated with IFN-gamma and a compound which we have identified that increases PD-L1 expression (unpublished data). Cells represented in (A) were not stained with the PE conjugated anti-PD-L1 antibody, whereas (B, C and D) were. All four groups of cells were otherwise stained (including fixable viability dye) and analyzed by flow cytometry as described in this protocol. All plots depict viable cells, gated as seen in Figure 2 .
- Submitted by
- Invitrogen Antibodies (provider)
- Main image
- Experimental details
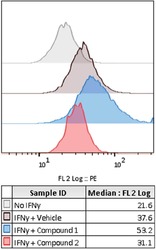
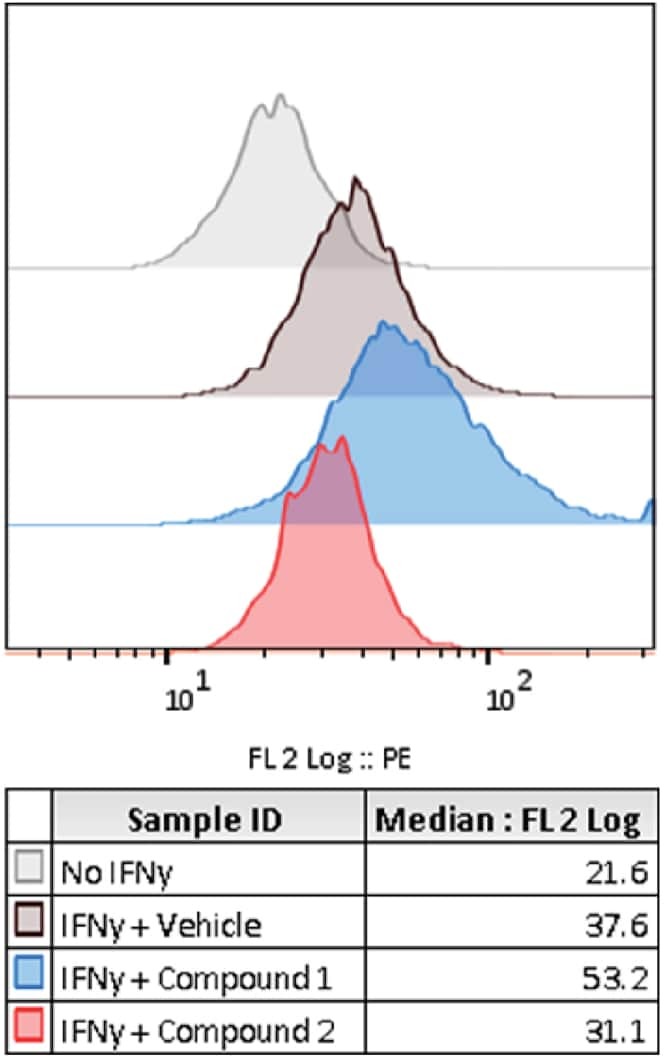
- Figure 5 Representative control and compound treated wells Flow cytometry histogram plots showing PD-L1 expression (PE fluorescence signal) for wells treated with either No IFN-gamma, IFN-gamma and vehicle, or IFN-gamma and one of two compounds from a screening library which were identified as modulating PD-L1 expression.
- Submitted by
- Invitrogen Antibodies (provider)
- Main image
- Experimental details
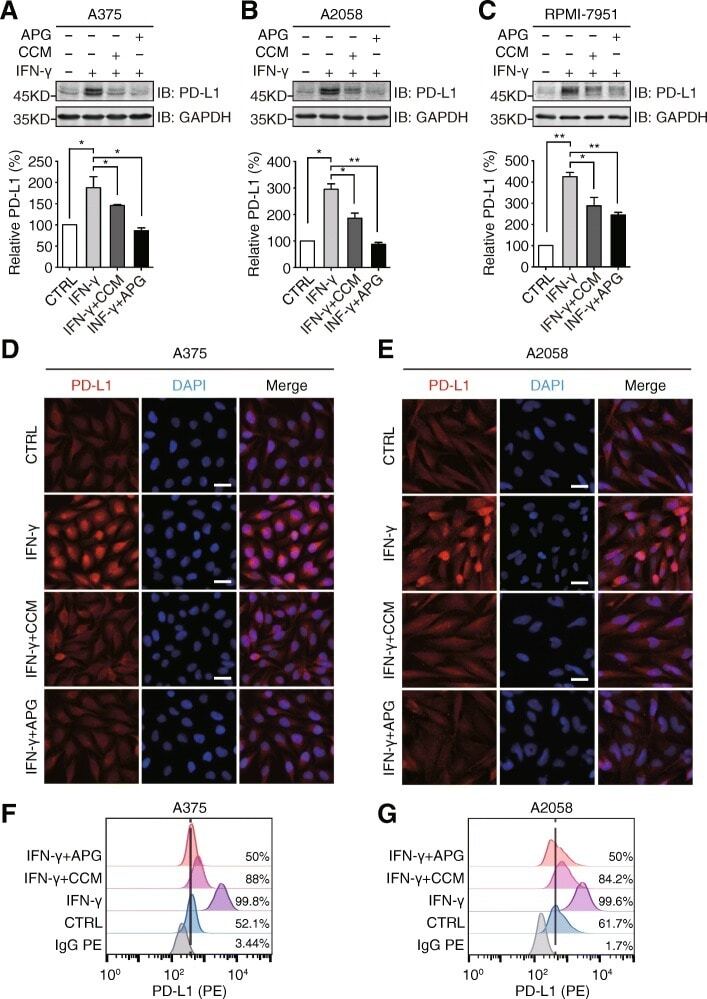
- Fig. 3 Apigenin and curcumin suppress IFN-gamma-induced PD-L1 expression in human melanoma cells. a - c indicated melanoma cells were pretreated with DMSO, curcumin (25 muM), or apigenin (30 muM) for 4 h and then treated with IFN-gamma (10 ng/ml) for 24 h. Cells were lysed and PD-L1 expression was detected by Western blotting using a PD-L1 antibody. GAPDH was used as a loading control. Column charts below show quantitation data of relative PD-L1 expression. Error bars represent the mean +- S.D. ( n = 3, * P < 0.05 and ** P < 0.01). d and e cells were treated as described above and processed for immunofluorescence analysis. Representative micrographs show PD-L1 staining from different groups with same intensity settings on a fluorescent microscope (Olympus, Japan). DAPI stains nucleus. Scale bar = 25 mum. f and g , A375 and A2058 cells were treated as described above, and cell surface PD-L1 expression was determined by flow cytometry
- Submitted by
- Invitrogen Antibodies (provider)
- Main image

- Experimental details
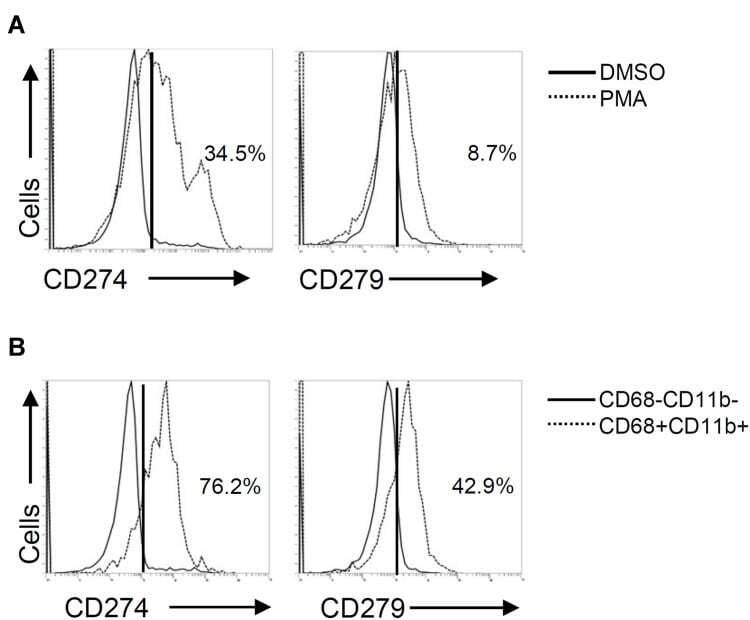
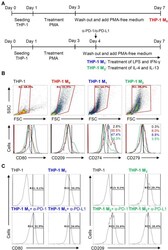
- Figure 3 Phorbol 12-myristate 13-acetate (PMA) treatment induces PD-L1 (CD274) and PD-1 (CD279) expression in THP-1-differentiated macrophages. According to the experimental design shown in Figure 1A , immunostaining followed by flow cytometric histogram and dot-plot analysis showed the expression of PD-L1 (CD274) and PD-1 (CD279) in PMA-treated THP-1 cells ( A ) without or ( B ) with the gating of CD68 - CD11b - and CD68 + CD11b + cells. Representative data were selectively obtained from three individual experiments, and the percentage of positive cells is shown.
- Submitted by
- Invitrogen Antibodies (provider)
- Main image
- Experimental details
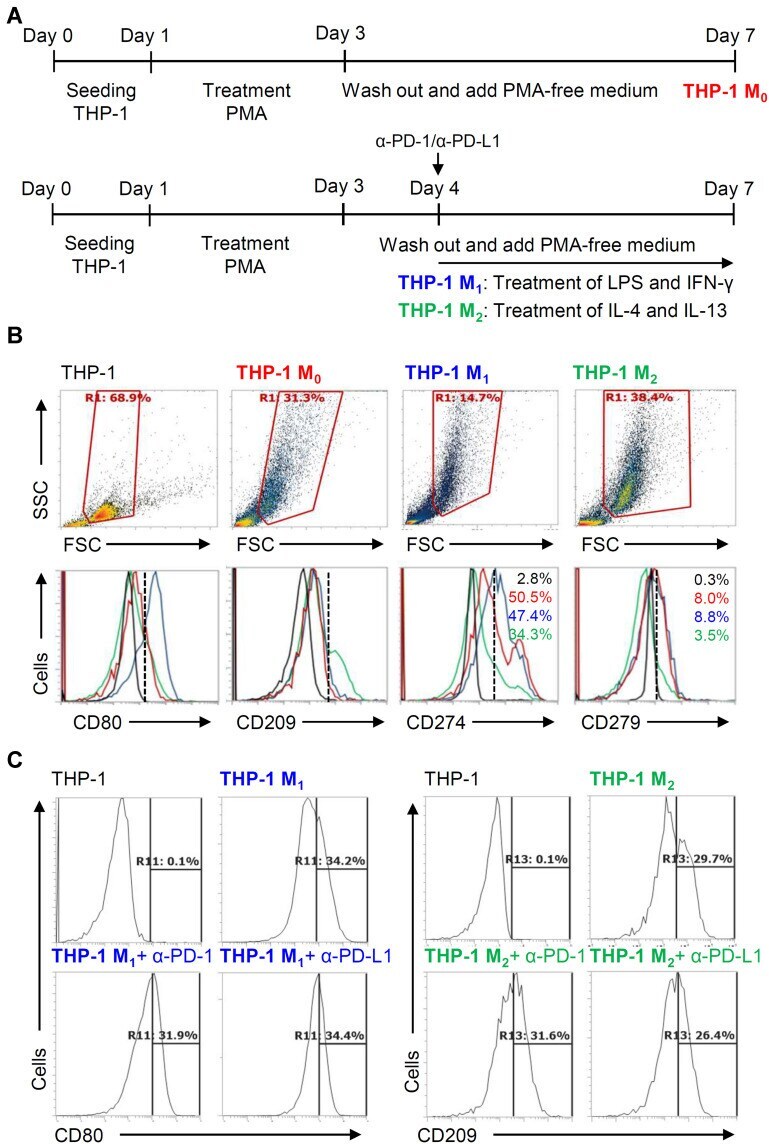
- Figure 5 Different expression of PD-L1 (CD274) and PD-1 (CD279) in THP-1-differentiated macrophages. ( A ) In PMA-stimulated THP-1-differentiated M 0 macrophages, cells were then treated with LPS (1 mug/mL)/IFN-gamma (10 ng/mL) and IL-4 (25 ng/mL)/IL-13 (25 ng/mL) for polarization of M 1 and M 2 , respectively, in the absence and presence of neutralizing antibodies (5 mug/mL) against CD274 (alpha-PD-L1) and CD279 (alpha-PD-1) according to the experimental design. ( B ) For immunostaining, cells were stained with CD80 and CD209 for dissecting M 1 and M 2 , respectively. Immunostaining followed by flow cytometric histogram analysis showed the expression of CD274 and CD279 in these cells. ( C ) Furthermore, the expression of CD80 and CD209 in M 1 and M 2 without or with the blockade of CD274 and CD279 were shown. For all flow cytometric analysis, representative data were selectively obtained from three individual experiments, and the percentage of positive cells is shown. THP-1 (black); THP-1 M 0 (red); THP-1 M 1 (blue); THP-1 M 2 (green).
- Submitted by
- Invitrogen Antibodies (provider)
- Main image
- Experimental details
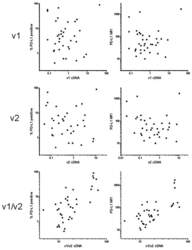
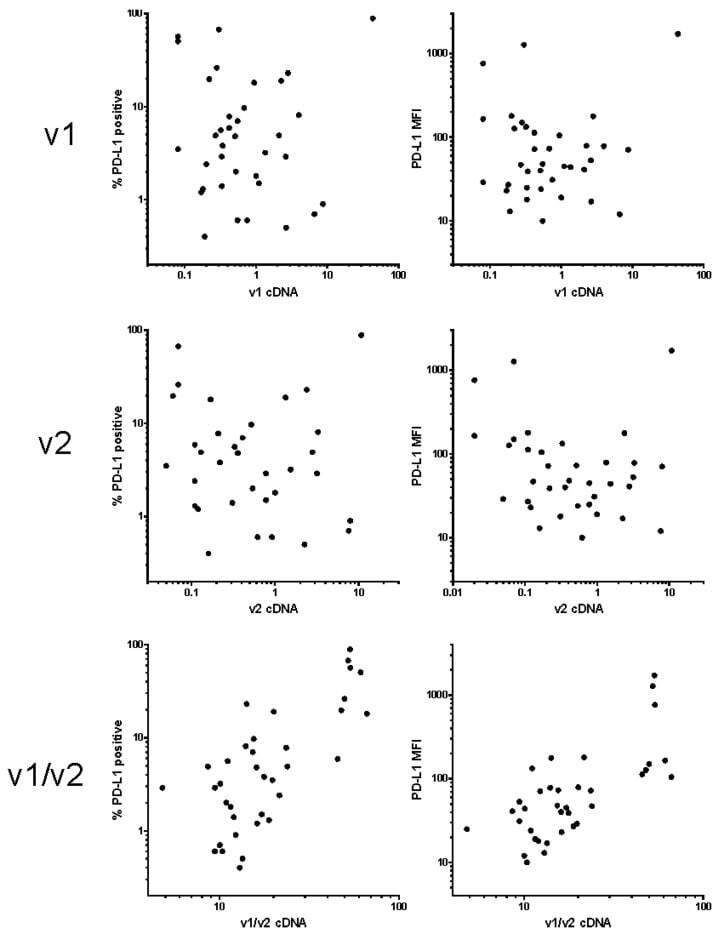
- Figure 2 Correlation of PD-L1 cell surface amount with the transcript levels. The amount of PD-L1 on acute myeloid leukemia (AML) blast surface was determined using flow cytometry and expressed as the percentage of positive cells (left column) or as the mean fluorescence intensity (MFI) of the blast population (right column). The relative levels of v1 and v2 transcripts were measured by PCR and normalized to GAPDH.
- Submitted by
- Invitrogen Antibodies (provider)
- Main image
- Experimental details
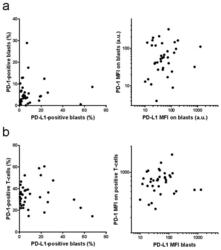
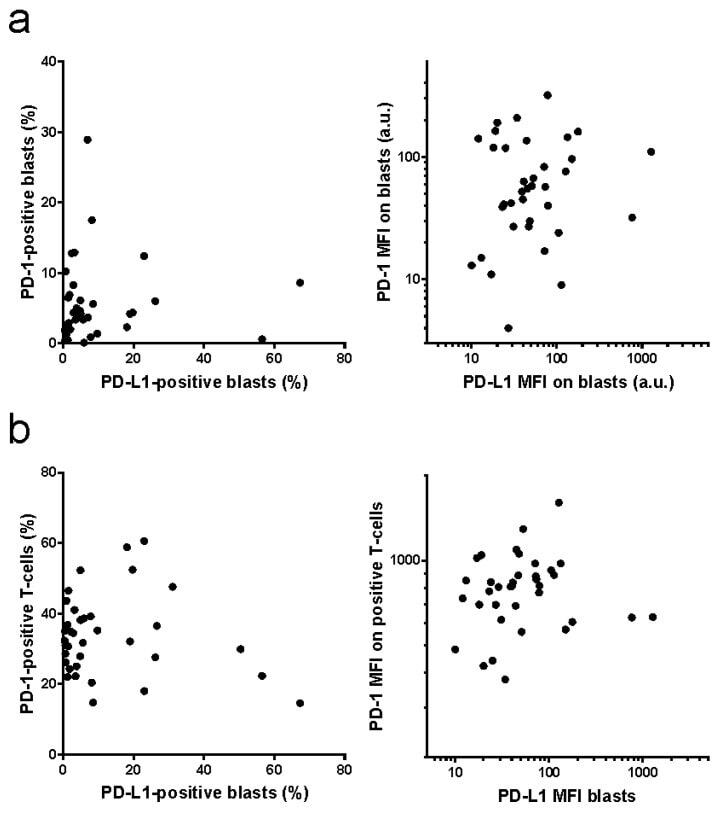
- Figure 5 Correlation of PD-L1 and PD-1 expression. PD-L1 expression on AML blasts and PD-1 expression on AML blasts ( a ) or on the autologous T-cells ( b ) was determined by flow cytometry. Left: positive cell fractions, right: mean fluorescence intensity (MFI).
- Submitted by
- Invitrogen Antibodies (provider)
- Main image
- Experimental details
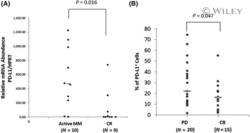
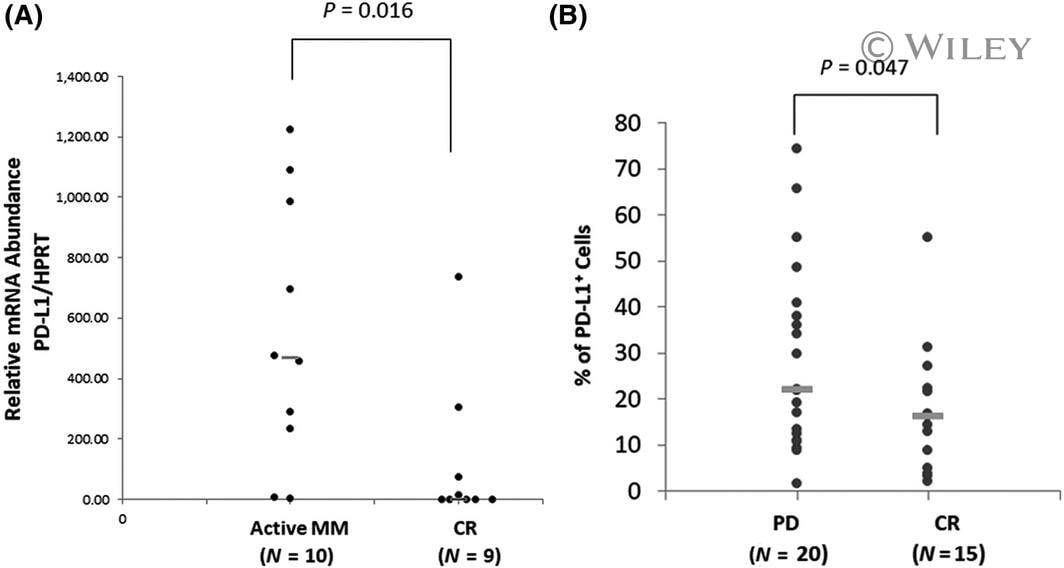
- 1 Fig Expression of programmed cell death ligand-1 (PD-L1) is higher in patients with active multiple myeloma (MM) as compared to those with complete remission (CR). ( A ) Quantified polymerase chain reaction analysis of PD-L1 gene expression and ( B ) flow cytometric analysis of PD-L1 protein expression in bone marrow mononuclear cells (BMMCs) from patients with active MM. PD, progressive disease.
- Submitted by
- Invitrogen Antibodies (provider)
- Main image
- Experimental details
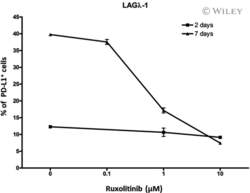
- 5 Fig Ruxolitinib (RUX) reduces programmed cell death ligand-1 (PD-L1) expression in human multiple myeloma (MM) LAGlamda-1 cells. Flow cytometric analysis of percentage of PD-L1-postive cells in human MM xenograft LAGlamda-1 tumour cells treated with increasing concentrations of RUX for 2 or 7 days. All experiments were n = 3 (technical replicates).

- Submitted by
- Invitrogen Antibodies (provider)
- Main image
- Experimental details
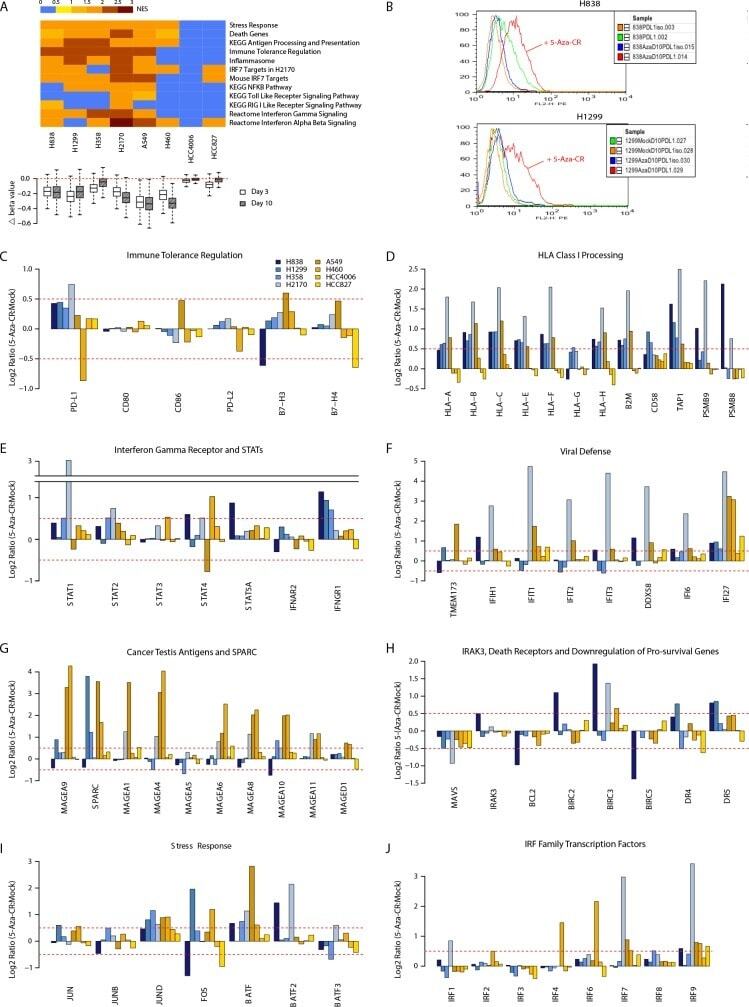
- Figure 1 Azacytidine alters gene expression in NSCLC cell lines for multiple immune related pathways (A) Top panel: Gene Set Enrichment Analysis (GSEA) for pathways up-regulated by azacytidine. Normalized enrichment scores are plotted as a heat map. Bottom panel: boxplot showing degree of demethylation in each cell line, as measured by the difference in beta values between the AZA and mock-treated cells immediately after drug withdrawal and 7 days later. (B) FACS analysis shows increased level of cell surface PD-L1 after AZA treatment by day 10 in NSCLC lines H838 and H1299. (C) to (J) AZA-mediated expression changes at day 10 in key genes from pathways outlined in (A). Y axis = Ratio of expression values (log2) of AZA -treated vs. mock-treated cells; X-axis = gene names.
- Submitted by
- Invitrogen Antibodies (provider)
- Main image

- Experimental details
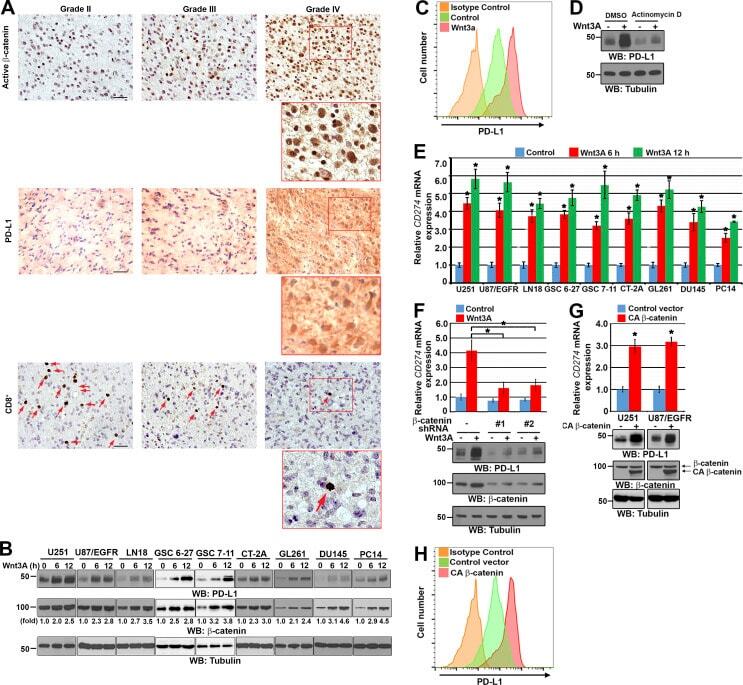
- Figure 1. Wnt-induced beta-catenin activation results in PD-L1 up-regulation in tumor cells. (B, D, F, and G) Immunoblotting analyses were performed with the indicated antibodies. (E-G) Data represent the means +- SD of three independent experiments. (A) IHC staining of 20 diffuse astrocytoma (grade II), 20 anaplastic astrocytoma (grade III), and 50 GBM (grade IV) specimens was performed with the indicated antibodies. Representative images of IHC staining from the specimens are shown. Scale bar, 50 um. Red arrows point to CD8 + cells. (B) The indicated tumor cells were serum starved for 12 h and then stimulated with Wnt3A (20 ng/ml) for the indicated periods of time. Immunoblotting analyses were performed. (C) U87/EGFR cells were treated with or without Wnt3A (20 ng/ml) for 12 h. A cell surface analysis of PD-L1 protein was performed using a flow cytometer. (D) Serum-starved U87/EGFR cells were pretreated with or without actinomycin D (1 ug/ml) for 2 h and then stimulated with or without Wnt3A (20 ng/ml) for 12 h. (E) The indicated tumor cells were serum starved for 12 h and then stimulated with or without Wnt3A (20 ng/ml) for the indicated periods of time. Real-time PCR analyses were performed. *, P < 0.0001, on the basis of Student's t test. (F) U87/EGFR cells with stable expression of beta-catenin shRNA or a control shRNA were treated with or without Wnt3A (20 ug/ml) for 12 h. A real-time PCR analysis (top panel) and immunoblotting analyses (bottom panel) were performed. b
- Submitted by
- Invitrogen Antibodies (provider)
- Main image
- Experimental details
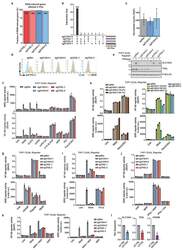
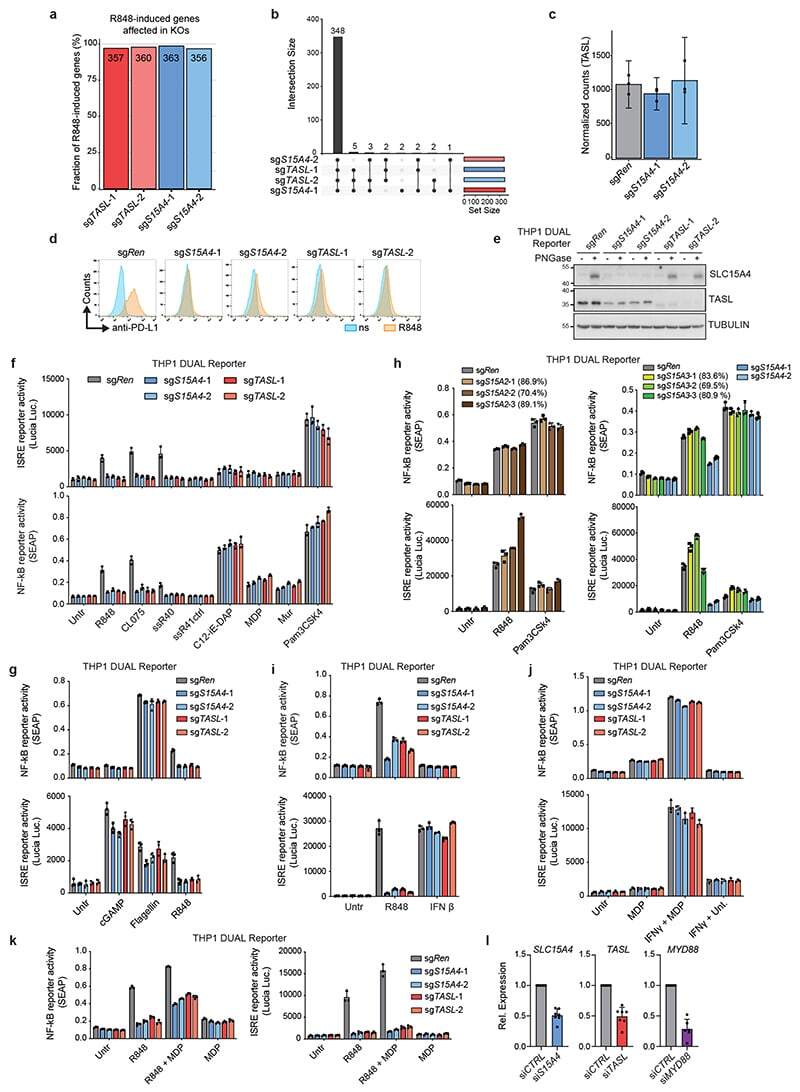
- Extended Data Figure 5 TASL mirrors SLC15A4 requirement for TLR7/8 activation. ( a ) Fraction of R848-induced genes affected by SLC15A4 and TASL knockout, related to Fig. 2b . ( b ) Upset plot representing number of R848-induced genes commonly affected by indicated sgRNAs, related to Fig. 2b . ( c ) TASL gene expression levels in indicated THP1 cells, related to Fig. 2b . Bar graphs shown mean (n=3 biological replicates), error bars show 95 % confidence interval of mean. ( d ) Flow cytometry of PD-L1 surface expression in indicated unstimulated (ns) or R848-stimulated (5 mug/ml, 24h) THP1 cells. ( e ) Immunoblots of indicated THP1 DUAL cells. Lysates treated with PNGase F as indicated. ( f-i,k ) Indicated THP1 DUAL cells were (co-)treated for 24 hours with R848 (5 mug/ml), CL075 (5 mug/ml), ssRNA40/LyoVec(tm) (5 mug/ml) or inactive control ssRNA41/LyoVec(tm) (5 mug/ml), C12-iE-DAP (5 mug/ml), MDP (10 mug/ml), murabutide (10 mug/ml), Pam3CSK4 (0.1 mug/ml), Flagellin (0.1 mug/ml), cGAMP (3 mug/ml) or interferon beta (20 ng/ml). ( h ) CRISPR/Cas9 editing efficiency (%) estimated by TIDE. ( j ) Indicated THP1 DUAL cells were primed or not with interferon gamma (0.1 mug/ml) for 24h, washed and stimulated or not with MDP (10 mug/ml, 24h). ( f-k ) Supernatants were analyzed for ISRE and NF-kappaB reporter activity. Mean +- s.d. (n=3 biological replicates). ( l ) Relative mRNA expression of SLC15A4 , TASL or MYD88 in siRNA-transfected CD14 + monocytes in comparison to control (si CTR
- Submitted by
- Invitrogen Antibodies (provider)
- Main image
- Experimental details
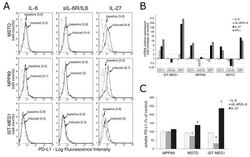
- Figure 2 IL-27 upregulates PD-L1 molecule expression and release by MM cells. ( A ) Flow cytometry analysis of membrane PD-L1 expression in MSTO, MPP89, and IST-MES1 MM cell lines cultured with medium alone (baseline), IL-6, sIL-6R/IL-6 chimera, or IL-27 (induced). Dotted line shows isotype-matched Ig control. Numbers in brackets represent Median Fluorescence Intensity (MFI) values calculated as median anti-PD-L1 mAb minus median Ig control. Data are representative of two independent experiments yielding similar results. ( B ) qRT-PCR analysis of CD274 (PD-L1) mRNA expression in the same three MM cell lines stimulated with IL-6, sIL-6R/IL-6 chimera, IL-27, or IFN-gamma relative to untreated cells. Data are calculated with the DeltaDeltaCT method and expressed as fold change versus untreated control. Error bars represent SD of triplicates. LGALS3 (Galectin 3) and GBP1 (Guanylate Binding Protein 1) mRNA levels are shown, respectively, as negative and positive controls of IL-27 activity. ( C ) Evaluation by ELISA of soluble (s)PD-L1 release in the conditioned media of the indicated MM cells treated with IL-6, sIL-6R/IL-6 chimera, or IL-27. Data are expressed as a percent of untreated control and are the mean of two independent experiments, run in duplicates. Error bars represent the minimum and maximum values (* p < 0.001, Student's t -test versus untreated control).

- Submitted by
- Invitrogen Antibodies (provider)
- Main image
- Experimental details
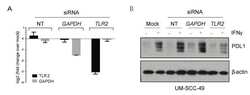
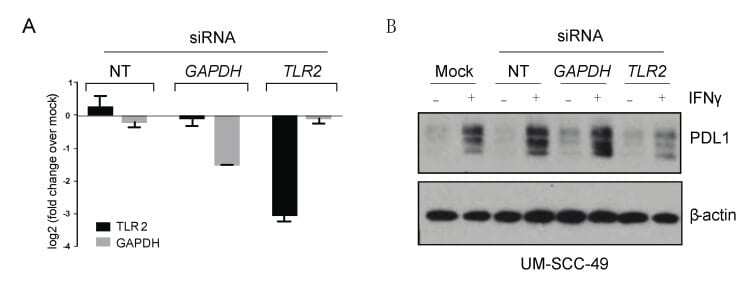
- Figure 3 TLR2 depletion attenuates IFNgamma-mediated upregulation of PDL1 in UM-SCC-49 cells. ( A ) UM-SCC-49 cells were treated with siRNA as indicated, and knockdown of TLR2 and GAPDH RNA expression was tested by qPCR. ( B ) Cells were transfected with non-targeting (NT), GAPDH, or TLR2 siRNA for 24 h were then treated -/+ 10 ng/mL IFNgamma for 48 h, and protein expression was assessed by immunoblot as indicated. The uncropped Western blots have been shown in Figure S3 .
- Submitted by
- Invitrogen Antibodies (provider)
- Main image
- Experimental details
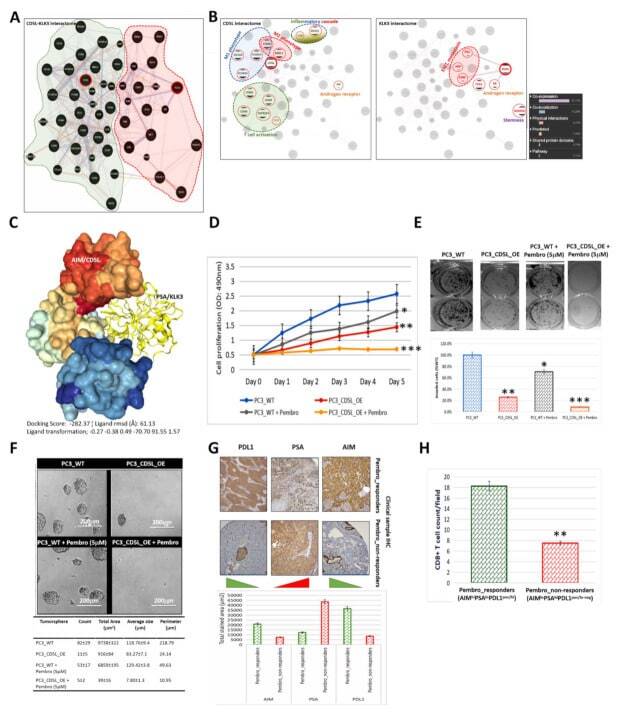
- Figure 7 AIM binds directly to PSA, and the ectopic (re)expression of AIM enhances the anticancer therapeutic effect of Pembrolizumab against PCa cells. 2D visualization of the auto-generated ( A ) CD5L-KLK3 interactome showing complicity in the immune landscape, macrophages, EMT and CSC regulation, ( B ) CD5L interactome, or KLK3 interactome. ( C ) Three-dimensional visualization of the direct complex formation by AIM/CD5L (surface model) and PSA/KLK3 (ribbon model). ( D ) Line graph showing the effect of CD5L_OE with or without 5 muM Pembrolizumab on PC3 cell proliferation. ( E ) Representative photomicrographs ( upper ) and histograms ( lower ) showing the effect of CD5L_OE with or without 5 muM Pembrolizumab on PC3 cell invasion. ( F ) Representative photomicrographs ( upper ) and quantitative chart ( lower ) showing the effect of CD5L_OE with or without 5 muM Pembrolizumab on the tumorsphere formation capability of PC3 cells. ( G ) Representative IHC photomicrographs ( upper ) and histograms ( lower ) of the immunoreactivity of AIM, PSA, and PDL1 in pembro_responders or pembro_non-responders from the TMU-SHH cohort. ( H ) Histograms showing the differential CD8 + T-cell count/field in pembro_responders or pembro_non-responders from the TMU-SHH cohort. WT, wild type; OE, overexpression; * p < 0.05; ** p < 0.01; *** p < 0.001.
- Submitted by
- Invitrogen Antibodies (provider)
- Main image
- Experimental details
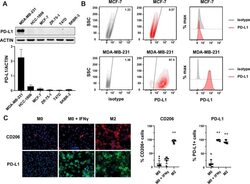
- Figure 1 Expression of PD-L1 in breast cancer cell lines and macrophages. (A) The representative western blot analysis of PD-L1 expression in triple-negative (MDA-MB-231, HCC-1806), ER-positive (MCF-7, ZR-75-1, T47D), and HER-2-positive (SKBR-3) breast cancer cell lines (upper panel). beta-actin was used as a loading control. The experiment was repeated three times. Bands were quantified by densitometry; the signal for PD-L1 band was normalized to the corresponding actin band (lower panel). (B) Representative density plots and histogram overlays illustrating PD-L1 expression (red) against a background from isotype control (gray) for MCF-7 (upper panel) and MDA-MB-231 (lower panel) breast cancer cell lines using flow cytometry. The staining was performed using an anti-PD-L1 antibody (cat. no. 12-5983-42, eBioscience, clone MIH1, dilution 1:100). Numbers on the density plots indicate the percentage of PD-L1-positive cells. The experiment was repeated at least three times. (C) PD-L1 expression in macrophage subpopulations (M0, M0+IFNgamma, M2) detected by immunocytohistochemistry assay using Cytation 1 Cell Imaging Multi-Mode Reader (BioTek, Agilent). PD-L1 positively stained cells were detected using an anti-PD-L1 antibody (clone MIH1, cat. no. 14-5983-82, eBioscience, dilution 1:100) and are marked in green; red shows CD206-positive cells (cat. no. AF2534, R&D Systems, dilution 1:100). The signal was developed using AF488-conjugated or AF647-conjugated secondary antibody, resp

- Submitted by
- Invitrogen Antibodies (provider)
- Main image

- Experimental details
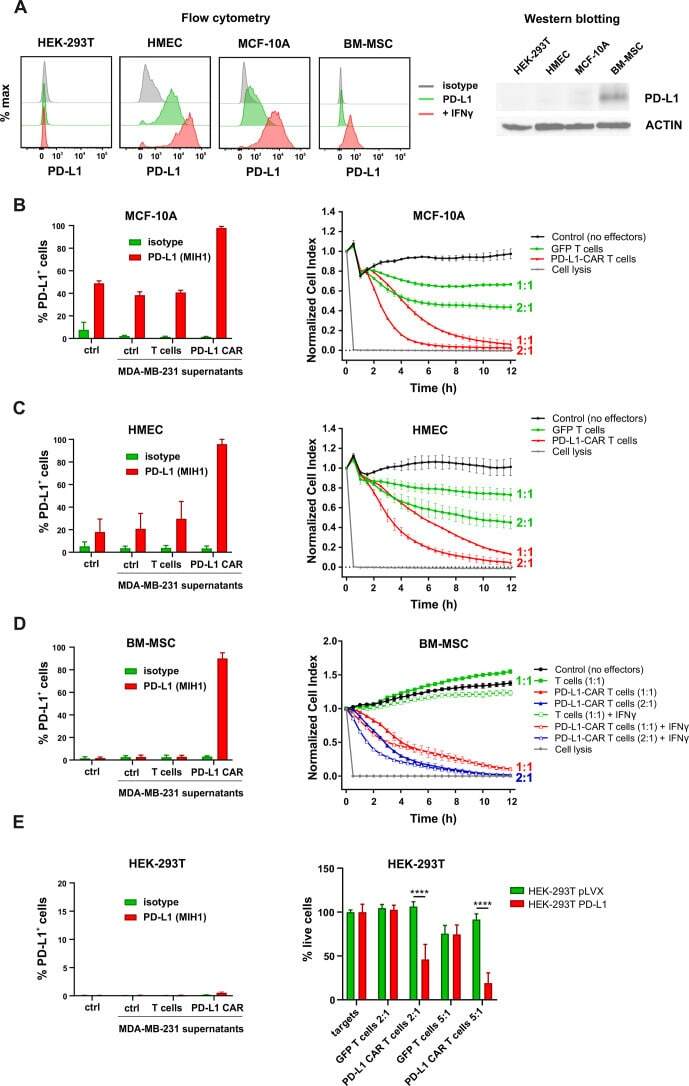
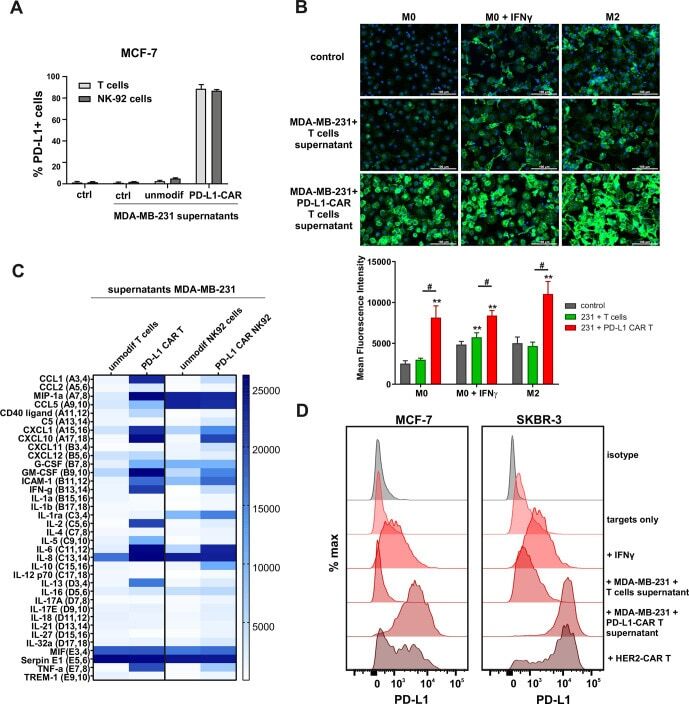
- Figure 5 Induction of PD-L1 expression on the target cells. (A) PD-L1 expression induced by supernatant from activated CAR T or CAR-NK-92 cells on cancer cells was assessed by flow cytometry. The control (only medium) and conditioned supernatants from the 24 hours coincubation cultures of control (unmodified) or PD-L1-CAR T/NK-92 cells with the target MDA-MB-231 cells were transferred onto the culture of MCF-7 and incubated for 48 hours. Next, PD-L1 surface presence was assessed using anti-PD-L1 antibody (clone MIH1) by flow cytometry. The experiment was repeated three times. (B) Representative images of different subpopulations of macrophages (M0, M0+IFNgamma, M2) stained for PD-L1 assessed by immunocytochemistry assay using Cytation 1 Cell Imaging Multi-Mode Reader (BioTek, Agilent). Macrophages were incubated with 10 ng/mL IFNgamma or IL-4 and IL-10 (for M2) for 5 days before staining (every 2-day fresh portion of cytokines was added). The control (only medium) and conditioned supernatants from the 24 hours coincubation cultures of control (unmodified) or PD-L1-CAR T cells with the target MDA-MB-231 cells were transferred onto different subpopulations of macrophages and incubated for 48 hours. Next, PD-L1 surface presence was assessed using anti-PD-L1 antibody (clone MIH1, cat. no. 14-5983-82, eBioscience, diluted 1:100). The signal was developed using AF488-conjugated secondary antibody (green), and nuclei were counterstained with DAPI (blue), scale bar: 100 um. The backg
- Submitted by
- Invitrogen Antibodies (provider)
- Main image
- Experimental details
- Figure 6 Expression of PD-L1 and PD-L1-CAR T mediated cytotoxicity in non-malignant cells. (A) IFNgamma induced expression of PD-L1 on HEK293T cell line derived from human embryonic kidney cells and non-malignant cells (HMEC, MCF-10A, and bone marrow-derived mesenchymal stem cells (BM-MSC)) assessed by flow cytometry as presented on the left panel. PD-L1 staining was performed using anti-PD-L1 antibody (clone MIH1). The representative western blot analysis of PD-L1 expression in human embryonic kidney HEK293T cells and non-malignant mammary epithelial HMEC and MCF10A cells, and BM-MSC (right panel). beta-actin was used as a loading control. The experiment was repeated three times. (B) PD-L1 expression induced on MCF-10A cells by activated CAR T cells (left panel) and RTCA-monitored cytotoxic activity of PD-L1 CAR T cells toward MCF-10A cells (right panel). The control (only medium) and conditioned supernatants from the 24 hours coincubation cultures in the presence of control (unmodified) T cells or PD-L1-CAR T cells with the target MDA-MB-231 cells were transferred onto the cultures of MCF-10A cell line and incubated for 48 hours. Next, PD-L1 surface presence was assessed by flow cytometry using anti-PD-L1 antibody (clone MIH1). Cytotoxic activity of PD-L1-CAR T cells against MCF-10A non-malignant cell line was measured by impedance analysis at the E:T ratios of 1:1 and 2:1. Samples were internally normalized for the cell index value measured before PD-L1-CAR T cells additio