Explore
 Validate
 Learn
LearnPA5-20343
antibody from Invitrogen Antibodies
Targeting: CD274
B7-H, B7-H1, B7H1, PD-L1, PDCD1LG1, PDL1
 Western blot
 Immunocytochemistry
Antibody data
- Antibody Data
- Antigen structure
- References [16]
- Comments [0]
- Validations
- Immunocytochemistry [2]
- Immunohistochemistry [6]
- Flow cytometry [2]
- Other assay [15]
Submit
Validation data
Reference
Comment
Report error
- Product number
- PA5-20343 - Provider product page

- Provider
- Invitrogen Antibodies
- Product name
- PD-L1 Polyclonal Antibody
- Antibody type
- Polyclonal
- Antigen
- Synthetic peptide
- Description
- This antibody detects human PD-L1 isoform 1 (290aa, 33.3 kDa) and isoform 3 (178aa, 20.5 kDa), as well as mouse and rat PD-L1 (290aa, 33 kDa). It will not cross-react with PD-L2. By Western blot, this antibody has been observed to detect a band at 37 kDa. Recommended positive controls: HeLa cell lysate, Daudi cell lysate, K562 cell lysate, human heart tissue/lysate. PA5-20343 can be used with blocking peptide PEP-0463. The PA5-20343 immunogen is located within amino acids 60-110 of PD-L1.
- Reactivity
- Human, Mouse, Rat
- Host
- Rabbit
- Isotype
- IgG
- Vial size
- 100 μg
- Concentration
- 1 mg/mL
- Storage
- Store at 4°C short term. For long term storage, store at -20°C, avoiding freeze/thaw cycles.
Submitted references FOXO3-dependent suppression of PD-L1 promotes anticancer immune responses via activation of natural killer cells.
Immunorthodontics: PD-L1, a Novel Immunomodulator in Cementoblasts, Is Regulated by HIF-1α under Hypoxia.
Preclinical Pharmacokinetics and Dosimetry of an (89)Zr Labelled Anti-PDL1 in an Orthotopic Lung Cancer Murine Model.
Programmed Death Ligand 1-Expressing Classical Dendritic Cells MitigateHelicobacter-Induced Gastritis.
Novel Insights into the Antagonistic Effects of Losartan against Angiotensin II/AGTR1 Signaling in Glioblastoma Cells.
Expression of immune checkpoint PD-1 in non-small cell lung cancer is associated with tumor cell DNA-dependent protein kinase.
Overcoming PD-1 Inhibitor Resistance with a Monoclonal Antibody to Secreted Frizzled-Related Protein 2 in Metastatic Osteosarcoma.
HE4 Overexpression by Ovarian Cancer Promotes a Suppressive Tumor Immune Microenvironment and Enhanced Tumor and Macrophage PD-L1 Expression.
CMTM6 drives cisplatin resistance by regulating Wnt signaling through the ENO-1/AKT/GSK3β axis.
Intratumoral immunotherapy with STING agonist, ADU-S100, induces CD8+ T-cell mediated anti-tumor immunity in an esophageal adenocarcinoma model.
Targeting ubiquitin protein ligase E3 component N-recognin 5 in cancer cells induces a CD8+ T cell mediated immune response.
Knockdown of Leptin Receptor Affects Macrophage Phenotype in the Tumor Microenvironment Inhibiting Breast Cancer Growth and Progression.
Immunotherapy via PD-L1-presenting biomaterials leads to long-term islet graft survival.
Expression of circular RNA CDR1‑AS in colon cancer cells increases cell surface PD‑L1 protein levels.
PDL1 And LDHA act as ceRNAs in triple negative breast cancer by regulating miR-34a.
Roles of programmed death protein 1/programmed death-ligand 1 in secondary brain injury after intracerebral hemorrhage in rats: selective modulation of microglia polarization to anti-inflammatory phenotype.
Chung YM, Tsai WB, Khan PP, Ma J, Berek JS, Larrick JW, Hu MC
American journal of cancer research 2022;12(3):1241-1263
American journal of cancer research 2022;12(3):1241-1263
Immunorthodontics: PD-L1, a Novel Immunomodulator in Cementoblasts, Is Regulated by HIF-1α under Hypoxia.
Yong J, Gröger S, von Bremen J, Meyle J, Ruf S
Cells 2022 Jul 30;11(15)
Cells 2022 Jul 30;11(15)
Preclinical Pharmacokinetics and Dosimetry of an (89)Zr Labelled Anti-PDL1 in an Orthotopic Lung Cancer Murine Model.
Krache A, Fontan C, Pestourie C, Bardiès M, Bouvet Y, Payoux P, Chatelut E, White-Koning M, Salabert AS
Frontiers in medicine 2021;8:741855
Frontiers in medicine 2021;8:741855
Programmed Death Ligand 1-Expressing Classical Dendritic Cells MitigateHelicobacter-Induced Gastritis.
Go DM, Lee SH, Lee SH, Woo SH, Kim K, Kim K, Park KS, Park JH, Ha SJ, Kim WH, Choi JH, Kim DY
Cellular and molecular gastroenterology and hepatology 2021;12(2):715-739
Cellular and molecular gastroenterology and hepatology 2021;12(2):715-739
Novel Insights into the Antagonistic Effects of Losartan against Angiotensin II/AGTR1 Signaling in Glioblastoma Cells.
Panza S, Malivindi R, Caruso A, Russo U, Giordano F, Győrffy B, Gelsomino L, De Amicis F, Barone I, Conforti FL, Giordano C, Bonofiglio D, Catalano S, Andò S
Cancers 2021 Sep 10;13(18)
Cancers 2021 Sep 10;13(18)
Expression of immune checkpoint PD-1 in non-small cell lung cancer is associated with tumor cell DNA-dependent protein kinase.
Saar M, Narits J, Mägi L, Aaspõllu H, Vapper A, Kase M, Minajeva A, Vooder T, Tamm H, Buldakov M, Lavõgina D, Jaal J
Molecular and clinical oncology 2021 Oct;15(4):211
Molecular and clinical oncology 2021 Oct;15(4):211
Overcoming PD-1 Inhibitor Resistance with a Monoclonal Antibody to Secreted Frizzled-Related Protein 2 in Metastatic Osteosarcoma.
Nasarre P, Garcia DI, Siegel JB, Bonilla IV, Mukherjee R, Hilliard E, Chakraborty P, Nasarre C, Yustein JT, Lang M, Jaffa AA, Mehrotra S, Klauber-DeMore N
Cancers 2021 May 30;13(11)
Cancers 2021 May 30;13(11)
HE4 Overexpression by Ovarian Cancer Promotes a Suppressive Tumor Immune Microenvironment and Enhanced Tumor and Macrophage PD-L1 Expression.
Rowswell-Turner RB, Singh RK, Urh A, Yano N, Kim KK, Khazan N, Pandita R, Sivagnanalingam U, Hovanesian V, James NE, Ribeiro JR, Kadambi S, Linehan DC, Moore RG
Journal of immunology (Baltimore, Md. : 1950) 2021 May 15;206(10):2478-2488
Journal of immunology (Baltimore, Md. : 1950) 2021 May 15;206(10):2478-2488
CMTM6 drives cisplatin resistance by regulating Wnt signaling through the ENO-1/AKT/GSK3β axis.
Mohapatra P, Shriwas O, Mohanty S, Ghosh A, Smita S, Kaushik SR, Arya R, Rath R, Das Majumdar SK, Muduly DK, Raghav SK, Nanda RK, Dash R
JCI insight 2021 Feb 22;6(4)
JCI insight 2021 Feb 22;6(4)
Intratumoral immunotherapy with STING agonist, ADU-S100, induces CD8+ T-cell mediated anti-tumor immunity in an esophageal adenocarcinoma model.
Zaidi AH, Kelly RJ, Gorbunova A, Omstead AN, Salvitti MS, Zheng P, Kosovec JE, Lee S, Ayazi S, Babar L, Finley GG, Goel A, Jobe BA
Oncotarget 2021 Feb 16;12(4):292-303
Oncotarget 2021 Feb 16;12(4):292-303
Targeting ubiquitin protein ligase E3 component N-recognin 5 in cancer cells induces a CD8+ T cell mediated immune response.
Song M, Wang C, Wang H, Zhang T, Li J, Benezra R, Chouchane L, Sun YH, Cui XG, Ma X
Oncoimmunology 2020;9(1):1746148
Oncoimmunology 2020;9(1):1746148
Knockdown of Leptin Receptor Affects Macrophage Phenotype in the Tumor Microenvironment Inhibiting Breast Cancer Growth and Progression.
Gelsomino L, Naimo GD, Malivindi R, Augimeri G, Panza S, Giordano C, Barone I, Bonofiglio D, Mauro L, Catalano S, Andò S
Cancers 2020 Jul 27;12(8)
Cancers 2020 Jul 27;12(8)
Immunotherapy via PD-L1-presenting biomaterials leads to long-term islet graft survival.
Coronel MM, Martin KE, Hunckler MD, Barber G, O'Neill EB, Medina JD, Opri E, McClain CA, Batra L, Weaver JD, Lim HS, Qiu P, Botchwey EA, Yolcu ES, Shirwan H, García AJ
Science advances 2020 Aug;6(35):eaba5573
Science advances 2020 Aug;6(35):eaba5573
Expression of circular RNA CDR1‑AS in colon cancer cells increases cell surface PD‑L1 protein levels.
Tanaka E, Miyakawa Y, Kishikawa T, Seimiya T, Iwata T, Funato K, Odawara N, Sekiba K, Yamagami M, Suzuki T, Ishibashi R, Otsuka M, Koike K
Oncology reports 2019 Oct;42(4):1459-1466
Oncology reports 2019 Oct;42(4):1459-1466
PDL1 And LDHA act as ceRNAs in triple negative breast cancer by regulating miR-34a.
Huang X, Xie X, Wang H, Xiao X, Yang L, Tian Z, Guo X, Zhang L, Tang H, Xie X
Journal of experimental & clinical cancer research : CR 2017 Sep 15;36(1):129
Journal of experimental & clinical cancer research : CR 2017 Sep 15;36(1):129
Roles of programmed death protein 1/programmed death-ligand 1 in secondary brain injury after intracerebral hemorrhage in rats: selective modulation of microglia polarization to anti-inflammatory phenotype.
Wu J, Sun L, Li H, Shen H, Zhai W, Yu Z, Chen G
Journal of neuroinflammation 2017 Feb 14;14(1):36
Journal of neuroinflammation 2017 Feb 14;14(1):36
No comments: Submit comment
Supportive validation
- Submitted by
- Invitrogen Antibodies (provider)
- Main image
- Experimental details
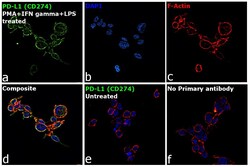
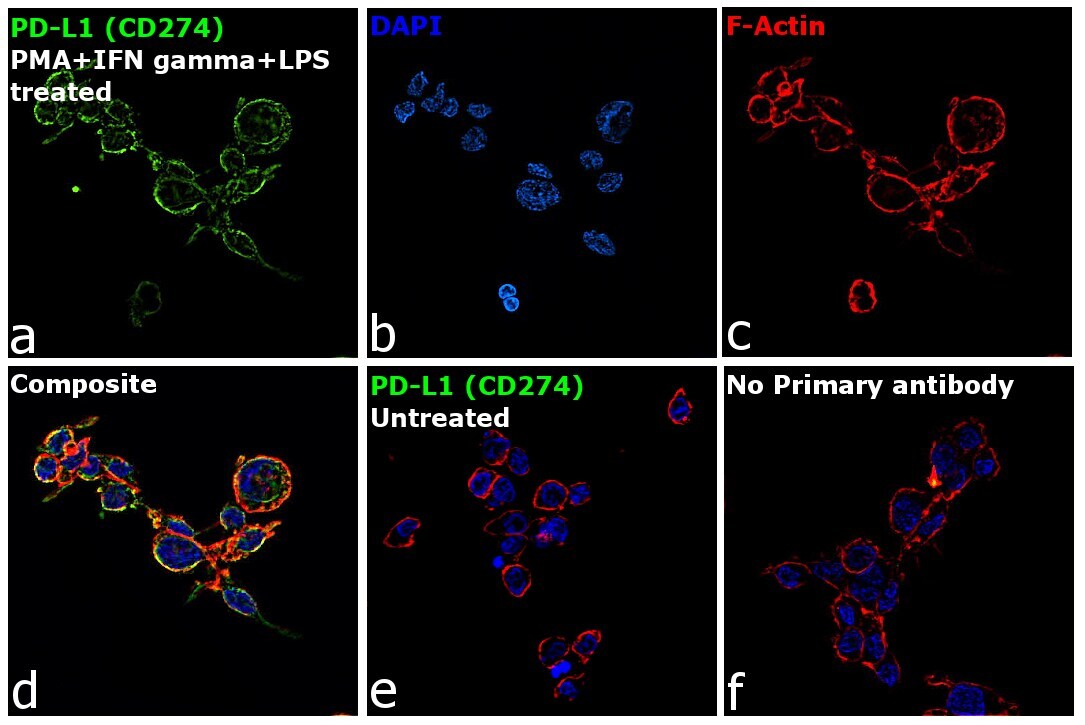
- Immunofluorescence analysis of CD274 was performed using log phase THP-1 cells treated with PMA (200 ng/mL, 6 hours), IFN gamma (20 ng/mL) and LPS (100 ng/mL), 18hours. The cells were fixed with 4% paraformaldehyde for 10 minutes, permeabilized with 0.1% Triton™ X-100 for 15 minutes, and blocked with 2% BSA for 1 hour at room temperature. The cells were labeled with PD-L1 Polyclonal Antibody (Product # PA5-20343, 1:100 dilution) in 0.1% BSA, incubated at 4 degree celsius overnight and then labeled with Donkey anti-Rabbit IgG (H+L) Highly Cross-Adsorbed Secondary Antibody, Alexa Fluor Plus 488 (Product # A32790,1:2000 dilution), for 45 minutes at room temperature (Panel a: Green). Nuclei (Panel b: Blue) were stained with ProLong™ Diamond Antifade Mountant with DAPI (Product # P36962). F-actin (Panel c: Red) was stained with Rhodamine Phalloidin (Product # R415, 1:300). Panel d represents the merged image showing plasma membrane localization. Panel e represents untreated cells with no expression of PD-L1 (CD274) Panel f represents control cells with no primary antibody to assess background. The images were captured at 60X magnification.

- Submitted by
- Invitrogen Antibodies (provider)
- Main image

- Experimental details
- Immunofluorescence analysis of CD274 was performed using log phase THP-1 cells treated with PMA (200 ng/mL, 6 hours), IFN gamma (20 ng/mL) and LPS (100 ng/mL), 18hours. The cells were fixed with 4% paraformaldehyde for 10 minutes, permeabilized with 0.1% Triton™ X-100 for 15 minutes, and blocked with 2% BSA for 1 hour at room temperature. The cells were labeled with PD-L1 Polyclonal Antibody (Product # PA5-20343, 1:100 dilution) in 0.1% BSA, incubated at 4 degree celsius overnight and then labeled with Donkey anti-Rabbit IgG (H+L) Highly Cross-Adsorbed Secondary Antibody, Alexa Fluor Plus 488 (Product # A32790,1:2000 dilution), for 45 minutes at room temperature (Panel a: Green). Nuclei (Panel b: Blue) were stained with ProLong™ Diamond Antifade Mountant with DAPI (Product # P36962). F-actin (Panel c: Red) was stained with Rhodamine Phalloidin (Product # R415, 1:300). Panel d represents the merged image showing plasma membrane localization. Panel e represents untreated cells with no expression of PD-L1 (CD274) Panel f represents control cells with no primary antibody to assess background. The images were captured at 60X magnification.
Supportive validation
- Submitted by
- Invitrogen Antibodies (provider)
- Main image

- Experimental details
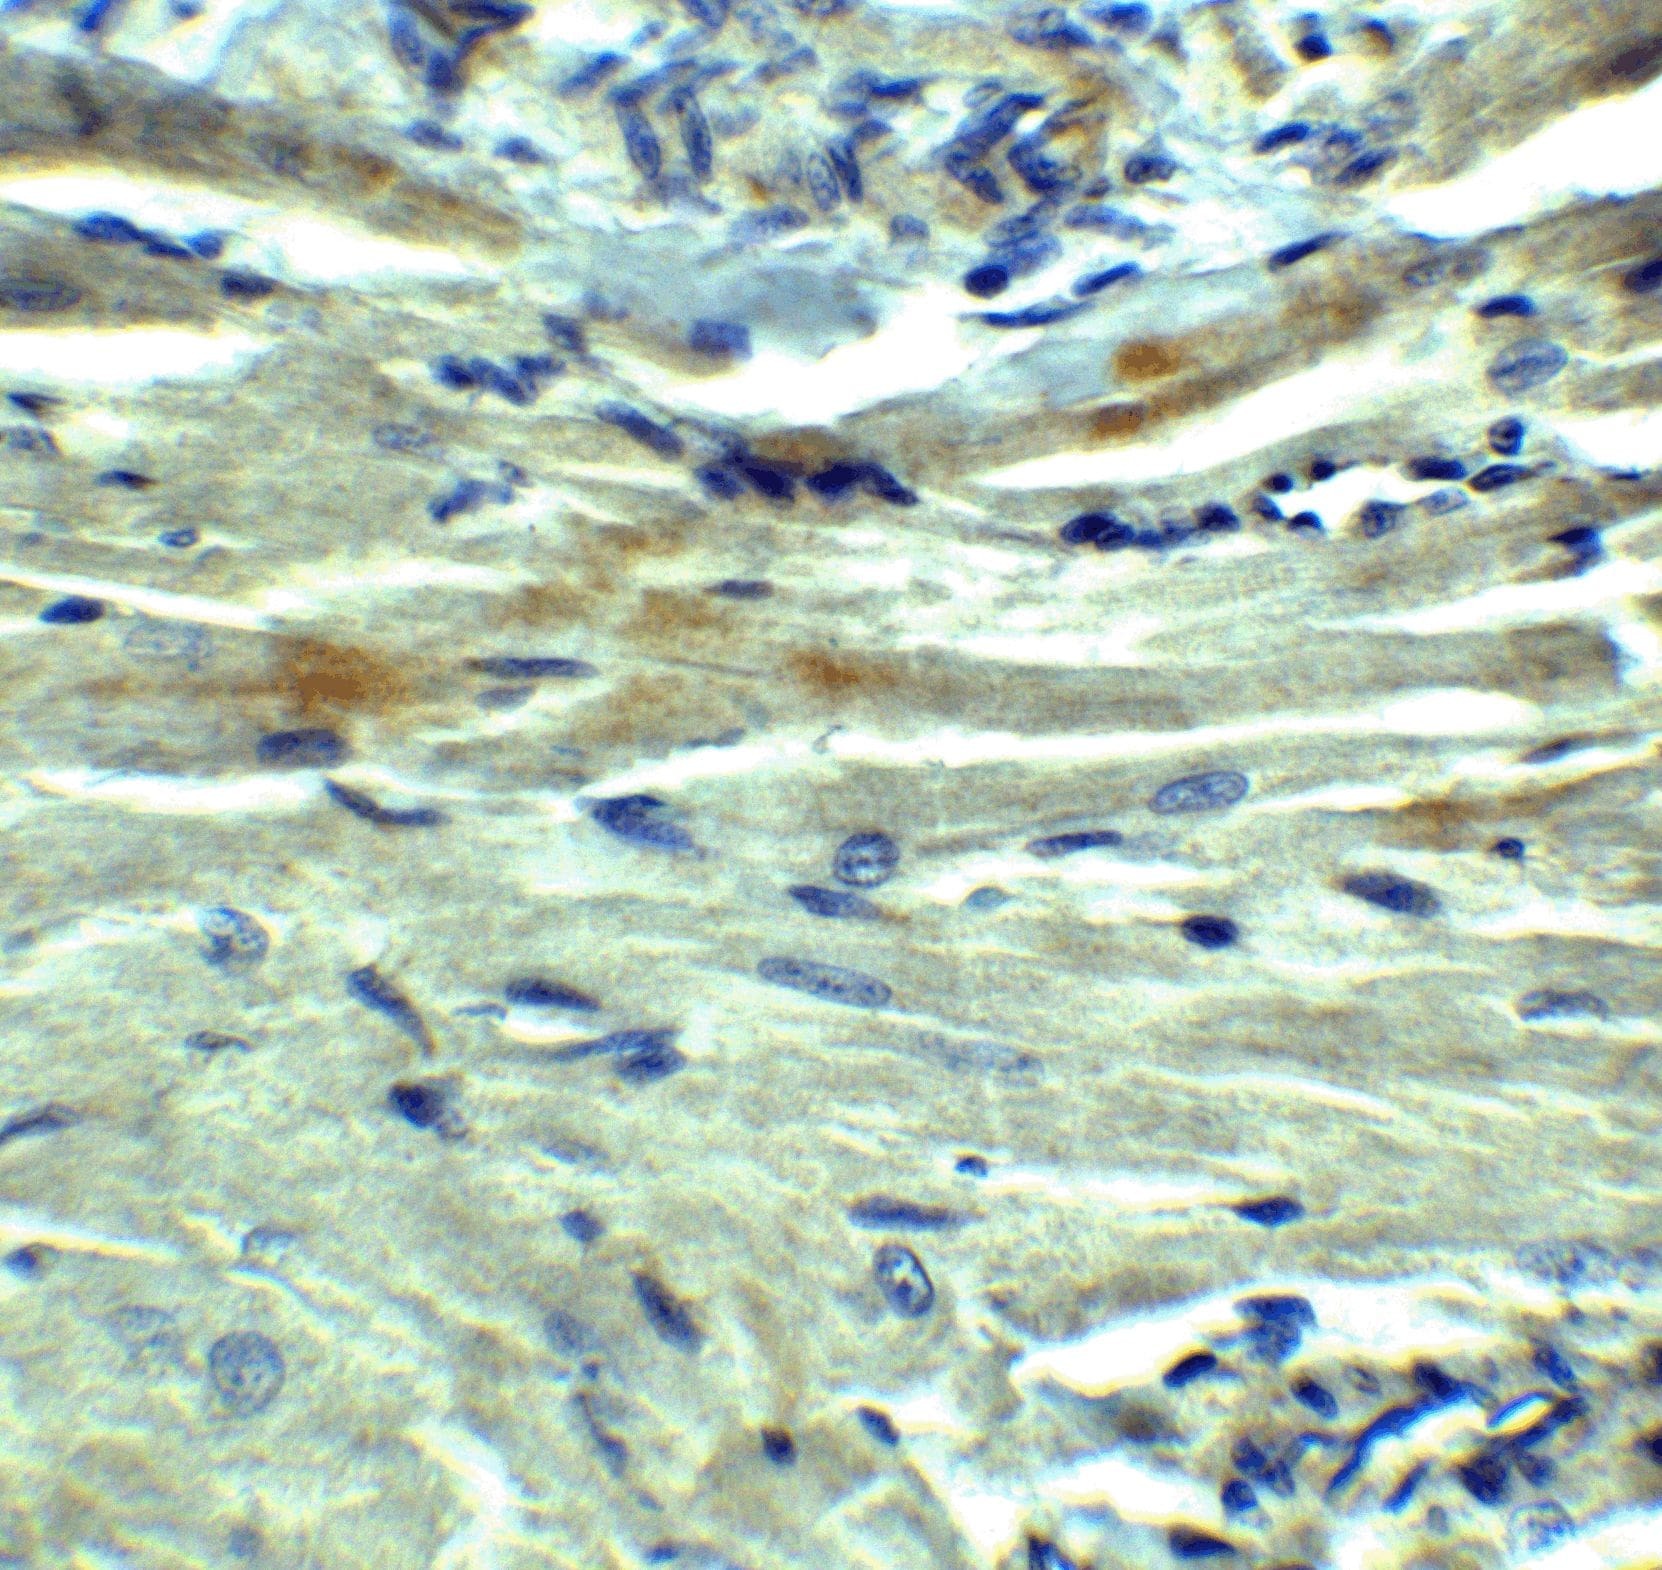
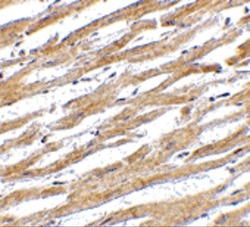
- Immunohistochemical analysis of paraffin-embedded rat heart tissue using PD-L1 Polyclonal Antibody (Product # PA5-20343) at 5 µg/mL. Tissue was fixed with formaldehyde and blocked with 0.1 serum for 1 h at RT; antigen retrieval was by heat mediation with a citrate buffer (pH6). Samples were incubated with primary antibody overnight at 4˚C. A goat anti-rabbit IgG H&L (HRP) at 1/250 was used as secondary. Counter stained with Hematoxylin.
- Submitted by
- Invitrogen Antibodies (provider)
- Main image
- Experimental details
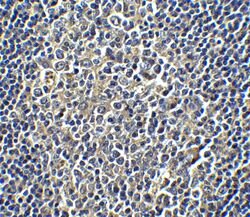
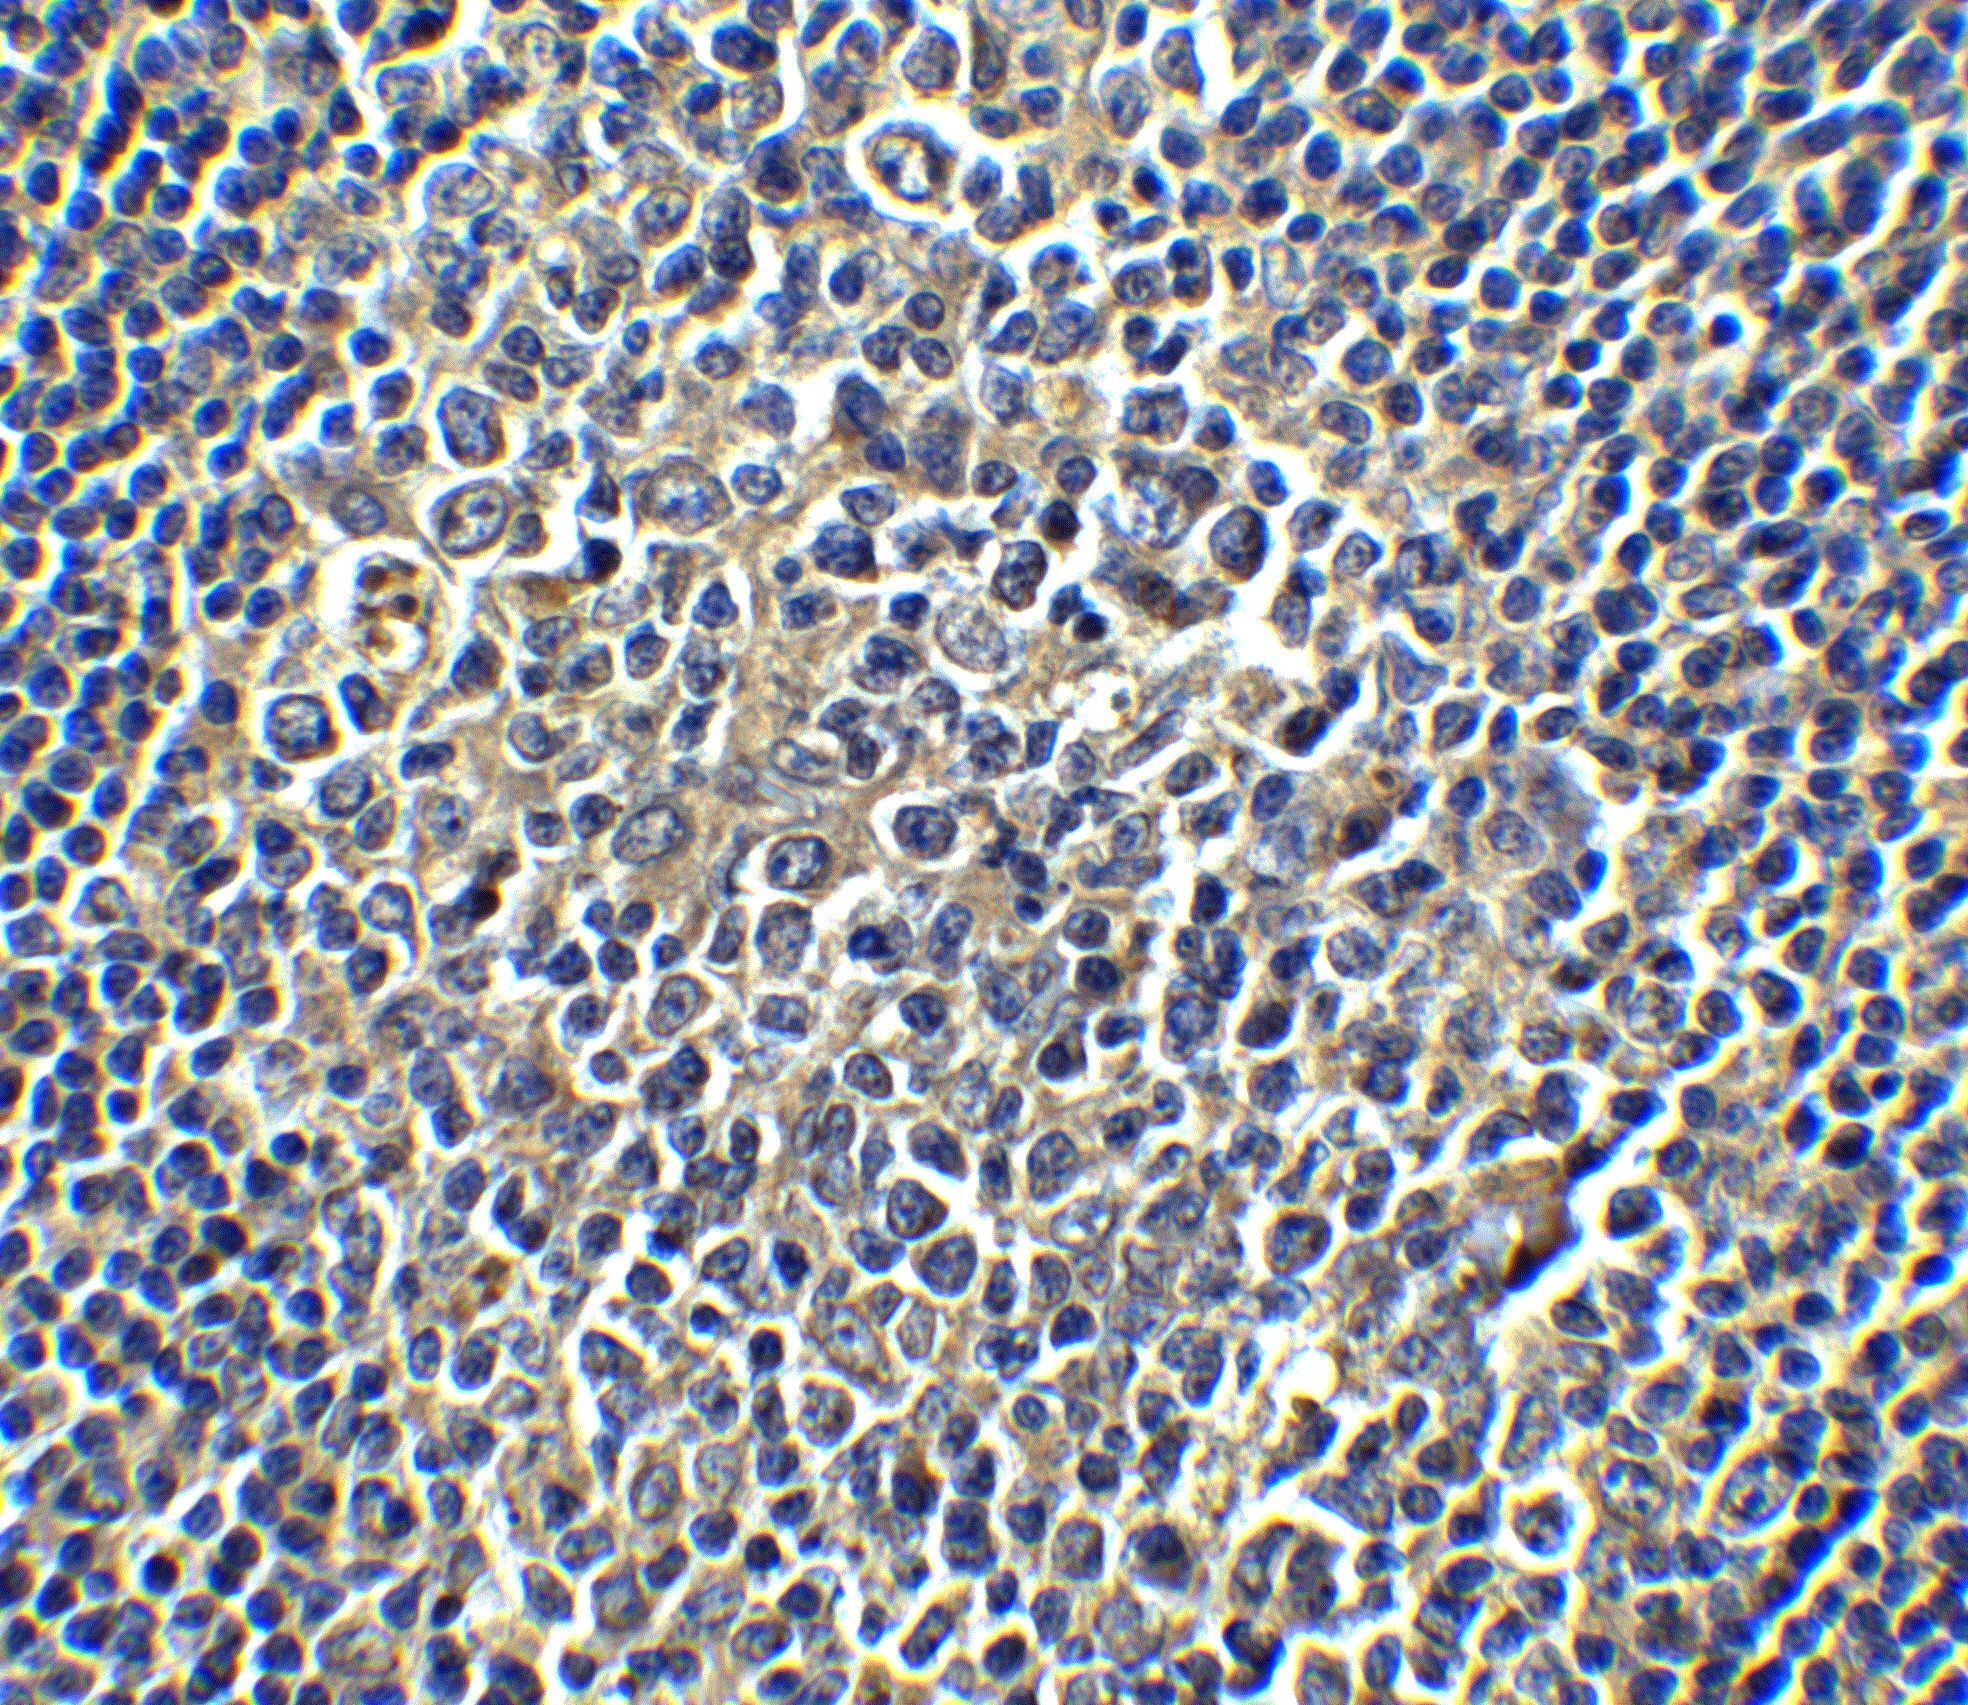
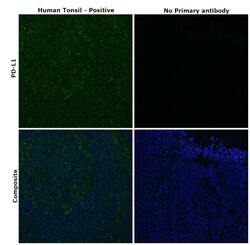
- Immunohistochemical analysis of paraffin-embedded human tonsil tissue using PD-L1 Polyclonal Antibody (Product # PA5-20343) at 5 µg/mL. Tissue was fixed with formaldehyde and blocked with 0.1 serum for 1 h at RT; antigen retrieval was by heat mediation with a citrate buffer (pH6). Samples were incubated with primary antibody overnight at 4˚C. A goat anti-rabbit IgG H&L (HRP) at 1/250 was used as secondary. Counter stained with Hematoxylin.
- Submitted by
- Invitrogen Antibodies (provider)
- Main image
- Experimental details
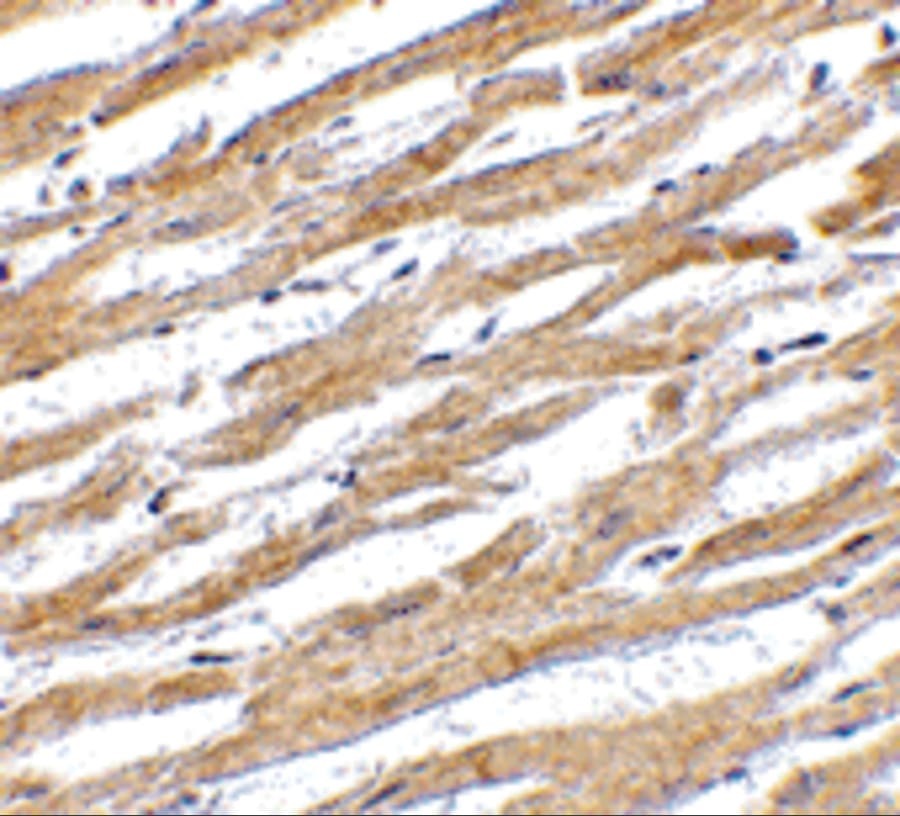
- Immunohistochemical analysis of paraffin-embedded human heart tissue using PD-L1 Polyclonal Antibody (Product # PA5-20343) at 2.5 ˚g/mL. Tissue was fixed with formaldehyde and blocked with 0.1 serum for 1 h at RT; antigen retrieval was by heat mediation with a citrate buffer (pH6). Samples were incubated with primary antibody overnight at 4˚C. A goat anti-rabbit IgG H&L (HRP) at 1/250 was used as secondary. Counter stained with Hematoxylin.
- Submitted by
- Invitrogen Antibodies (provider)
- Main image
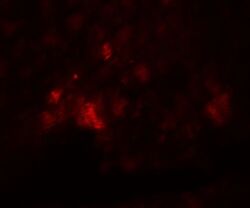
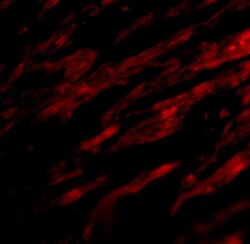
- Experimental details
- Immunofluorescence analysis of 4% paraformaldehyde-fixed rat heart tissue labeling PD-L1 with PD-L1 Polyclonal Antibody (Product # PA5-20343) at 20 µg/mL, followed by goat anti-rabbit IgG secondary antibody at 1/250 dilution (red).
- Submitted by
- Invitrogen Antibodies (provider)
- Main image
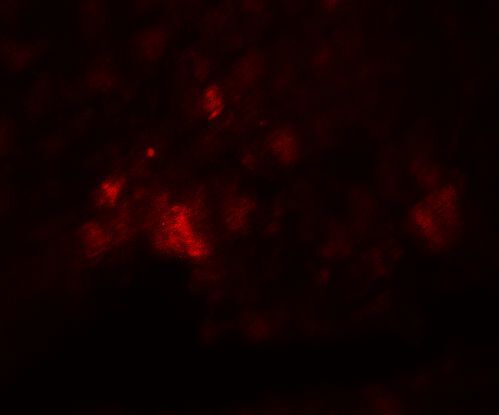
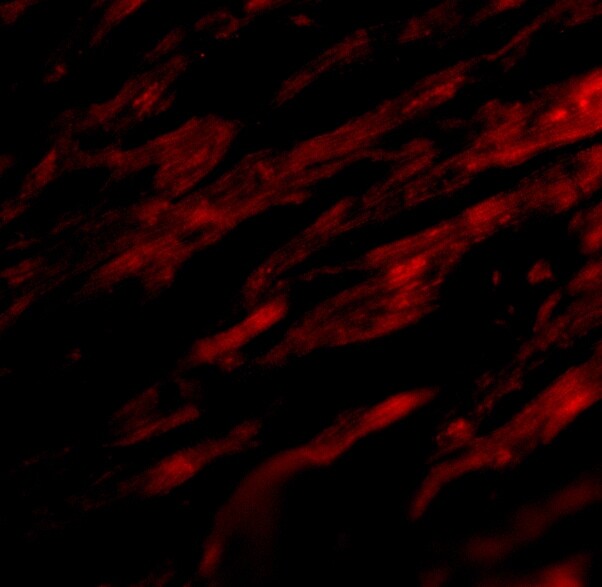
- Experimental details
- Immunofluorescent analysis of 4% paraformaldehyde-fixed human heart tissue labeling PD-L1 with PD-L1 Polyclonal Antibody (Product # PA5-20343) at 20 μg/mL, followed by goat anti-rabbit IgG secondary antibody at 1:500 dilution (red). Image showing both membrane and cytoplasmic staining on human heart tissue.
- Submitted by
- Invitrogen Antibodies (provider)
- Main image
- Experimental details
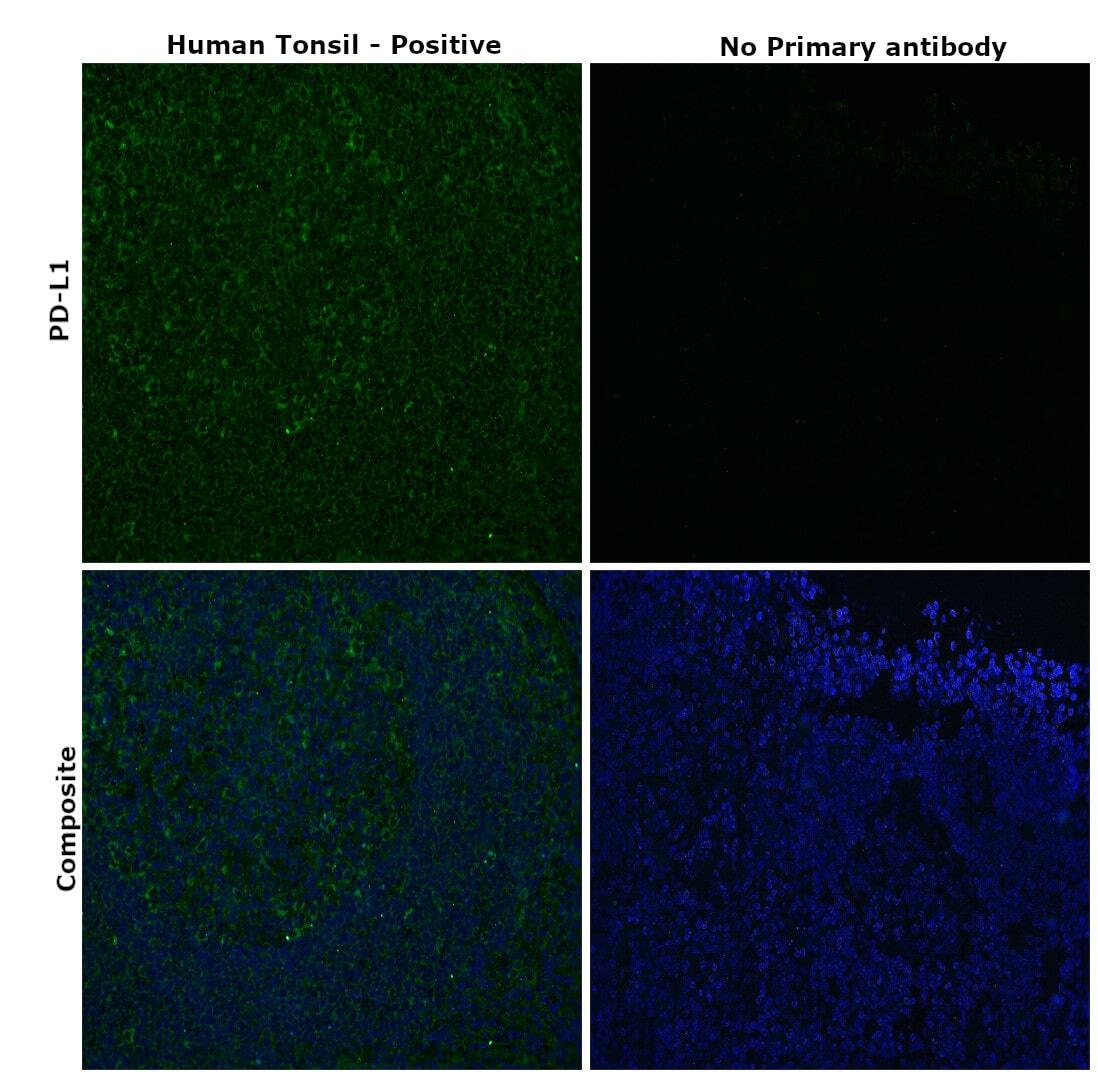
- Immunohistochemical analysis of PD-L1 was performed using formalin-fixed paraffin-embedded human tonsil tissue tissue sections. To expose the target protein, heat-induced epitope retrieval was performed on de-paraffinized sections using eBioscience™ IHC Antigen Retrieval Solution - High pH (10X) (Product # 00-4956-58) diluted to 1X solution in water in a decloaking chamber at 110 degree Celsius for 15 minutes. Following antigen retrieval, the sections were blocked with 2% normal goat serum in 1X PBS for 45 minutes at room temperature and then probed with or without PD-L1 Polyclonal Antibody (Product #PA5-20343) at 10 µg/mL concentration in 0.1% normal goat serum overnight at 4 degree Celsius in a humidified chamber. Detection was performed using Goat anti-Rabbit IgG (H+L) Highly Cross-Adsorbed Secondary Antibody, Alexa Fluor Plus 488 (Product # A32731) at a dilution of 1:2000 in 0.1% normal goat serum for 45 minutes at room temperature. ReadyProbes™ Tissue Autofluorescence Quenching Kit (Product # R37630) was used to quench autofluorescence from the tissues. Nuclei were stained with DAPI (Product # D1306) and the sections were mounted using ProLong™ Glass Antifade Mountant (Product # P36984). The images were captured on EVOS™ M7000 Imaging System (Product # AMF7000) at 20X magnification.
Supportive validation
- Submitted by
- Invitrogen Antibodies (provider)
- Main image

- Experimental details
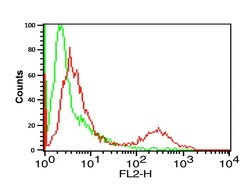
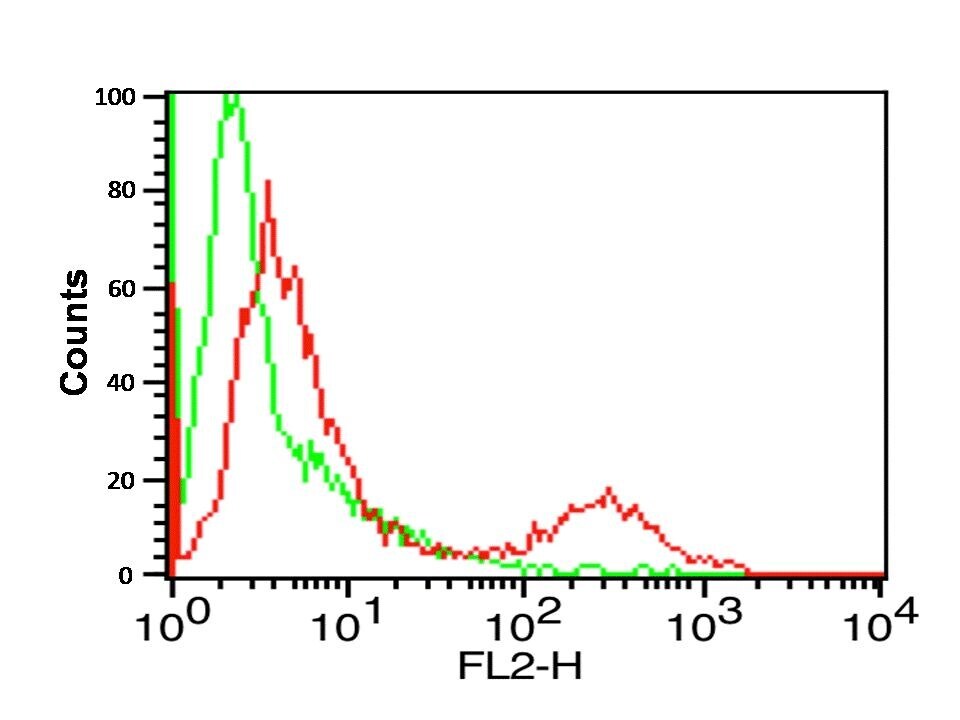
- Flow Cytometry Validation of PD-L1 Overlay histogram showing A-20 cells stained with PD-L1 Polyclonal Antibody (Product # PA5-20343) (red line, 1 µg/1 x 10^6 cells). 1 h incubation at 4°C in 2% FBS/PBS. Followed by secondary antibody 488 goat anti-rabbit IgG (H+L) at 1/500 dilution for 1 h 4°C. Isotype control antibody (Green line) was mouse IgG1 (1 µg/1 x 10^6 cells) used under the same conditions. Acquisition of >10,000 events was performed.

- Submitted by
- Invitrogen Antibodies (provider)
- Main image
- Experimental details
- Flow Cytometry Validation of PD-L1 Overlay histogram showing A-20 cells stained with PD-L1 Polyclonal Antibody (Product # PA5-20343) (red line, 1 µg/1 x 10^6 cells). 1 h incubation at 4°C in 2% FBS/PBS. Followed by secondary antibody 488 goat anti-rabbit IgG (H+L) at 1/500 dilution for 1 h 4°C. Isotype control antibody (Green line) was mouse IgG1 (1 µg/1 x 10^6 cells) used under the same conditions. Acquisition of >10,000 events was performed.
Supportive validation
- Submitted by
- Invitrogen Antibodies (provider)
- Main image
- Experimental details
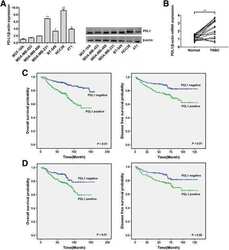
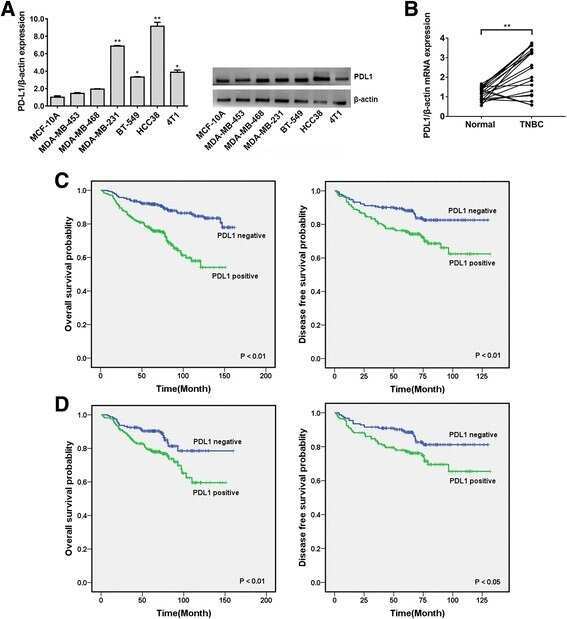
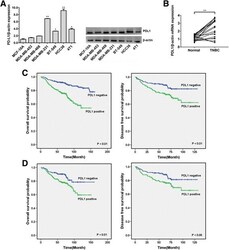
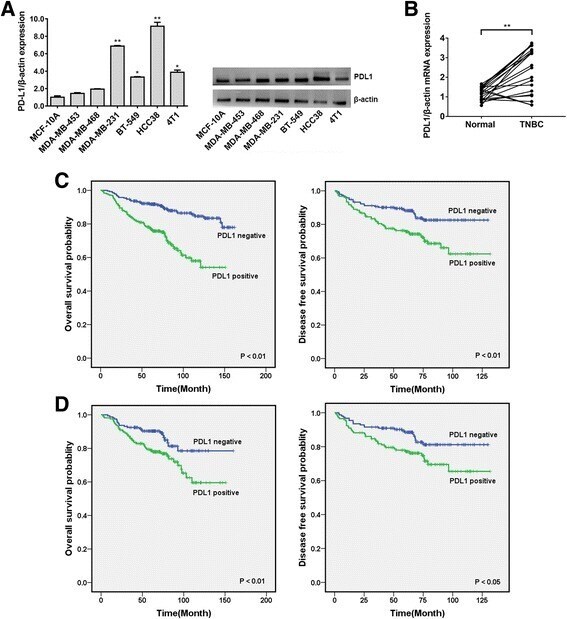
- Fig. 1 PDL1 is highly expressed in TNBC and correlated with a poor outcome. a The expression level of PDL1 was determined by qRT-PCR and Western blotting in seven different mammary cell lines, including one HME cell line (MCF-10A) and six TNBC cell lines. PDL1 expression was normalized using beta-actin expression. b The expression level of PDL1 in 20 pairs of TNBC tissues and their matched normal adjacent tissues. c OS (left) and DFS (right) curves for breast cancer patients with positive or negative PDL1 expression. d OS (left) and DFS (right) curves for TNBC patients with positive or negative PDL1 expression. All the data are shown as the mean +- s.e.m. * P < 0.05, ** P < 0.01
- Submitted by
- Invitrogen Antibodies (provider)
- Main image
- Experimental details
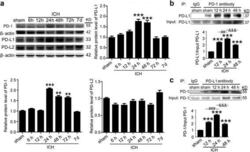
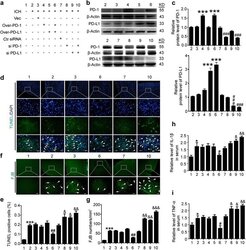
- Fig. 2 ICH increased the protein levels of PD-1/PD-Ls and the interaction between PD-1 and PD-L1. a Time course of the protein levels of PD-1, PD-L1, and PD-L2 in the brain tissue around hematoma after ICH. Representative western blot bands of PD-1, PD-L1, and PD-L2 and quantitative analysis of the relative protein level were shown. The mean value of sham group was normalized to 1.0. Data are expressed as mean +- SEM, n = 6. Double asterisks indicate p < 0.01, triple asterisks indicate p < 0.001 vs. sham group. b , c Immunoprecipitation analysis of the interaction between PD-1 and PD-L1 at indicated times after ICH. All values are means +- SEM, n = 6. triple asterisks indicate p < 0.001 vs. sham group, triple pound signs indicate p < 0.001

- Submitted by
- Invitrogen Antibodies (provider)
- Main image
- Experimental details
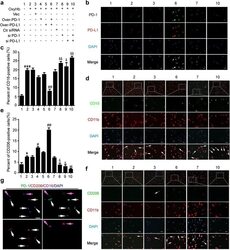
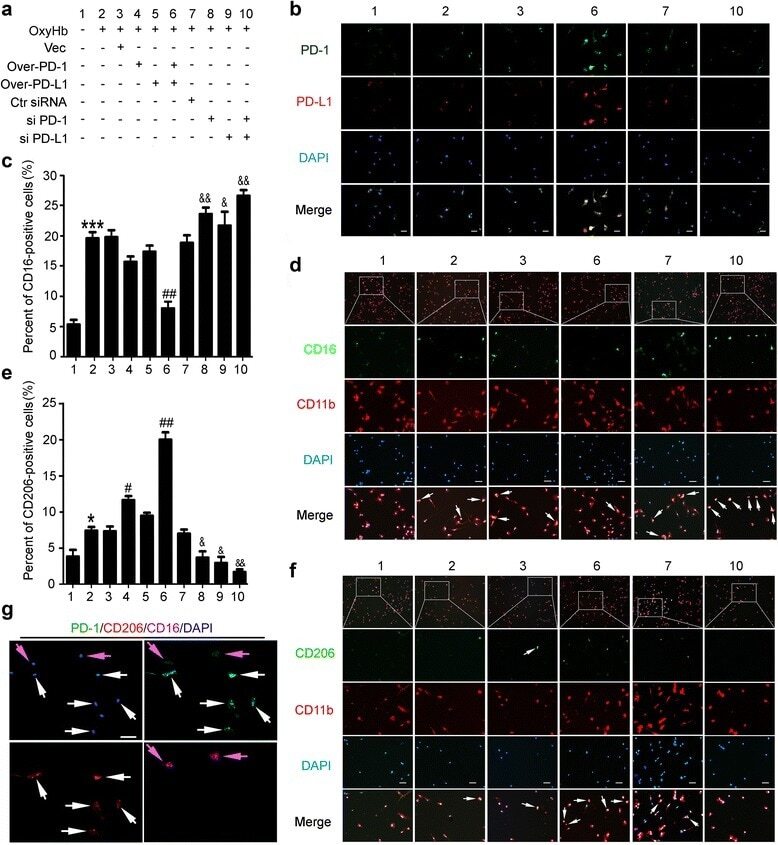
- Fig. 5 Effects of PD-1/PD-L1 overexpression and knockdown on the polarization of OxyHb-treated microglia. a Cultured microglia accepted transfection of pDNA or siRNAs as indicated. b The efficiency of pDNA and siRNA in cultured microglia was verified by immunofluorescence staining. Scale bar = 64 mum. Cultured microglia was stained for CD16/CD11b (pro-inflammatory microglia marker) or CD206/CD11b (anti-inflammatory microglia marker). Percentage of CD16-positive cells or CD206-positive cells was shown in c and e and representative images were shown in d and f . Scale bar = 64 mum. In c and e , data are expressed as mean +- SEM, n = 6. Single asterisk indicates p < 0.05, triple asterisks indicate p < 0.001 vs. sham group; single pound sign indicates p < 0.05, double pound signs indicate p < 0.01 vs. ICH + vector group; single ampersand indicates p < 0.05, double ampersands indicate p < 0.01 vs. ICH + control siRNA group. g Microglia of ICH + PD-1 overexpression + PD-L1 overexpression group was stained for PD1/CD16/CD206. White arrows point to CD206-positive cells with high fluorescence intensity of PD-1, and purple arrows point to CD16-positive cells with low fluorescence intensity of PD-1. Scale bar = 64 mum
- Submitted by
- Invitrogen Antibodies (provider)
- Main image
- Experimental details
- Fig. 3 Effects of PD-1/PD-L1 overexpression and knockdown on brain cell death and neuronal degeneration after ICH. a ICH rats accepted intracerebroventricular injection of pDNA or siRNAs as indicated. b Western blot analysis of the efficiency of PD-1 and PD-L1 overexpression or knockdown in brain of ICH rats. Quantification of relative protein levels of PD-1 and PD-L1 was shown in c. c Data are expressed as mean +- SEM, n = 6. Triple asterisks indicate p < 0.001 vs. ICH + vector group; triple pound signs indicate p < 0.001 vs. ICH + control siRNA group. d Terminal deoxynucleotidyl transferase dUTP nick end labeling (TUNEL) staining. Sections were labeled by TUNEL ( green ) to detect apoptotic brain cells and counterstained with DAPI ( blue ) to detect nuclei. Arrows point to TUNEL-positive cells. Scale bar = 64 mum. e Percentage of TUNEL-positive cells. Data are expressed as mean +- SEM, n = 6. Triple asterisks indicate p < 0.001 vs. sham group; double pound signs indicate p < 0.01 vs. ICH + vector group; ampersand indicates p < 0.05, double ampersands indicate p < 0.01 vs. ICH + control siRNA group. f Fluoro-jade B (FJB) staining. Arrows point to FJB-positive cells. Scale bar = 64 mum. The number of FJB-positive brain cells was calculated. g Data are expressed as mean +- SEM, n = 6. Triple asterisks indicate p < 0.001 vs. sham group; double pound signs indicate p < 0.01 vs. ICH + vector group; double ampersands indicate p < 0.01, triple ampersands indicate p < 0.001 vs. ICH

- Submitted by
- Invitrogen Antibodies (provider)
- Main image
- Experimental details
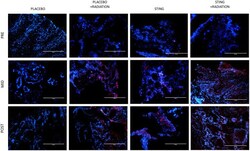
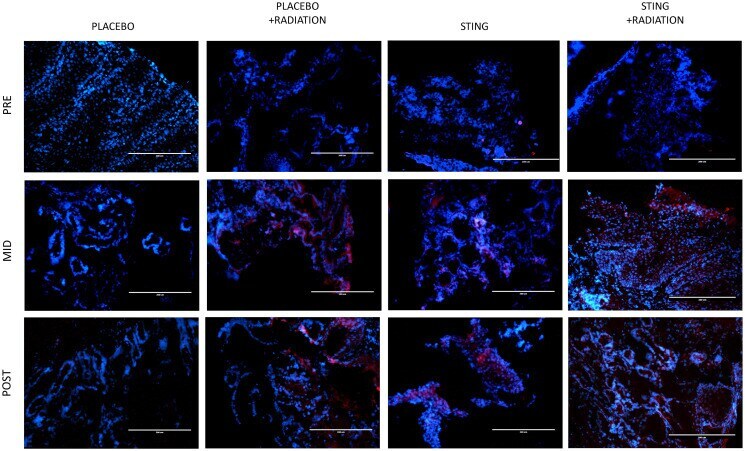
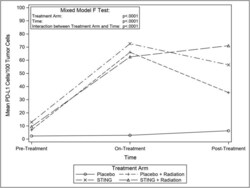
- Figure 5 PD-L1 immunofluorescence, by treatment group. Representative study subgroup tumor samples showing membranous PD-L1 immunofluorescence pre-, on- and post-intratumoral injections with placebo or ADU-S100, +/- 16Gy radiation. Positive PD-L1 staining was detected at 20x magnification in the primary tumor with the Alexa Fluor 594 secondary antibody, conjugated to a red fluorophore.
- Submitted by
- Invitrogen Antibodies (provider)
- Main image
- Experimental details
- Figure 6 Mean CD8 cells/100 tumor cells, by treatment group. Line graphs depicting changes in mean number of PD-L1 stained cells per 100 tumor cells by study groups pre- on- and post-intervention.

- Submitted by
- Invitrogen Antibodies (provider)
- Main image
- Experimental details
- Fig. 1 PDL1 is highly expressed in TNBC and correlated with a poor outcome. a The expression level of PDL1 was determined by qRT-PCR and Western blotting in seven different mammary cell lines, including one HME cell line (MCF-10A) and six TNBC cell lines. PDL1 expression was normalized using beta-actin expression. b The expression level of PDL1 in 20 pairs of TNBC tissues and their matched normal adjacent tissues. c OS (left) and DFS (right) curves for breast cancer patients with positive or negative PDL1 expression. d OS (left) and DFS (right) curves for TNBC patients with positive or negative PDL1 expression. All the data are shown as the mean +- s.e.m. * P < 0.05, ** P < 0.01
- Submitted by
- Invitrogen Antibodies (provider)
- Main image
- Experimental details
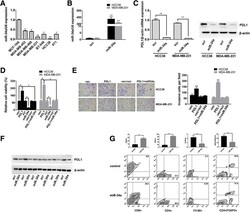
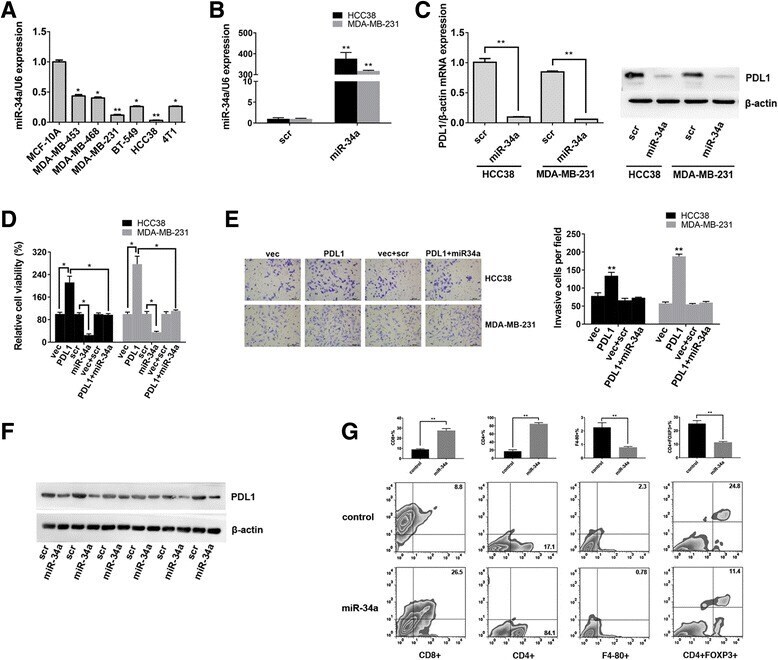
- Fig. 2 PDL1 is a target of miR-34a, and its functions could be inhibited by miR-34a. a The expression level of miR-34a was determined by qRT-PCR in the above cell lines. U6 snRNA was used as an internal control. b HCC38 and MDA-MB-231 cells were transfected with miR-34a mimic or scrambled oligonucleotide, and qRT-PCR analysis demonstrated that the transfection was successful. c HCC38 and MDA-MB-231 cells were transfected as described, and the mRNA and protein expression of PDL1 was suppressed by miR-34a. d Histogram presenting cell viability based on MTS assays for HCC38 and MDA-MB-231 cells 48 h after transfection. e Transwell invasion assays demonstrated that the PDL1 3'UTR promoted cell invasion. Representative images of invaded cells are shown in the left panel, and the results are summarized in the right panel. f The expression levels of PDL1 were determined by Western blotting in xenograft tumors (six in each group). beta-Actin was used as an internal control. g The impact of miR-34a on immune cell populations in the tumor microenvironment. Flow cytometry revealed that miR-34a increased the number of CD8+ cells and CD4+ cells and reduced the number of macrophages and Tregs. All the data are shown as the mean +- s.e.m. * P < 0.05, ** P < 0.01
- Submitted by
- Invitrogen Antibodies (provider)
- Main image
- Experimental details
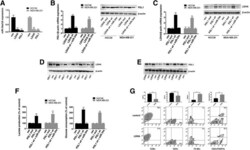
- Fig. 5 PDL1 and LDHA act as ceRNAs in TNBC by regulating miR-34a. a The expression level of miR-34a was determined by qRT-PCR in stable cell lines expressing the PDL1 3'UTR or LDHA 3'UTR. U6 snRNA was used as an internal control. b The expression level of PDL1 was determined by qRT-PCR and Western blotting. beta-Actin was used as an internal control. c The expression level of LDHA was determined by qRT-PCR and Western blotting. beta-Actin was used as an internal control. d The expression level of LDHA was determined by Western blotting in xenograft tumors (six in each group). beta-Actin was used as an internal control. e The expression level of PDL1 was determined by Western blotting in xenograft tumors (six in each group). beta-Actin was used as an internal control. f Lactate production and glucose consumption was evaluated by measuring the lactate and glucose levels in cell medium. g The impact of the LDHA 3'UTR on immune cell populations in the tumor microenvironment. Flow cytometry revealed that the LDHA 3'UTR increased the number of macrophages and Tregs and reduced the number of CD8+ cells and CD4+ cells. All of the data are shown as the mean +- s.e.m. ** P < 0.01

- Submitted by
- Invitrogen Antibodies (provider)
- Main image

- Experimental details
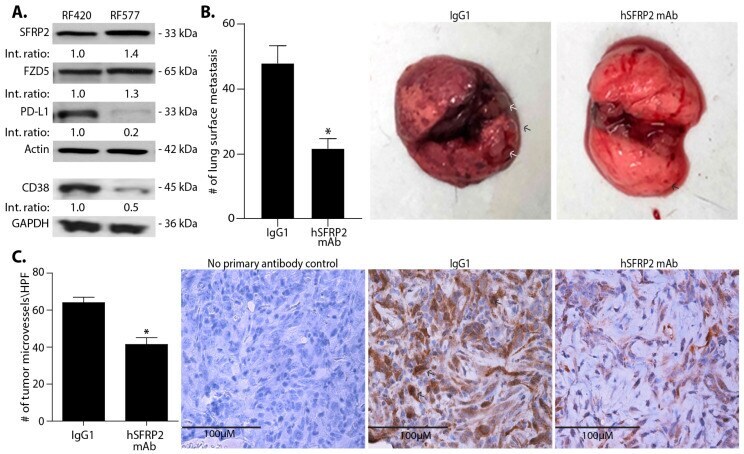
- Figure 1 hSFRP2 mAb reduces metastatic osteosarcoma growth in vivo. ( A ) Characterization of two osteosarcoma cell lines: RF420 (left) and RF577 (right) by Western blot analysis probing for SFRP2, FZD5, CD38 and PD-L1 levels. Loading control: actin and GAPDH. Western blot shows SFRP2, FZD5, PD-L1 and CD38 proteins detected in both cell lines. PD-L1 and CD38 proteins were detected in RF420 with lower levels than in RF577. Int. ratio: intensity ratios listed below SFRP2, FZD5, PD-L1, and CD38 Western blots were calculated in RF577 cells after normalization to both the loading control (actin or GAPDH) and reference sample in RF420 cells (indicated by 1.00). ( B ) In vivo monotherapy with hSFRP2 mAb in RF420 OS lung metastasis model. Osteosarcoma RF420 cells were injected iv via the tail vein in C57BL/6 mice. Treatments with IgG1 control (4 mg/kg weekly) or hSFRP2 mAb (4 mg/kg every 3 days) started 8 days after tumor cell injection. After 21 days of treatment, animals were euthanized, lungs were resected and surface nodules were quantified. Left: quantification of lung metastases in IgG1-treated control mice ( n = 19) versus hSFRP2 mAb treated mice ( n = 22) (* p < 0.001). Middle: representative lungs from a mouse treated with IgG1 control with multiple OS tumor metastases (arrows). Right: representative lungs from a mouse treated with hSFRP2 mAb with minimal OS metastases ( C ) Angiogenesis of metastases analyzed on paraffin-embedded lungs that underwent immunohistochemistry wi
- Submitted by
- Invitrogen Antibodies (provider)
- Main image
- Experimental details
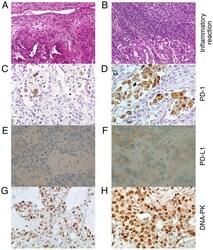
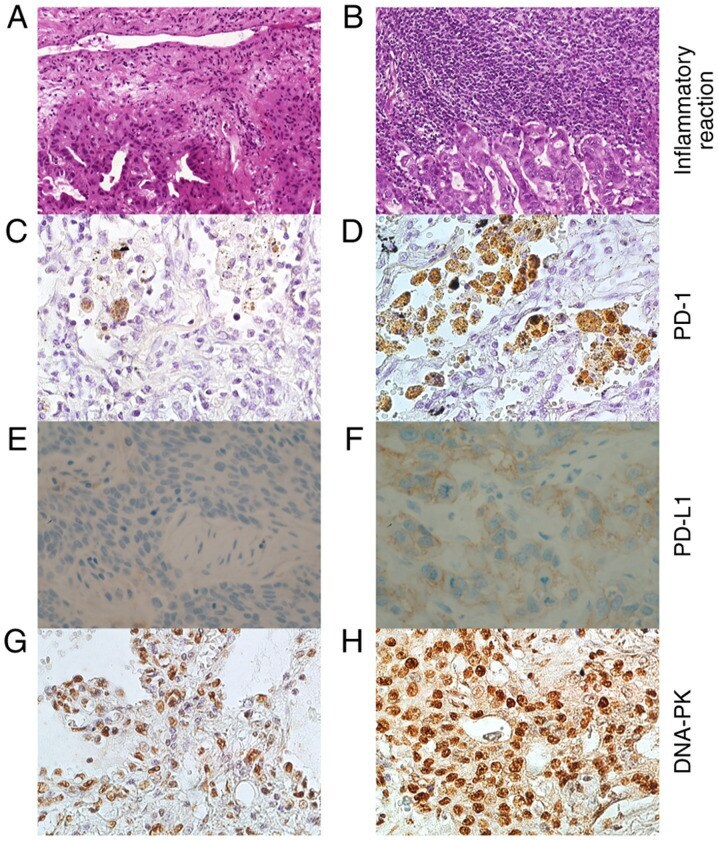
- Figure 1 Representative inflammation and immunohistochemical expression of PD-1, PD-L1 and DNA-PK in NSCLC tissues. Representative images of NSCLC tissues with (A) trivial and (B) strong inflammatory reactions in tumor adjacent stroma (hematoxylin and eosin staining; magnification, x200). Immunohistochemical stains of NSCLC tissues with (C) scant PD-1 positive macrophages and (D) numerous PD-1 positive macrophages infiltrating the tumor (magnification, x400). Representative NSCLC sections with (E) scattered weak positively stained tumor cell nuclei for DNA-PK and (F) with diffuse and strong staining of cell nuclei for DNA-PK (magnification, x400). NSCLC samples with (G) negative and (H) positive PD-L1 expression (magnification, x400). PD-1, programmed cell death protein 1; PD-L1, programmed cell death ligand 1; DNA-PK, DNA-dependent protein kinase; NSCLC, non-small cell lung cancer.
- Submitted by
- Invitrogen Antibodies (provider)
- Main image
- Experimental details
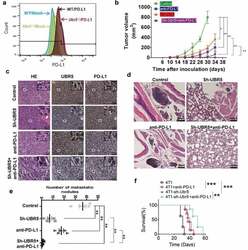
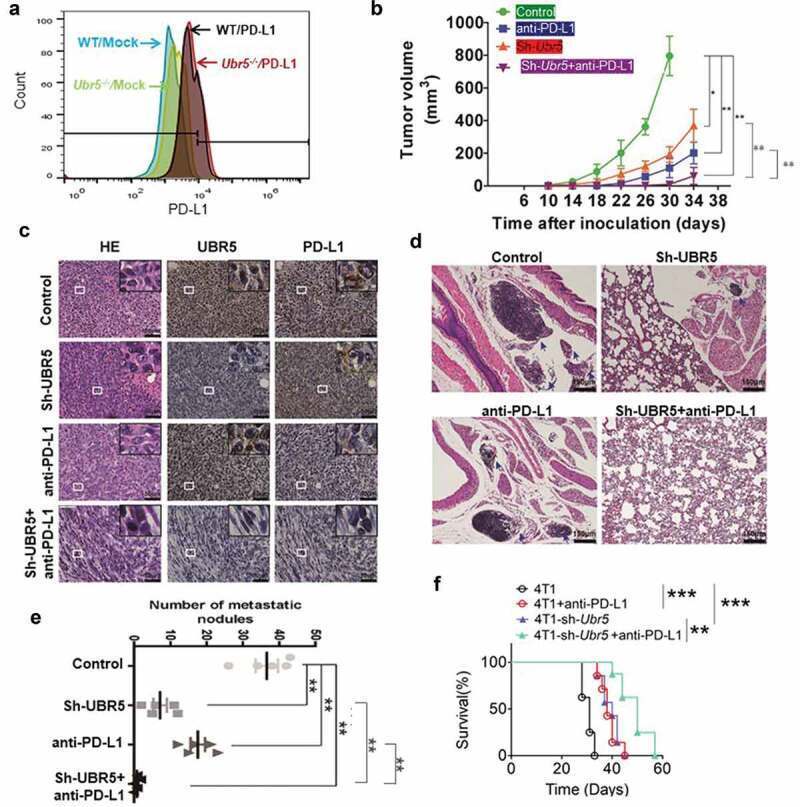
- 10.1080/2162402X.2020.1746148-F0006 Figure 6. Combinational therapy targeting UBR5 and PD-L1. (a) FACS analysis of surface expression of PD-L1 on WT and Ubr5 -/- 4T1 cells. (b) Combination therapy targeting UBR5 (via shRNA) and PD-L1 (via antibody) in 4T1 tumors showing tumor growth. PD-L1 antibody (Bioxcell, clone 10 F.9G2) or isotype IgG (Rat IgG2b, kappa) was injected intraperitoneally at 200 mug per mouse weekly since d 7 after tumor inoculation for 3 times in total. (c) Representative H&E staining and IHC staining of UBR5 and PD-L1 in WT 4T1 tumor tissues of indicated groups (scale bar = 50 mum). (de) Metastasis of the four treated groups illustrated by H&E staining of tumor tissues (d) and by quantifying metastatic nodules in the lungs (e). (f) Survival rate of mice with WT or Ubr5 -deficient tumors treated with anti-PD-L1. Three different replicates were performed for all experiments. Data represent mean +- SEM; * P < .05; ** P < .01.
- Submitted by
- Invitrogen Antibodies (provider)
- Main image
- Experimental details
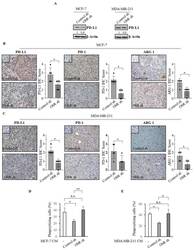
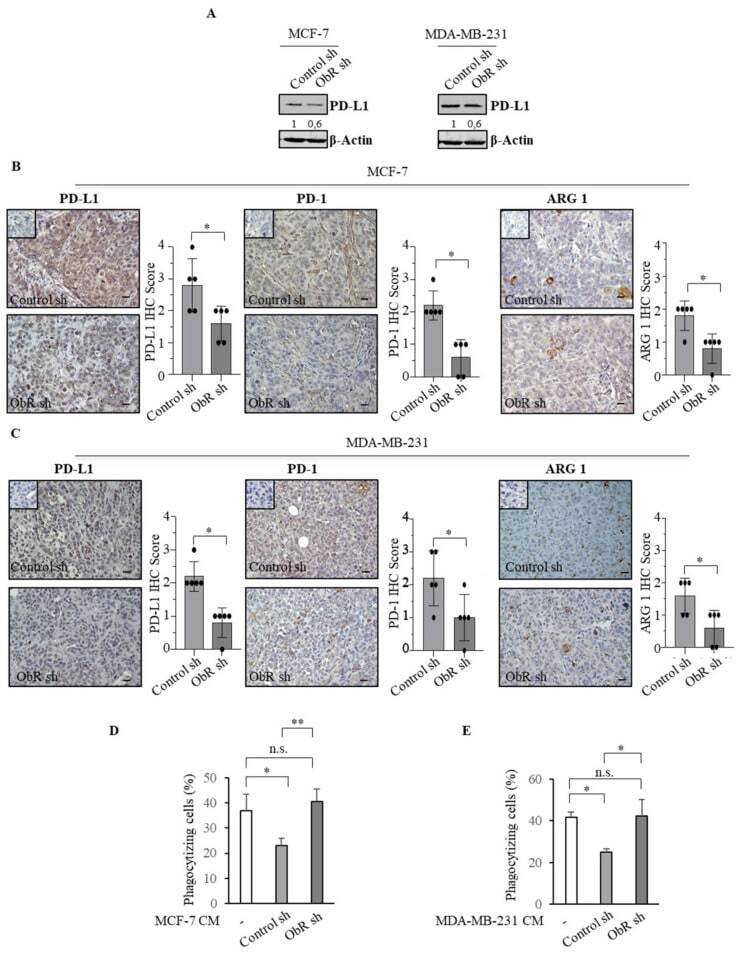
- Figure 7 Effects of the lack of ObR on the tumor immune microenvironment. ( A ) Immunoblotting showing programmed death ligand 1 (PD-L1) protein expression in Control sh and ObR sh MCF-7 and MDA-MB-231 breast cancer cells. beta-Actin was used as a control for equal loading and transfer. Italicized numbers below blots represent the mean of the band optical density expressed as fold over Control sh ObR cells. PD-L1, programmed cell death protein (PD-1) and arginase (ARG 1) immunohistochemical staining and relative score of Control sh and ObR sh MCF-7 ( B ) and MDA-MB-231 ( C ) xenograft tumor sections. Inset, negative control. Scale bar = 25 mum. THP-1 cells were stimulated with phorbol 12-myristate 13-acetate (PMA, 100 nM) for 14 h followed by 24 h rest to obtain THP-1 macrophage-like cells (M0). Phagocytic activity of M0 treated with 5% charcoal stripped media (-) or incubated with conditioned media (CM) derived from control sh and ObR sh MCF-7 breast cancer cells for 5 days ( D ) and MDA-MB-231 for 3 days ( E ). Cells were incubated with latex beads conjugated with FITC-IgG for 2 h. Pixel intensity of FITC labeled beads was normalized to number of cells and results are expressed as percentage. The values represent the mean +- SD of three different experiments, each performed in triplicate. n.s., nonsignificant; * p < 0.05; ** p < 0.005.
- Submitted by
- Invitrogen Antibodies (provider)
- Main image

- Experimental details
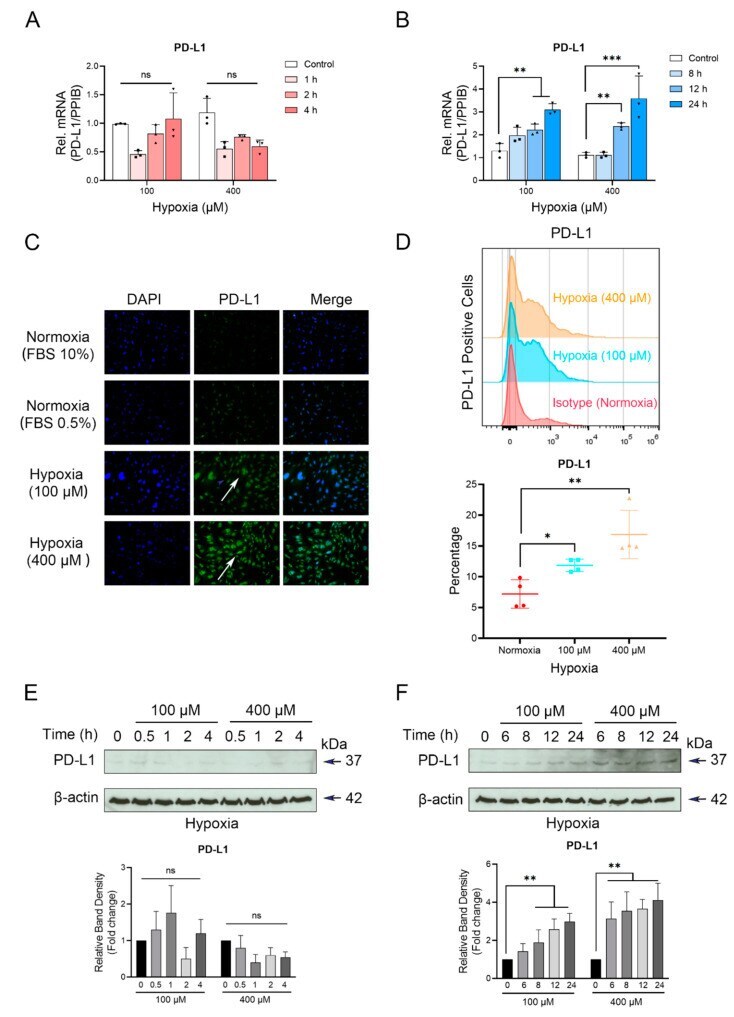
- CoCl 2 -mimicked hypoxia selectively up-regulates PD-L1 expression on OCCM-30 cells. OCCM-30 cells were cultured under CoCl 2 -induced hypoxia (100 muM or 420 muM) for the indicated time periods. ( A , B ) qPCR analysis was performed to examine gene expression of PD-L1 under hypoxia (100 muM or 400 muM). The relative mRNA expression of PD-L1 was obtained through normalizing to internal PPIB. The statistical significance was determined by student t -test ( n = 3 for each group). Each dot and triangle symbol represent a relative PD-L1 expression value. (c) The PD-L1 fluorescent pictures by Leica fluorescent microscopy showed the expression of the immune check point expression of PD-L1 (green) in hypoxia-treated OCCM-30 cells after 24 h. White arrow pointed the PD-L1 were increased after the hypoxic incubation. Nuclei are stained with DAPI (blue). Individual and merged images of HIF-1alpha and DAPI are shown. ( D ) Representative plots performed in triplicate showed the expression level of PD-L1 on OCCM-30 that analyzed by flow cytometry. The graphic shows the values of PD-L1 positive cells normalized to total cells. Data are expressed as percentage and each square symbol depicts the level of PD-L1 positive cells. ( E , F ) Western blotting showed protein expression of PD-L1 in OCCM-30 cells induced by hypoxic environment (100 and 400 muM) for various periods. Internal beta-actin levels serve as loading control. Densitometric quantification ratio of WB indicated the enhanced PD-
- Submitted by
- Invitrogen Antibodies (provider)
- Main image

- Experimental details
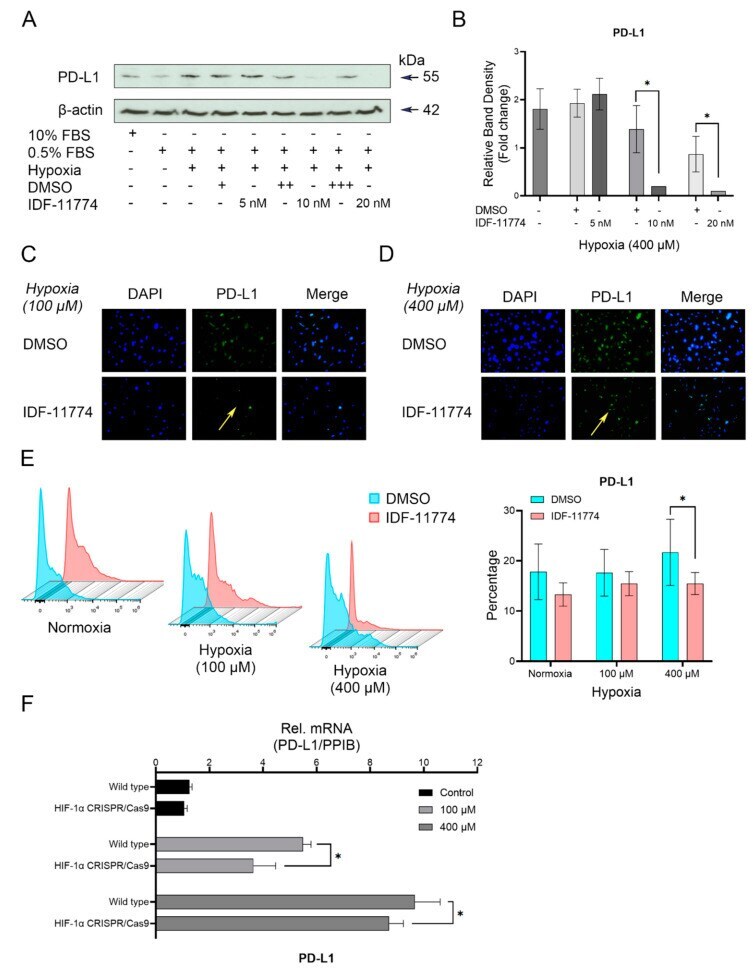
- Hypoxia-correlated PD-L1 expression is dependently with HIF-1alpha signaling in OCCM-30 cells. ( A , B ) Western blot analysis of PD-L1 protein levels under hypoxia in response to IDF-11774 (20 uM). Graphs show the fold change of PD-L1 expression as compared to their corresponding control group. Internal beta-actin levels serve as loading control. ( C , D ) Representative IF staining showing the expression of PD-L1 in hypoxia-stimulated OCCM-30 cells with treatment of IDF-11774 (20 uM) for 24 h. Yellow arrows indicated the PD-L1 positive cells. ( E ) Representative plots of the analysis of the expression level of PD-L1 in OCCM-30 by flow cytometry. The graphic shows the values of PD-L1 positive cells normalized to total cells. Data are expressed as percentage. Each group was performed in triplicate. ( F ) Knockdown of HIF-1alpha gene expression by CRISPR/Cas9 decreased the hypoxia-induced PD-L1 gene expression in OCCM-30 cells. The blots and photomicrographs represent three independent experiments with SD. Statistically significant differences (indicated by asterisks) are indicated as follows (ns, no significant difference; * p < 0.05).