 Explore
 Validate
 Learn
LearnPA5-28115
antibody from Invitrogen Antibodies
Targeting: CD274
B7-H, B7-H1, B7H1, PD-L1, PDCD1LG1, PDL1
 Western blot
 Immunocytochemistry
 Flow cytometry
Antibody data
- Antibody Data
- Antigen structure
- References [14]
- Comments [0]
- Validations
- Immunocytochemistry [2]
- Immunohistochemistry [2]
- Other assay [11]
Submit
Validation data
Reference
Comment
Report error
- Product number
- PA5-28115 - Provider product page

- Provider
- Invitrogen Antibodies
- Product name
- PD-L1 Polyclonal Antibody
- Antibody type
- Polyclonal
- Antigen
- Synthetic peptide
- Description
- Recommended positive controls: A431, MDA-MB-231, MDA-MB-231 (24 µg/mL Tunicamycin treatment for 16 hr), MDA-MB-231, A549 (100 ng/mL IFN-gamma treatment for 48 hr), A431 (100 ng/mL IFN-gamma treatment for 48 hr). Store product as a concentrated solution. Centrifuge briefly prior to opening the vial.
- Reactivity
- Human
- Host
- Rabbit
- Isotype
- IgG
- Vial size
- 100 μL
- Concentration
- 0.97 mg/mL
- Storage
- Store at 4°C short term. For long term storage, store at -20°C, avoiding freeze/thaw cycles.
Submitted references Evaluation PD-L1, CD8 and CD20 as early predictor and tracking markers for breast cancer (BC) in Egypt.
Therapeutic and immunomodulatory potential of pazopanib in malignant phyllodes tumor.
Licorice extract inhibits growth of non-small cell lung cancer by down-regulating CDK4-Cyclin D1 complex and increasing CD8(+) T cell infiltration.
Deep Phenotypic Characterisation of CTCs by Combination of Microfluidic Isolation (IsoFlux) and Imaging Flow Cytometry (ImageStream).
Rapidly fatal pneumonitis from immunotherapy and concurrent SARS-CoV-2 infection in a patient with newly diagnosed lung cancer.
The deubiquitinase USP22 regulates PD-L1 degradation in human cancer cells.
MLLT6 maintains PD-L1 expression and mediates tumor immune resistance.
Immuno-PET Imaging of the Programmed Cell Death-1 Ligand (PD-L1) Using a Zirconium-89 Labeled Therapeutic Antibody, Avelumab.
HDAC6‑selective inhibitor synergistically enhances the anticancer activity of immunomodulatory drugs in multiple myeloma.
A case report of clonal EBV-like memory CD4(+) T cell activation in fatal checkpoint inhibitor-induced encephalitis.
Cancer immunotherapy using PolyPurine Reverse Hoogsteen hairpins targeting the PD-1/PD-L1 pathway in human tumor cells.
The HDAC6 inhibitor ACY‑1215 enhances the anticancer activity of oxaliplatin in colorectal cancer cells.
A Unique Cellular and Molecular Microenvironment Is Present in Tertiary Lymphoid Organs of Patients with Spontaneous Prostate Cancer Regression.
Essential role of HDAC6 in the regulation of PD-L1 in melanoma.
Hamed MM, Gouida MS, Abd El-Aziz SR, El-Sokkary AMA
Heliyon 2022 May;8(5):e09474
Heliyon 2022 May;8(5):e09474
Therapeutic and immunomodulatory potential of pazopanib in malignant phyllodes tumor.
Ng DYX, Li Z, Lee E, Kok JST, Lee JY, Koh J, Ng CC, Lim AH, Liu W, Ng SR, Lim KS, Huang XX, Hong JH, Guan P, Sim Y, Thike AA, Nasir NDM, Li S, Tan PH, Teh BT, Chan JY
NPJ breast cancer 2022 Apr 1;8(1):44
NPJ breast cancer 2022 Apr 1;8(1):44
Licorice extract inhibits growth of non-small cell lung cancer by down-regulating CDK4-Cyclin D1 complex and increasing CD8(+) T cell infiltration.
Zhu J, Huang R, Yang R, Xiao Y, Yan J, Zheng C, Xiao W, Huang C, Wang Y
Cancer cell international 2021 Oct 12;21(1):529
Cancer cell international 2021 Oct 12;21(1):529
Deep Phenotypic Characterisation of CTCs by Combination of Microfluidic Isolation (IsoFlux) and Imaging Flow Cytometry (ImageStream).
Ruiz-Rodríguez AJ, Molina-Vallejo MP, Aznar-Peralta I, González Puga C, Cañas García I, González E, Lorente JA, Serrano MJ, Garrido-Navas MC
Cancers 2021 Dec 20;13(24)
Cancers 2021 Dec 20;13(24)
Rapidly fatal pneumonitis from immunotherapy and concurrent SARS-CoV-2 infection in a patient with newly diagnosed lung cancer.
Lovly CM, Boyd KL, Gonzalez-Ericsson PI, Lowe CL, Brown HM, Hoffman RD, Sterling BC, Kapp ME, Johnson DB, Kopparapu PR, Iams WT, Warren MA, Noto MJ, Rini BI, Jagasia M, Das SR, Balko JM
medRxiv : the preprint server for health sciences 2020 May 1;
medRxiv : the preprint server for health sciences 2020 May 1;
The deubiquitinase USP22 regulates PD-L1 degradation in human cancer cells.
Wang Y, Sun Q, Mu N, Sun X, Wang Y, Fan S, Su L, Liu X
Cell communication and signaling : CCS 2020 Jul 14;18(1):112
Cell communication and signaling : CCS 2020 Jul 14;18(1):112
MLLT6 maintains PD-L1 expression and mediates tumor immune resistance.
Sreevalsan S, Döring M, Paszkowski-Rogacz M, Brux M, Blanck C, Meyer M, Momburg F, Buchholz F, Theis M
EMBO reports 2020 Dec 3;21(12):e50155
EMBO reports 2020 Dec 3;21(12):e50155
Immuno-PET Imaging of the Programmed Cell Death-1 Ligand (PD-L1) Using a Zirconium-89 Labeled Therapeutic Antibody, Avelumab.
Jagoda EM, Vasalatiy O, Basuli F, Opina ACL, Williams MR, Wong K, Lane KC, Adler S, Ton AT, Szajek LP, Xu B, Butcher D, Edmondson EF, Swenson RE, Greiner J, Gulley J, Eary J, Choyke PL
Molecular imaging 2019 Jan-Dec;18:1536012119829986
Molecular imaging 2019 Jan-Dec;18:1536012119829986
HDAC6‑selective inhibitor synergistically enhances the anticancer activity of immunomodulatory drugs in multiple myeloma.
Won HR, Lee DH, Yeon SK, Ryu HW, Kim GW, Kwon SH
International journal of oncology 2019 Aug;55(2):499-512
International journal of oncology 2019 Aug;55(2):499-512
A case report of clonal EBV-like memory CD4(+) T cell activation in fatal checkpoint inhibitor-induced encephalitis.
Johnson DB, McDonnell WJ, Gonzalez-Ericsson PI, Al-Rohil RN, Mobley BC, Salem JE, Wang DY, Sanchez V, Wang Y, Chastain CA, Barker K, Liang Y, Warren S, Beechem JM, Menzies AM, Tio M, Long GV, Cohen JV, Guidon AC, O'Hare M, Chandra S, Chowdhary A, Lebrun-Vignes B, Goldinger SM, Rushing EJ, Buchbinder EI, Mallal SA, Shi C, Xu Y, Moslehi JJ, Sanders ME, Sosman JA, Balko JM
Nature medicine 2019 Aug;25(8):1243-1250
Nature medicine 2019 Aug;25(8):1243-1250
Cancer immunotherapy using PolyPurine Reverse Hoogsteen hairpins targeting the PD-1/PD-L1 pathway in human tumor cells.
Medina Enríquez MM, Félix AJ, Ciudad CJ, Noé V
PloS one 2018;13(11):e0206818
PloS one 2018;13(11):e0206818
The HDAC6 inhibitor ACY‑1215 enhances the anticancer activity of oxaliplatin in colorectal cancer cells.
Lee DH, Won HR, Ryu HW, Han JM, Kwon SH
International journal of oncology 2018 Aug;53(2):844-854
International journal of oncology 2018 Aug;53(2):844-854
A Unique Cellular and Molecular Microenvironment Is Present in Tertiary Lymphoid Organs of Patients with Spontaneous Prostate Cancer Regression.
García-Hernández ML, Uribe-Uribe NO, Espinosa-González R, Kast WM, Khader SA, Rangel-Moreno J
Frontiers in immunology 2017;8:563
Frontiers in immunology 2017;8:563
Essential role of HDAC6 in the regulation of PD-L1 in melanoma.
M L, P PV, T K, M P, E S, J P, K V W, C L, F C, S D, M SKS, M M, A K, J PI, A S, E S, J W, E M S, A V
Molecular oncology 2016 May;10(5):735-750
Molecular oncology 2016 May;10(5):735-750
No comments: Submit comment
Supportive validation
- Submitted by
- Invitrogen Antibodies (provider)
- Main image

- Experimental details
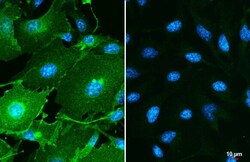
- Immunocytochemistry-Immunofluorescence analysis of PD-L1 was performed in MDA-MB-231 (left) and HeLa (right) cells fixed in ice-cold MeOH for 5 min. Green: PD-L1 Polyclonal Antibody (Product # PA5-28115) diluted at 1:500. Blue: Hoechst 33342 staining. Scale bar = 10 µm.

- Submitted by
- Invitrogen Antibodies (provider)
- Main image
- Experimental details
- Immunocytochemistry-Immunofluorescence analysis of PD-L1 was performed in MDA-MB-231 (left) and HeLa (right) cells fixed in ice-cold MeOH for 5 min. Green: PD-L1 Polyclonal Antibody (Product # PA5-28115) diluted at 1:500. Blue: Hoechst 33342 staining. Scale bar = 10 µm.

Supportive validation
- Submitted by
- Invitrogen Antibodies (provider)
- Main image
- Experimental details
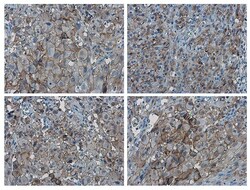
- Immunohistochemistry (Paraffin) analysis of PD-L1 was performed in paraffin-embedded human ovarian carcinoma tissue using PD-L1 Polyclonal Antibody (Product # PA5-28115) at a dilution of 1:1000.
- Submitted by
- Invitrogen Antibodies (provider)
- Main image
- Experimental details
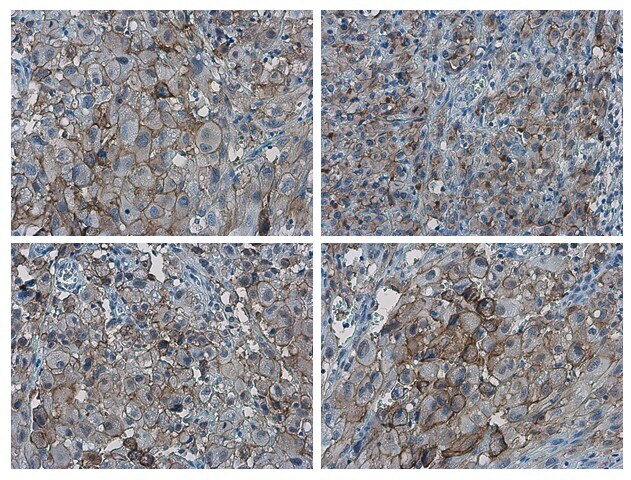
- PD-L1 Polyclonal Antibody detects PD-L1 protein at cell membrane by immunohistochemical analysis. Sample: Paraffin-embedded human ovarian cancer. PD-L1 stained by PD-L1 Polyclonal Antibody (Product # PA5-28115) diluted at 1:4,000. Antigen Retrieval: Citrate buffer, pH 6.0, 15 min.

Supportive validation
- Submitted by
- Invitrogen Antibodies (provider)
- Main image
- Experimental details
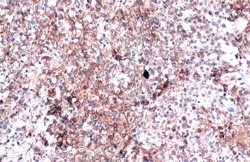
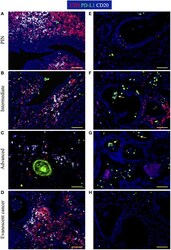
- Figure 7 Visualization of PD-L1 expression during prostate cancer progression and cancer regression . Prostate sections were stained with antibodies against CD3, PD-L1, and CD20. (A) In prostatectomies from patients with prostatic intraepithelial neoplasia (PIN), PD-L1 was expressed by a few cells intermixed with T cells. (B,C) At intermediate and advanced stages of prostate cancer, PD-L1 + cells were more numerous and were closely interacting with T cell and B cells. (D) PD-L1 + cells were scarce in tertiary lymphoid organs (TLO) from patients with evanescent prostate carcinoma. (E) Few PD-L1 + tumor-infiltrating cells are located in close proximity to epithelium in a prostatectomy from a patient with PIN. (F) . Although there is still accumulation of T cells close to glandular epithelium, more PD-L1 + cells accumulated in tumor areas of intermediate prostate cancer. (G) Considerable accumulation of PD-L1 + cells and lack of T cell infiltrates are seen in tumor areas of prostatectomies from advanced cancer patients. (H) A few cells positive for PD-L1 are detected in close proximity to glandular epithelium in samples from evanescent prostate carcinoma patients. Representative 200x magnification pictures from TLO and tumor areas were taken with a Zeiss Axioplan Microscope and recorded with a Hamamatsu Camera. Yellow scale bar represents 100 mum. Yellow arrows are pointing to PD-L1 + cells with polymorphonuclear-like morphology.

- Submitted by
- Invitrogen Antibodies (provider)
- Main image
- Experimental details
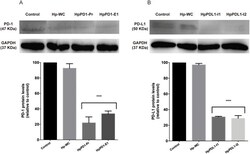
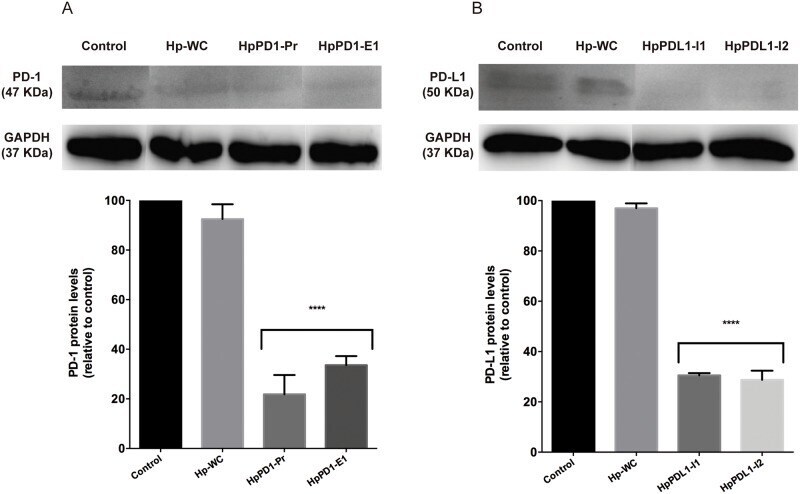
- Fig 4 Effect of PPRHs on PD-1 and PD-L1 protein levels. A) THP-1 cells (90,000) were transfected with two PPRHs against PD-1 and protein extracts were obtained after 48 h. B) PC3 cells (90,000) were transfected with two PPRHs against PD-L1 and proteins were extracted after 24 h. Representative Western blot images of PD-1 and PD-L1 are shown. The quantification of the changes in protein levels were determined upon normalization with the signal corresponding to GAPDH protein. Non-transfected cells and cells treated with the negative control hairpin were used as controls. Data represent the mean +- SEM of three experiments. (****p < 0.001).
- Submitted by
- Invitrogen Antibodies (provider)
- Main image

- Experimental details
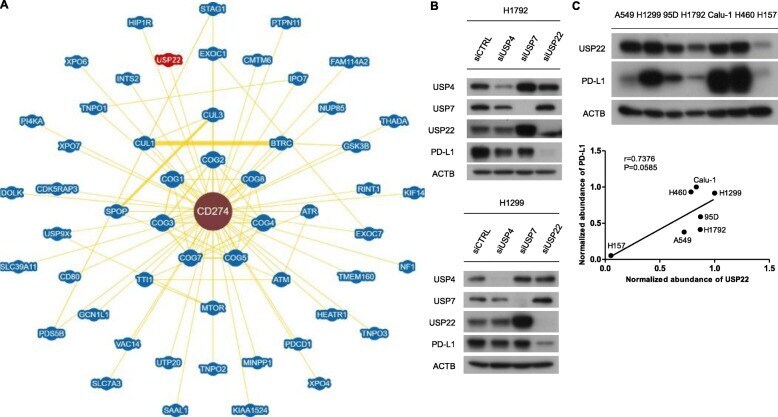
- Fig. 1 USP22 is a potential partner and regulator of PD-L1. a Interaction network of PD-L1 analyzed in BioGrid database. b H1792, H1299 cells were transfected with control (CTRL) or USP4, USP7, USP22 siRNA for 24 h and then subjected to western blot analysis. c Western blot analysis of USP22 and PD-L1 expression in seven NSCLC cell lines. Relative intensity of USP22 and PD-L1 were normalized to ACTB. The pearson correlation coefficient for the protein expression were presented
- Submitted by
- Invitrogen Antibodies (provider)
- Main image
- Experimental details
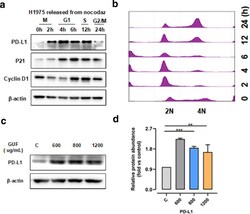
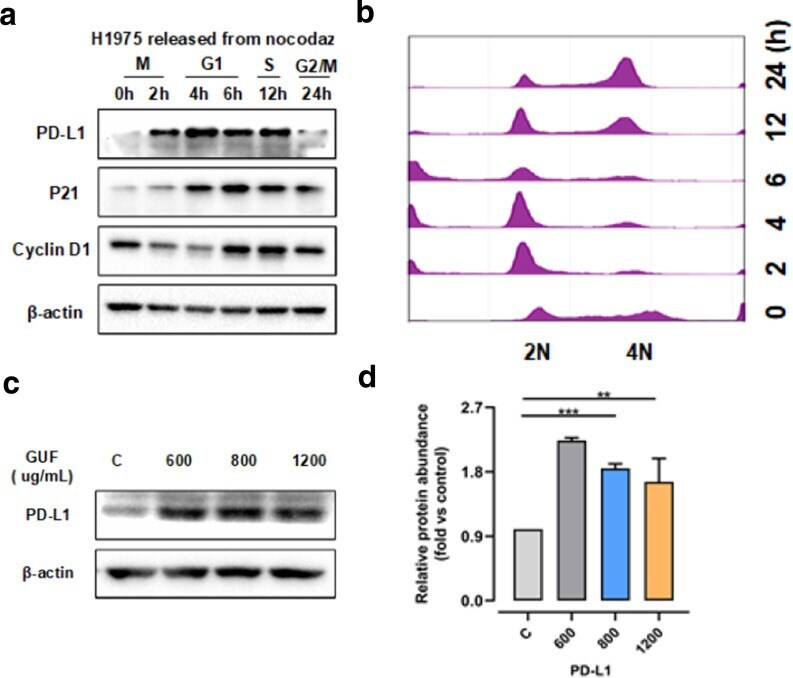
- Fig. 4 Licorice induces increase of expression level of PD-L1. a Western blot results of whole cell lysates derived from H1975 cells synchronized in M phase by nocodazole treatment prior to releasing back into the cell cycle for the indicated times. b The cell-cycle profiles in a were monitored by FACS. c The protein expression in H1975 cells pretreated with 400, 600, and 800 ug/ml GUF or vehicle control, was measured by western blot, versus beta-actin as a loading control. d Relative protein abundance of PD-L1 of c . **p < 0.01, ***p < 0.001
- Submitted by
- Invitrogen Antibodies (provider)
- Main image
- Experimental details
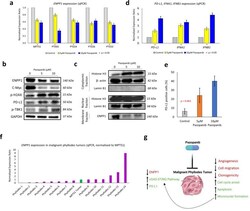
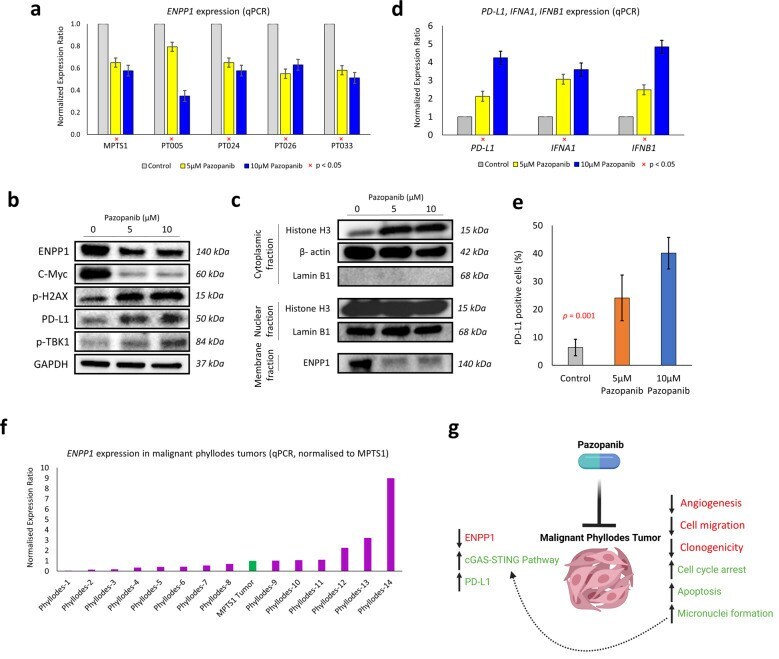
- Upregulation of STING pathway and PD-L1 by pazopanib. a Downregulation of ENPP1 expression by pazopanib across PT cell lines. b Western blot demonstrating decreased protein expression of ENPP1 and C-Myc, while phophos-H2AX, PD-L1, and phospho-TBK1 were increased. c On cellular fractionation, ENPP1 was shown to be significantly downregulated in the membrane fraction, while cytosolic DNA levels, detected using histone H3, increased following pazopanib treatment. d Upregulation of PD-L1 , INFA1 , and IFNB1 gene expression by pazopanib. e Similarly on flow cytometry, PD-L1 positive cells increased after pazopanib treatment. f Relative expression of ENPP1 across malignant phyllodes tumors, normalized against the MPT-S1 tumor sample. g Schematic depicting our main findings on the possible effects of pazopanib on malignant phyllodes tumors (created with BioRender.com).
- Submitted by
- Invitrogen Antibodies (provider)
- Main image
- Experimental details
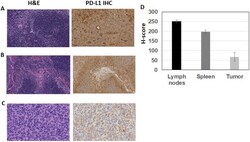
- Figure 5. Representative images (x20 magnification) of H&E and PD-L1 IHC-stained sections (A-C): (A) Nude mouse lymph node showing normal histology (H&E) and diffuse staining for PD-L1 (mouse) with vessels and cells within the paracortical regions displaying increased staining intensity; (B) Nude mouse spleen showing normal histology (H&E) and intense membranous staining for PD-L1 (mouse) with the most intense staining at the periphery of the white pulp; (C) MDA-MB231 tumor showing a viable region (H&E necrotic regions were observed in all sections) with membranous and cytoplasmic staining for PD-L1 (human) on the tumor cells; (D) IHC quantitative analysis (staining intensity score, H-score) of PD-L1 expression levels in lymph nodes, spleen, and MDA-MB231 tumors from mouse xenografts; each bar represents the mean H-score +- standard deviation (SD; n = 3, spleen and lymph nodes; n= 6, tumors).

- Submitted by
- Invitrogen Antibodies (provider)
- Main image
- Experimental details
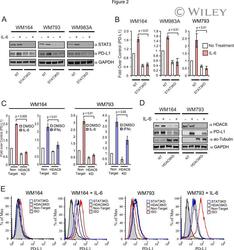
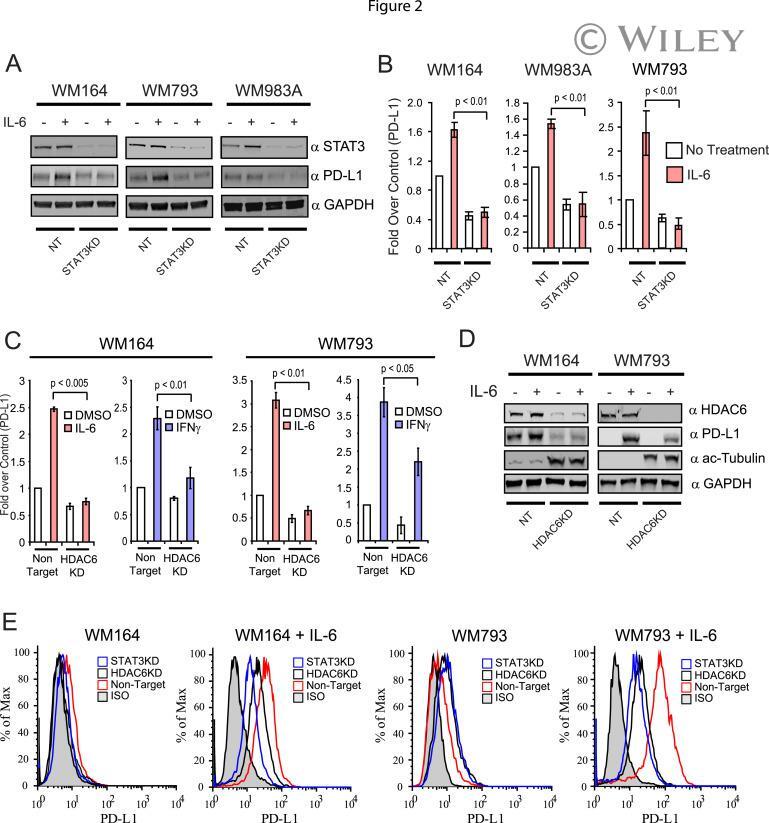
- HDAC6 modulates the expression of PD-L1 in melanoma cells. (A) NT and STAT3KD WM164, WM983A and WM793 melanoma cells were treated with IL-6 (30 ng/mL) or left untreated. The presence of STAT3, PD-L1 and GAPDH was evaluated by immunoblot. (B) Total RNA was isolated from NT and STAT3KD WM164 melanoma treated with IL-6 (30 ng/mL) or left untreated. Then, the expression of PD-L1 was analyzed by quantitative qRT-PCR. The results are expressed as a percent over control cells, and data normalized by GAPDH expression. This experiment was performed three times with similar results. Error bars represent standard deviation from triplicates. (C) Total RNA was isolated from NT and HDAC6KD WM164 and WM793 melanoma cells treated with IL-6 (30 ng/mL), IFNgamma (100 ng/mL) or untreated. The expression of PD-L1 was analyzed by quantitative qRT-PCR. These results are expressed as a percent over control cells, and data normalized by GAPDH expression. This experiment was performed three times with similar results. Error bars represent standard deviation from triplicates. (D) Immunoblotting analysis of PD-L1, acetylated tubulin and GAPDH proteins in NT and HDAC6KD WM164 and WM793 melanoma cells under stimulation of IL-6 (30 ng/mL). (E) Expression of PD-L1 was measured by flow cytometry in NT, HDAC6KD and STAT3KD melanoma cell lines with or without stimulation of IL-6 (30 ng/mL).
- Submitted by
- Invitrogen Antibodies (provider)
- Main image
- Experimental details
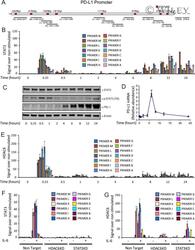
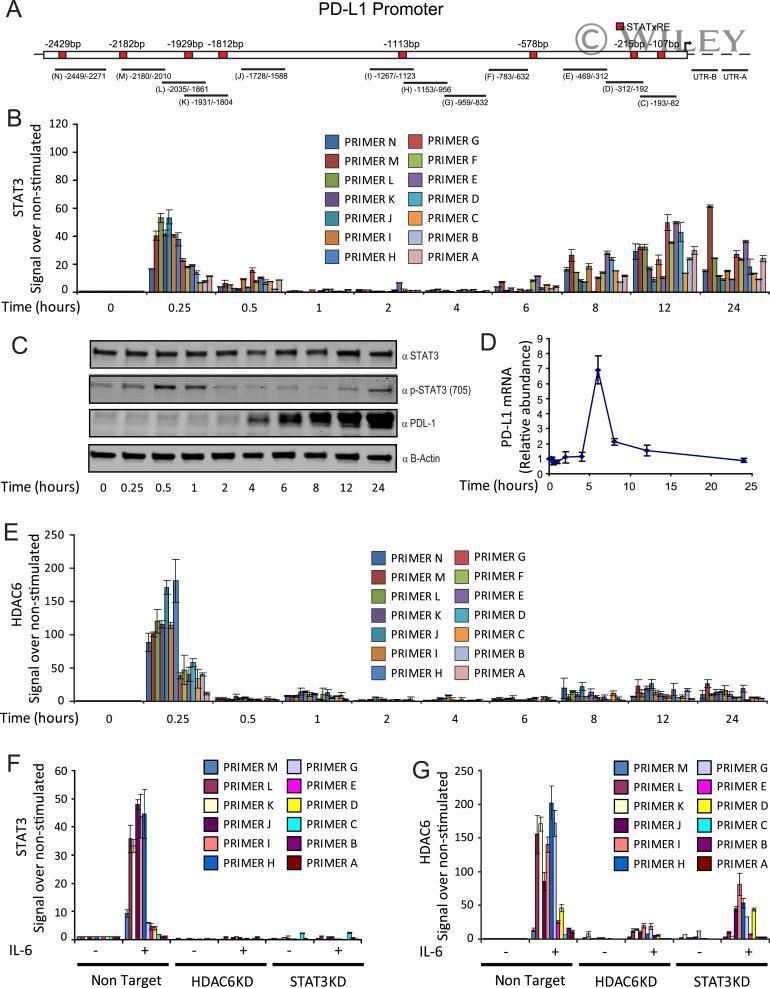
- HDAC6 and STAT3 are recruited to the PD-L1 promoter. (A) Schematic diagram of the PD-L1 promoter showing the potential STAT3 binding sites and primers used in the ChiP assays. ChiP analysis of WM164 wild type melanoma cell line stimulated with IL-6 (30 ng/mL) and collected at baseline (time 0) or at 0.25, 0.5, 1, 2, 4, 6, 8, 12 and 24 h after stimulation, assessed with HDAC6 (B) and STAT3 (E) antibodies, followed by quantitative real-time PCR analysis of the 14 different primers described above (detailed in Table 1). (C) WM164 cells were treated with IL-6 (30 ng/mL) and then evaluated by immunoblotting for the presence of STAT3, pSTAT3, PD-L1 and b-Actin. (D) Following the same conditions and time points from the previous experiment, RNA was isolated and the expression of PD-L1 analyzed by qRT-PCR. (E) ChiP analysis of WM164 cells following the same conditions and time points described in experiment (B). NT, HDAC6KD, STAT3KD WM164 cells with or without stimulation of IL-6 were subjected to ChIP and the presence of STAT3 (F) and HDAC6 (G) was evaluated after 15 min of IL-6 stimulation. The values obtained from all ChiP experiments were analyzed using the PfaffI method (Pfaffl, 2001) and are presented relative to input before immunoprecipitation. Data presented is from one representative experiment out of two independent experiments with similar results (error bars, s.d. of triplicates).
- Submitted by
- Invitrogen Antibodies (provider)
- Main image
- Experimental details
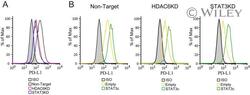
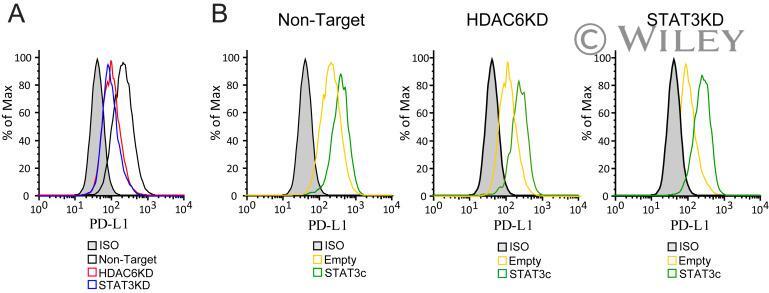
- Constitutive active STAT3 rescue PD-L1 expression in the absence of HDAC6. NT, HDAC6KD and STAT3KD WM164 melanoma cells were transfected with either STAT3C-flag plasmid (B) or empty vector (A) and then stimulated with IL-6 (30 ng/mL) or left untreated. Then, PD-L1 was evaluated by flow cytometry.
- Submitted by
- Invitrogen Antibodies (provider)
- Main image
- Experimental details
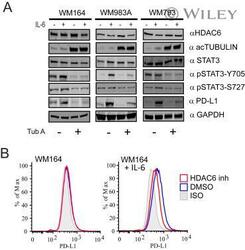
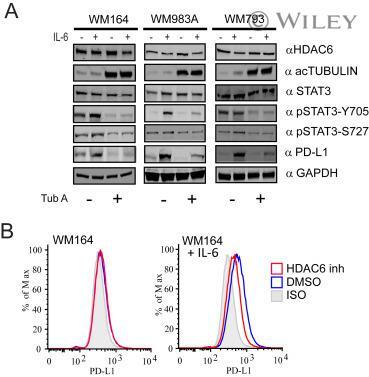
- Selective HDAC6 inhibitors down-regulate PD-L1 expression in vitro. (A) WM164, WM983A and WM793 human melanoma cell lines were incubated with the HDAC6 inhibitor Tubastatin A (3 muM) for 24 h, followed for IL-6 stimulation (30 ng/mL). Then, the cells were lyzed and immunoblotted using the specific antibodies listed in figure. (B) WM164 cells were treated with Tubastatin A (3 muM), with or without stimulation of IL-6 and then the expression of PD-L1 was analyzed by flow cytometry.
- Submitted by
- Invitrogen Antibodies (provider)
- Main image
- Experimental details
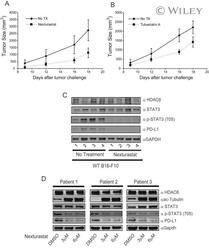
- Selective HDAC6 inhibitors down-regulate PD-L1 expression in vivo. In vivo tumor growth of C57BL/6 mice injected subcutaneously with B16-F10-luc WT cells. Mice were treated by intraperitoneal injection daily with the HDAC6 inhibitors Nexturastat 25 mg/kg (A) and Tubastatin A 25 mg/kg (B). (C) Tumors were collected at the end point from C57BL mice either treated with Nexturastat or non-treated, and the presence of HDAC6, STAT3, pSTAT3, PD-L1 and GAPDH was evaluated by immunoblot. (D) Cells from melanoma patient's biopsies were treated or untreated with Nexturastat (3 muM and 6 muM) and then the presence of HDAC6, STAT3, pSTAT3, PD-L1 and GAPDH was evaluated by immunoblot.
