 Explore
 Validate
 Learn
LearnPA5-50634
antibody from Invitrogen Antibodies
Targeting: CACNA1A
APCA, CACNL1A4, Cav2.1, EA2, FHM, HPCA, MHP, MHP1, SCA6
 Immunohistochemistry
Antibody data
- Antibody Data
- Antigen structure
- References [1]
- Comments [0]
- Validations
- Immunohistochemistry [2]
- Other assay [1]
Submit
Validation data
Reference
Comment
Report error
- Product number
- PA5-50634 - Provider product page

- Provider
- Invitrogen Antibodies
- Product name
- CaV2.1 Polyclonal Antibody
- Antibody type
- Polyclonal
- Antigen
- Synthetic peptide
- Description
- The antibody detects endogenous levels of total CACNA1A protein.
- Reactivity
- Human
- Host
- Rabbit
- Isotype
- IgG
- Vial size
- 100 μL
- Concentration
- 1.5 mg/mL
- Storage
- -20°C
Submitted references A genetically defined disease model reveals that urothelial cells can initiate divergent bladder cancer phenotypes.
Wang L, Smith BA, Balanis NG, Tsai BL, Nguyen K, Cheng MW, Obusan MB, Esedebe FN, Patel SJ, Zhang H, Clark PM, Sisk AE, Said JW, Huang J, Graeber TG, Witte ON, Chin AI, Park JW
Proceedings of the National Academy of Sciences of the United States of America 2020 Jan 7;117(1):563-572
Proceedings of the National Academy of Sciences of the United States of America 2020 Jan 7;117(1):563-572
No comments: Submit comment
Supportive validation
- Submitted by
- Invitrogen Antibodies (provider)
- Main image

- Experimental details
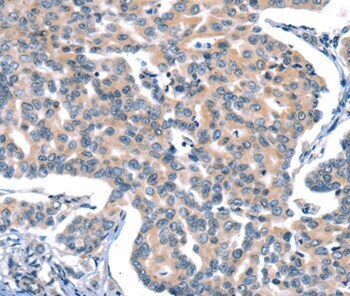
- Immunohistochemical analysis of CaV2.1 in paraffin embedded Human gastric cancer tissue using CaV2.1 Polyclonal Antibody (Product # PA5-50634) at a 1:15 dilution.
- Submitted by
- Invitrogen Antibodies (provider)
- Main image
- Experimental details
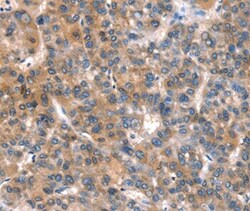
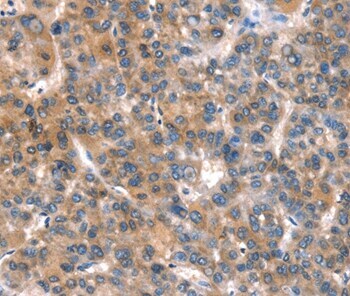
- Immunohistochemical analysis of CaV2.1 in paraffin embedded Human liver cancer tissue using CaV2.1 Polyclonal Antibody (Product # PA5-50634) at a 1:15 dilution.
Supportive validation
- Submitted by
- Invitrogen Antibodies (provider)
- Main image
- Experimental details
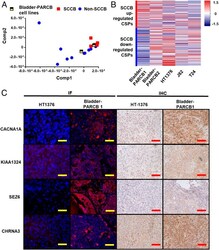
- Fig. 4. Bladder-PARCB cell lines share similar CSP profile with clinical SCCB samples. Bladder-PARCB cell lines express SCCB-associated CSPs at mRNA and protein levels. ( A ) PLSR projecting the CSP transcriptional profile of bladder-PARCB cell lines to the UCLA-BLCA cohort. The bladder-PARCB1 cell line is clustered with clinical SCCB samples. ( B ) Heatmap summarized the expression of phenotype-associated CSPs in bladder-PARCB cell lines and urothelial carcinoma cell lines NCI-HT1376, J82, and T24. Data are shown by the z -score normalized by genes across cell lines based on the TPM of genes in each cell line. Each row represents a gene. Red color indicates higher expression level (higher z -score); blue color indicates lower expression level (lower z -score). ( C ) Representative image of IF or IHC using antibody against CACNA1A, KIAA1324, CHRNA3, and SEZ6 in tumor derived from HT-1376 and PARCB cell lines. In the IF panel, blue color shows nuclear staining by DAPI, red color indicates positivity of CSPs. (Scale bars, 100 mum.)
