Explore
 Validate
 Learn
Learn Flow cytometry
Antibody data
- Antibody Data
- Antigen structure
- References [11]
- Comments [0]
- Validations
- Flow cytometry [1]
- Other assay [6]
Submit
Validation data
Reference
Comment
Report error
- Product number
- 50-5841-80 - Provider product page

- Provider
- Invitrogen Antibodies
- Product name
- OCT3/4 Monoclonal Antibody (EM92), eFluor™ 660, eBioscience™
- Antibody type
- Monoclonal
- Antigen
- Other
- Description
- Description: The EM92 monoclonal antibody reacts with mouse and human Oct3/4, encoded by the Pou5F1 gene. Oct3/4 is a POU domain-containing transcription factor that is critical for maintaining embryonic stem (ES) and induced pluripotent stem (iPS) cells in a pluripotent state, and is expressed by ES, embryonic germ cells and embryonic carcinoma cell lines. In cells of the inner cell mass (ICM), reduction of Oct3/4 expression causes dedifferentiation to trophoectoderm, whereas increased expression results in differentiation to mesoderm and primitive endoderm. Oct3/4 regulates the expression of several genes, including FGF-4, UTF1, Sox2, Fbx15, Rex1 and osteopontin through distinct mechanisms. Furthermore, Oct3/4 frequently acts synergistically with Sox2 to regulate target gene expression, as is the case with FGF-4. It has been demonstrated that Oct3/4 expression in ES cells can be negatively regulated by either treatment with retinoic acid, or by removal of leukemia-inhibitory factor (LIF).
- Antibody clone number
- EM92
- Concentration
- 0.2 mg/mL
Submitted references Comparative analysis of CI- and CIV-containing respiratory supercomplexes at single-cell resolution.
CBP-mediated Wnt3a/β-catenin signaling promotes cervical oncogenesis initiated by Piwil2.
Human induced pluripotent stem cells ameliorate hyperoxia-induced lung injury in a mouse model.
Pressure-Driven Mitochondrial Transfer Pipeline Generates Mammalian Cells of Desired Genetic Combinations and Fates.
TAF5L and TAF6L Maintain Self-Renewal of Embryonic Stem Cells via the MYC Regulatory Network.
Glutamine independence is a selectable feature of pluripotent stem cells.
FOXA2 Is Required for Enhancer Priming during Pancreatic Differentiation.
Analyses of a Mutant Foxp3 Allele Reveal BATF as a Critical Transcription Factor in the Differentiation and Accumulation of Tissue Regulatory T Cells.
Multi-kilobase homozygous targeted gene replacement in human induced pluripotent stem cells.
Developmental-like bone regeneration by human embryonic stem cell-derived mesenchymal cells.
Highly upregulated Lhx2 in the Foxn1-/- nude mouse phenotype reflects a dysregulated and expanded epidermal stem cell niche.
Bertan F, Wischhof L, Scifo E, Guranda M, Jackson J, Marsal-Cots A, Piazzesi A, Stork M, Peitz M, Prehn JHM, Ehninger D, Nicotera P, Bano D
Cell reports methods 2021 May 24;1(1):100002
Cell reports methods 2021 May 24;1(1):100002
CBP-mediated Wnt3a/β-catenin signaling promotes cervical oncogenesis initiated by Piwil2.
Feng D, Yan K, Liang H, Liang J, Wang W, Yu H, Zhou Y, Zhao W, Dong Z, Ling B
Neoplasia (New York, N.Y.) 2021 Jan;23(1):1-11
Neoplasia (New York, N.Y.) 2021 Jan;23(1):1-11
Human induced pluripotent stem cells ameliorate hyperoxia-induced lung injury in a mouse model.
Mitchell A, Wanczyk H, Jensen T, Finck C
American journal of translational research 2020;12(1):292-307
American journal of translational research 2020;12(1):292-307
Pressure-Driven Mitochondrial Transfer Pipeline Generates Mammalian Cells of Desired Genetic Combinations and Fates.
Patananan AN, Sercel AJ, Wu TH, Ahsan FM, Torres A Jr, Kennedy SAL, Vandiver A, Collier AJ, Mehrabi A, Van Lew J, Zakin L, Rodriguez N, Sixto M, Tadros W, Lazar A, Sieling PA, Nguyen TL, Dawson ER, Braas D, Golovato J, Cisneros L, Vaske C, Plath K, Rabizadeh S, Niazi KR, Chiou PY, Teitell MA
Cell reports 2020 Dec 29;33(13):108562
Cell reports 2020 Dec 29;33(13):108562
TAF5L and TAF6L Maintain Self-Renewal of Embryonic Stem Cells via the MYC Regulatory Network.
Seruggia D, Oti M, Tripathi P, Canver MC, LeBlanc L, Di Giammartino DC, Bullen MJ, Nefzger CM, Sun YBY, Farouni R, Polo JM, Pinello L, Apostolou E, Kim J, Orkin SH, Das PP
Molecular cell 2019 Jun 20;74(6):1148-1163.e7
Molecular cell 2019 Jun 20;74(6):1148-1163.e7
Glutamine independence is a selectable feature of pluripotent stem cells.
Vardhana SA, Arnold PK, Rosen BP, Chen Y, Carey BW, Huangfu D, Carmona Fontaine C, Thompson CB, Finley LWS
Nature metabolism 2019 Jul;1(7):676-687
Nature metabolism 2019 Jul;1(7):676-687
FOXA2 Is Required for Enhancer Priming during Pancreatic Differentiation.
Lee K, Cho H, Rickert RW, Li QV, Pulecio J, Leslie CS, Huangfu D
Cell reports 2019 Jul 9;28(2):382-393.e7
Cell reports 2019 Jul 9;28(2):382-393.e7
Analyses of a Mutant Foxp3 Allele Reveal BATF as a Critical Transcription Factor in the Differentiation and Accumulation of Tissue Regulatory T Cells.
Hayatsu N, Miyao T, Tachibana M, Murakami R, Kimura A, Kato T, Kawakami E, Endo TA, Setoguchi R, Watarai H, Nishikawa T, Yasuda T, Yoshida H, Hori S
Immunity 2017 Aug 15;47(2):268-283.e9
Immunity 2017 Aug 15;47(2):268-283.e9
Multi-kilobase homozygous targeted gene replacement in human induced pluripotent stem cells.
Byrne SM, Ortiz L, Mali P, Aach J, Church GM
Nucleic acids research 2015 Feb 18;43(3):e21
Nucleic acids research 2015 Feb 18;43(3):e21
Developmental-like bone regeneration by human embryonic stem cell-derived mesenchymal cells.
Kuhn LT, Liu Y, Boyd NL, Dennis JE, Jiang X, Xin X, Charles LF, Wang L, Aguila HL, Rowe DW, Lichtler AC, Goldberg AJ
Tissue engineering. Part A 2014 Jan;20(1-2):365-77
Tissue engineering. Part A 2014 Jan;20(1-2):365-77
Highly upregulated Lhx2 in the Foxn1-/- nude mouse phenotype reflects a dysregulated and expanded epidermal stem cell niche.
Bohr S, Patel SJ, Vasko R, Shen K, Huang G, Yarmush ML, Berthiaume F
PloS one 2013;8(5):e64223
PloS one 2013;8(5):e64223
No comments: Submit comment
Supportive validation
- Submitted by
- Invitrogen Antibodies (provider)
- Main image
- Experimental details
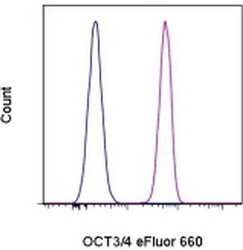
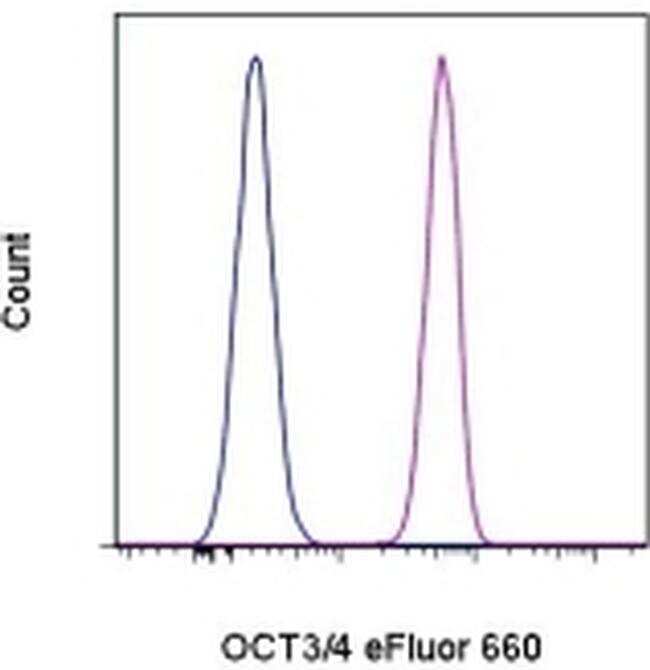
- Intracellular staining of F9 cells with 0.5 µg of Rat IgG2a K Isotype Control eFluor® 660 (Product # 50-4321-82) (blue histogram) or Anti-Human/Mouse OCT3/4 eFluor® 660 (purple histogram) using the Foxp3 Staining Buffer Set (Product # 00-5523-00) and protocol. Total cells were used for analysis.
Supportive validation
- Submitted by
- Invitrogen Antibodies (provider)
- Main image
- Experimental details
- NULL

- Submitted by
- Invitrogen Antibodies (provider)
- Main image
- Experimental details
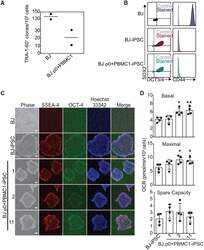
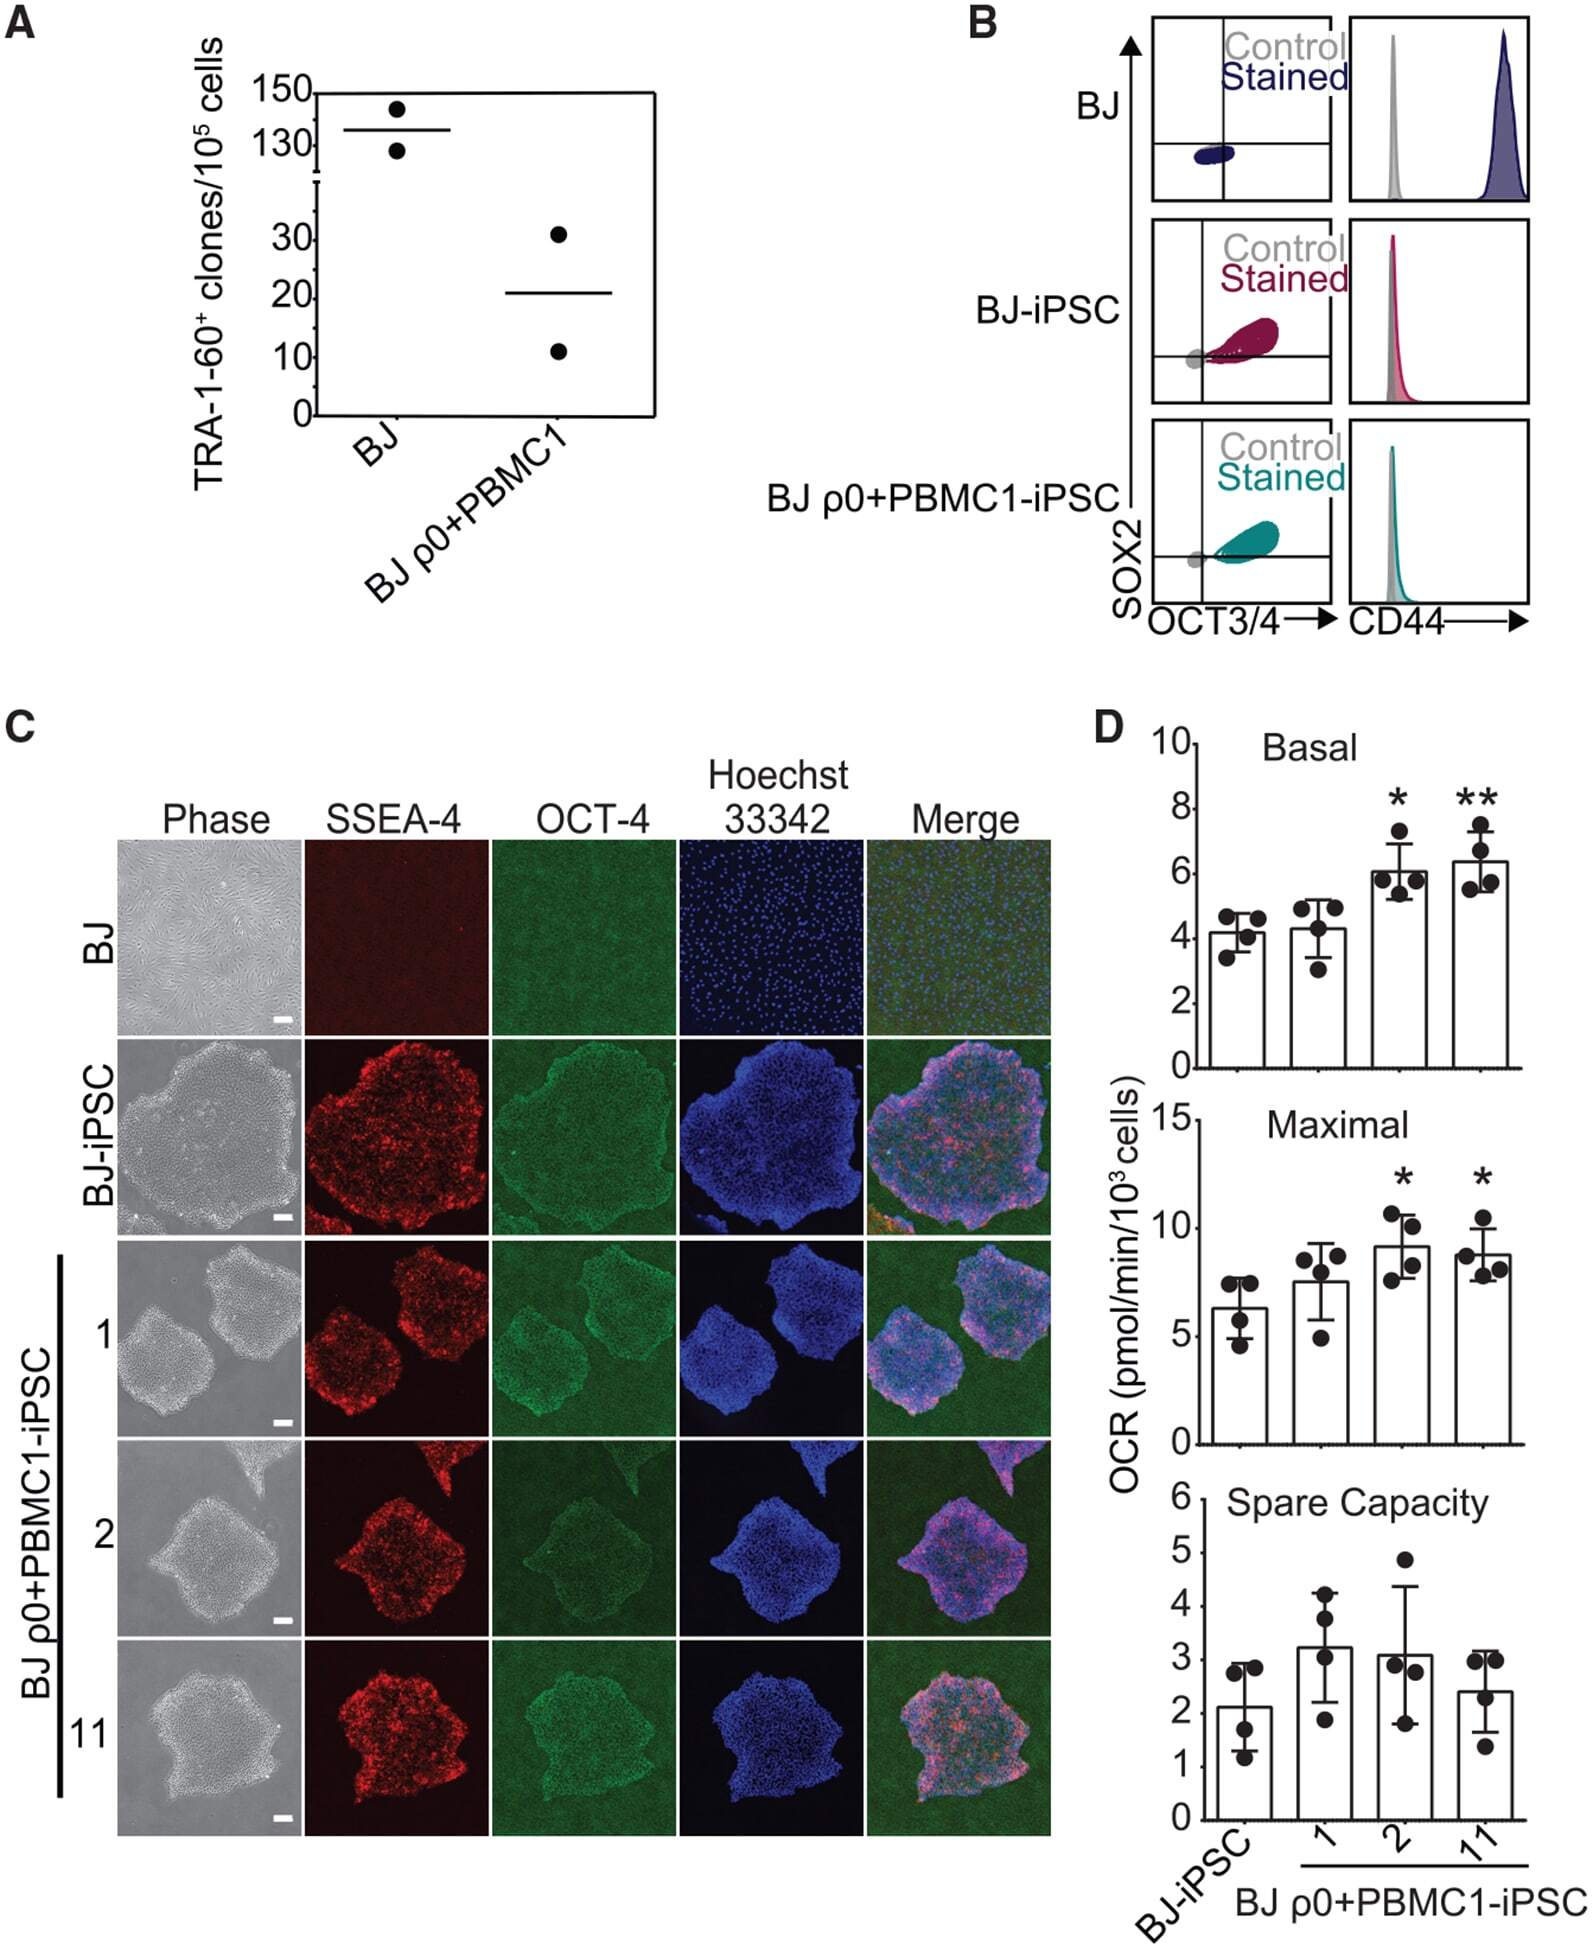
- Figure 3. SIMR Fibroblasts Can Be Reprogrammed (A) Native BJ and SIMR fibroblasts reprogrammed to iPSCs with TRA-1-60 + clones counted by microscopy. Data are the means of biological duplicates. Data for BJ fibroblast control are the same data as in Figure S3A . (B) Flow cytometry of pluripotency biomarkers SOX2 and OCT3/4, and fibroblast biomarker CD44. Immunostained samples are shown in color with isotype negative controls in gray. Representative data for native BJ fibroblasts and BJ-iPSCs, and for BJ rho0+PBMC1-iPSC cells. Data for the native BJ fibroblasts and BJ-iPSCs shown here are the same as in Figure S3B . (C) Representative phase contrast and IF microscopy images of native BJ fibroblast (negative control), BJ-iPSC (positive control), and three BJ rho0+PBMC1-iPSC clones immunostained for pluripotency biomarkers SSEA-4 and OCT4. Scale bars, 100 mum. (D) OCR measurements for ~1.5 x 10 4 native BJ-iPSCs and BJ rho0+PBMC1-iPSC clones 1, 2, and 11. Data for BJ-iPSC control are the same as in Figure S3D . Data are the means +- SD of four technical replicates. Statistical significance by unpaired, two-tailed Student''s t test. *p 0.05; **p 0.01 See also Figure S1 and Table S2 .
- Submitted by
- Invitrogen Antibodies (provider)
- Main image
- Experimental details
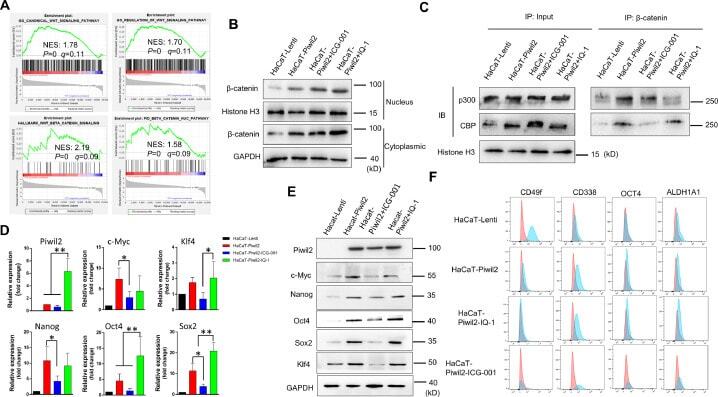
- Figure 4 CBP/beta-catenin promotes the maintenance of stem cell reprogramming by Piwil2. (A) GSEA plot showing significant enrichment of the Wnt/beta-catenin signaling activation modules in HaCaT-Piwil2 cells. (B) Immunoblotting of beta-catenin translocated into the nucleus in HaCaT-Piwil2 cells after treatment with 20 uM ICG-001 or IQ-1 for 24 h. (C) Nuclear lysates from HaCaT-Piwil2 cells treated with 20 uM ICG-001, 20 uM IQ-1, or DMSO were coimmunoprecipitated with antisera to beta-catenin and immunoblotted for CBP and p300. (D and E) The expression of Piwil2 and the ""reprogramming"" factors c-Myc, Nanog, Oct4, Sox2 , and Klf4 was determined by real-time PCR and immunoblotting in HaCaT-Piwil2 cells treated with 20 uM ICG-001, 20 uM IQ-1, or DMSO for 24 h. (F) The proportion of CD49f-, CD338-, OCT4-, and ALDHA1-positive cells, determined by flow cytometry in HaCaT-Piwil2 cells treated with 20 uM ICG-001, 20 uM IQ-1, or DMSO for 24 h. The data are presented as the mean +- SD. * P < 0.05 and ** P < 0.01 by Student's t test. Figure 4
- Submitted by
- Invitrogen Antibodies (provider)
- Main image
- Experimental details
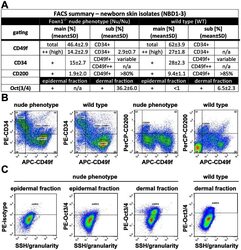
- Figure 4 As Oct3/4+ population is expanded; CD49f+, CD34+ and CD200+ populations are reduced in epithelial isolates from newborn skin of the Foxn1 -/- phenotype vs. wild type. (A) Flow cytometry summary table listing fractions positive for markers of progeny within epithelial isolates from newborns (%+-SD, n>6). Distinct differences between the Foxn1 -/- phenotype and wild type are demonstrated by comparative sample flow cytometry data gated for (B) CD49f, CD34, CD200 and (C) Oct3/4 positive epithelial fractions.

- Submitted by
- Invitrogen Antibodies (provider)
- Main image
- Experimental details
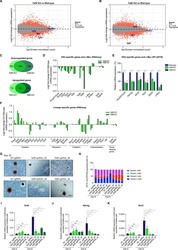
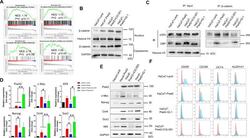
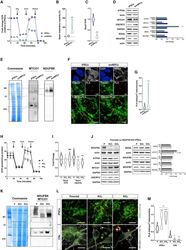
- Figure 4 CI*CIV-SC remodeling occurs during iPSC differentiation (A) OCR measurement of iPSCs and iPSC-derived smNPCs using a conventional Seahorse protocol (n = 3). (B) Mitochondrial spare respiratory capacity in human iPSCs and smNPCs. Percentage is relative to their respective basal OCRs (Student's t test, ****p < 0.0001). (C) Basal OCR in iPSCs and smNPCs (Student's t test, ****p < 0.0001). (D) Immunoblots using antibodies against OXPHOS system components in iPSCs and smNPCs. Densitometry is relative to iPSCs and reported as mean +- SEM (n = 3, Student's t test, ***p < 0.001, *p < 0.05). (E) BN-PAGE and corresponding immunoblots using antibodies against MTCO1 and NDUFB8. (F) Representative pictures of iPSCs and smNPCs stained with DAPI (nucleus, blue), TOM20 (mitochondria, green), and PLA (CI*CIV-SCs, red). Oct3 and nestin staining (both in gray) was used as markers of pluripotency and differentiation, respectively. Scale bar, 5 mum. (G) Quantification of PLA dots normalized to mitochondrial area in iPSCs and smNPCs (n = 3; iPSCs = 20 cells; smNPCs = 17 cells; Student's t test, ***p < 0.001). (H) OCR measurement of WT (P) and two independent clones of NDUFS4 KO iPSCs (KO 1 and KO 2 ). (I) Basal OCR and mitochondrial spare capacity of WT and NDUFS4 KO iPSCs (fold change, relative to WT; two-way RM ANOVA, ***p < 0.001, *p < 0.05; ns, not significant). (J) Immunoblot analysis of homogenates from parental and NDUFS4 KO iPSCs using antibodies against ETC subunits (CI, NDUFS4,

- Submitted by
- Invitrogen Antibodies (provider)
- Main image
- Experimental details
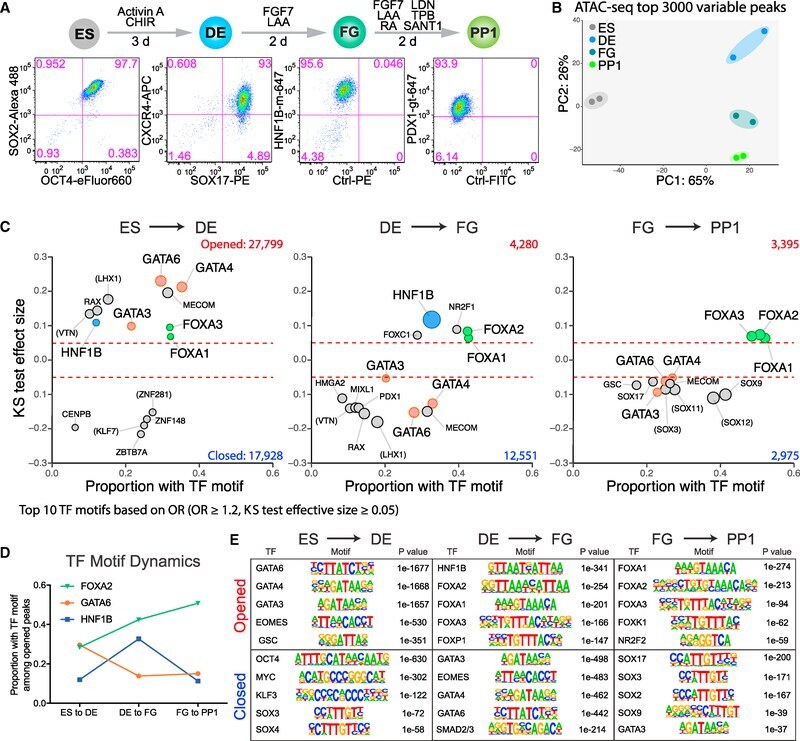
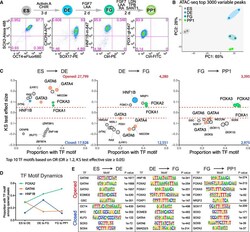
- Figure 1. Different Stages during Pancreatic Differentiation Are Associated with Distinct TF Motifs (A) Pancreatic differentiation efficiency was verified by examining lineage markers using flow cytometry. ES, embryonic stem cells; DE, definitive endoderm; FG, posterior foregut; PP1, primary pancreatic progenitor; d, day(s). See STAR Methods for a detailed differentiation protocol. (B) Principal-component analysis (PCA) of ATAC sequencing (ATAC-seq) for the top 3,000 variable peaks. (C) TF motif enrichment during stage transitions. The numbers of opened and closed peaks during stage transitions are indicated. Opened or closed peaks between successive stages were compared with the total atlas to examine the TF motif enrichments using the one-sided Kolmogorov-Smirnov (KS) test. The KS test effect size is shown on the y axis, and the proportion of peaks associated with the TF motif is plotted on the x axis. The size of each circle represents the odds ratio (OR), which was defined as the frequency of the TF in an opened or closed group divided by its frequency in the entire atlas. TF motifs with a KS test effect size >= 0.05 (indicated by the dashed lines) and OR >= 1.2 are shown; when there were more than 10 such motifs, only the top 10 are shown. TF motifs derived from species other than Homo sapiens are marked with brackets. GATA motifs (GATA2, GATA3, GATA4, and GATA6) are marked in red, the HNF1B motif is in blue, and FOXA motifs (FOXA1, FOXA2, and FOXA3) are in green. See al